TrustRadius: an HG Insights company

What is DashboardFox?

DashboardFox is cloud-based business intelligence and dashboard software from 5000fish, built for teams that create and deliver dashboards and reports to clients, departments, or business units. It is priced by monthly active users (MAU) rather than per seat, so organizations pay for a tier instead of for every login, and accounts that do not sign in are not counted.

Read more details.

Media

Screenshot of an interactive DashboardFox sales pipeline dashboard with KPI tiles, a revenue-by-rep chart, and a rep leaderboard. Business users filter by region, industry, or fiscal year and save their own views — self-service analytics with no SQL required.
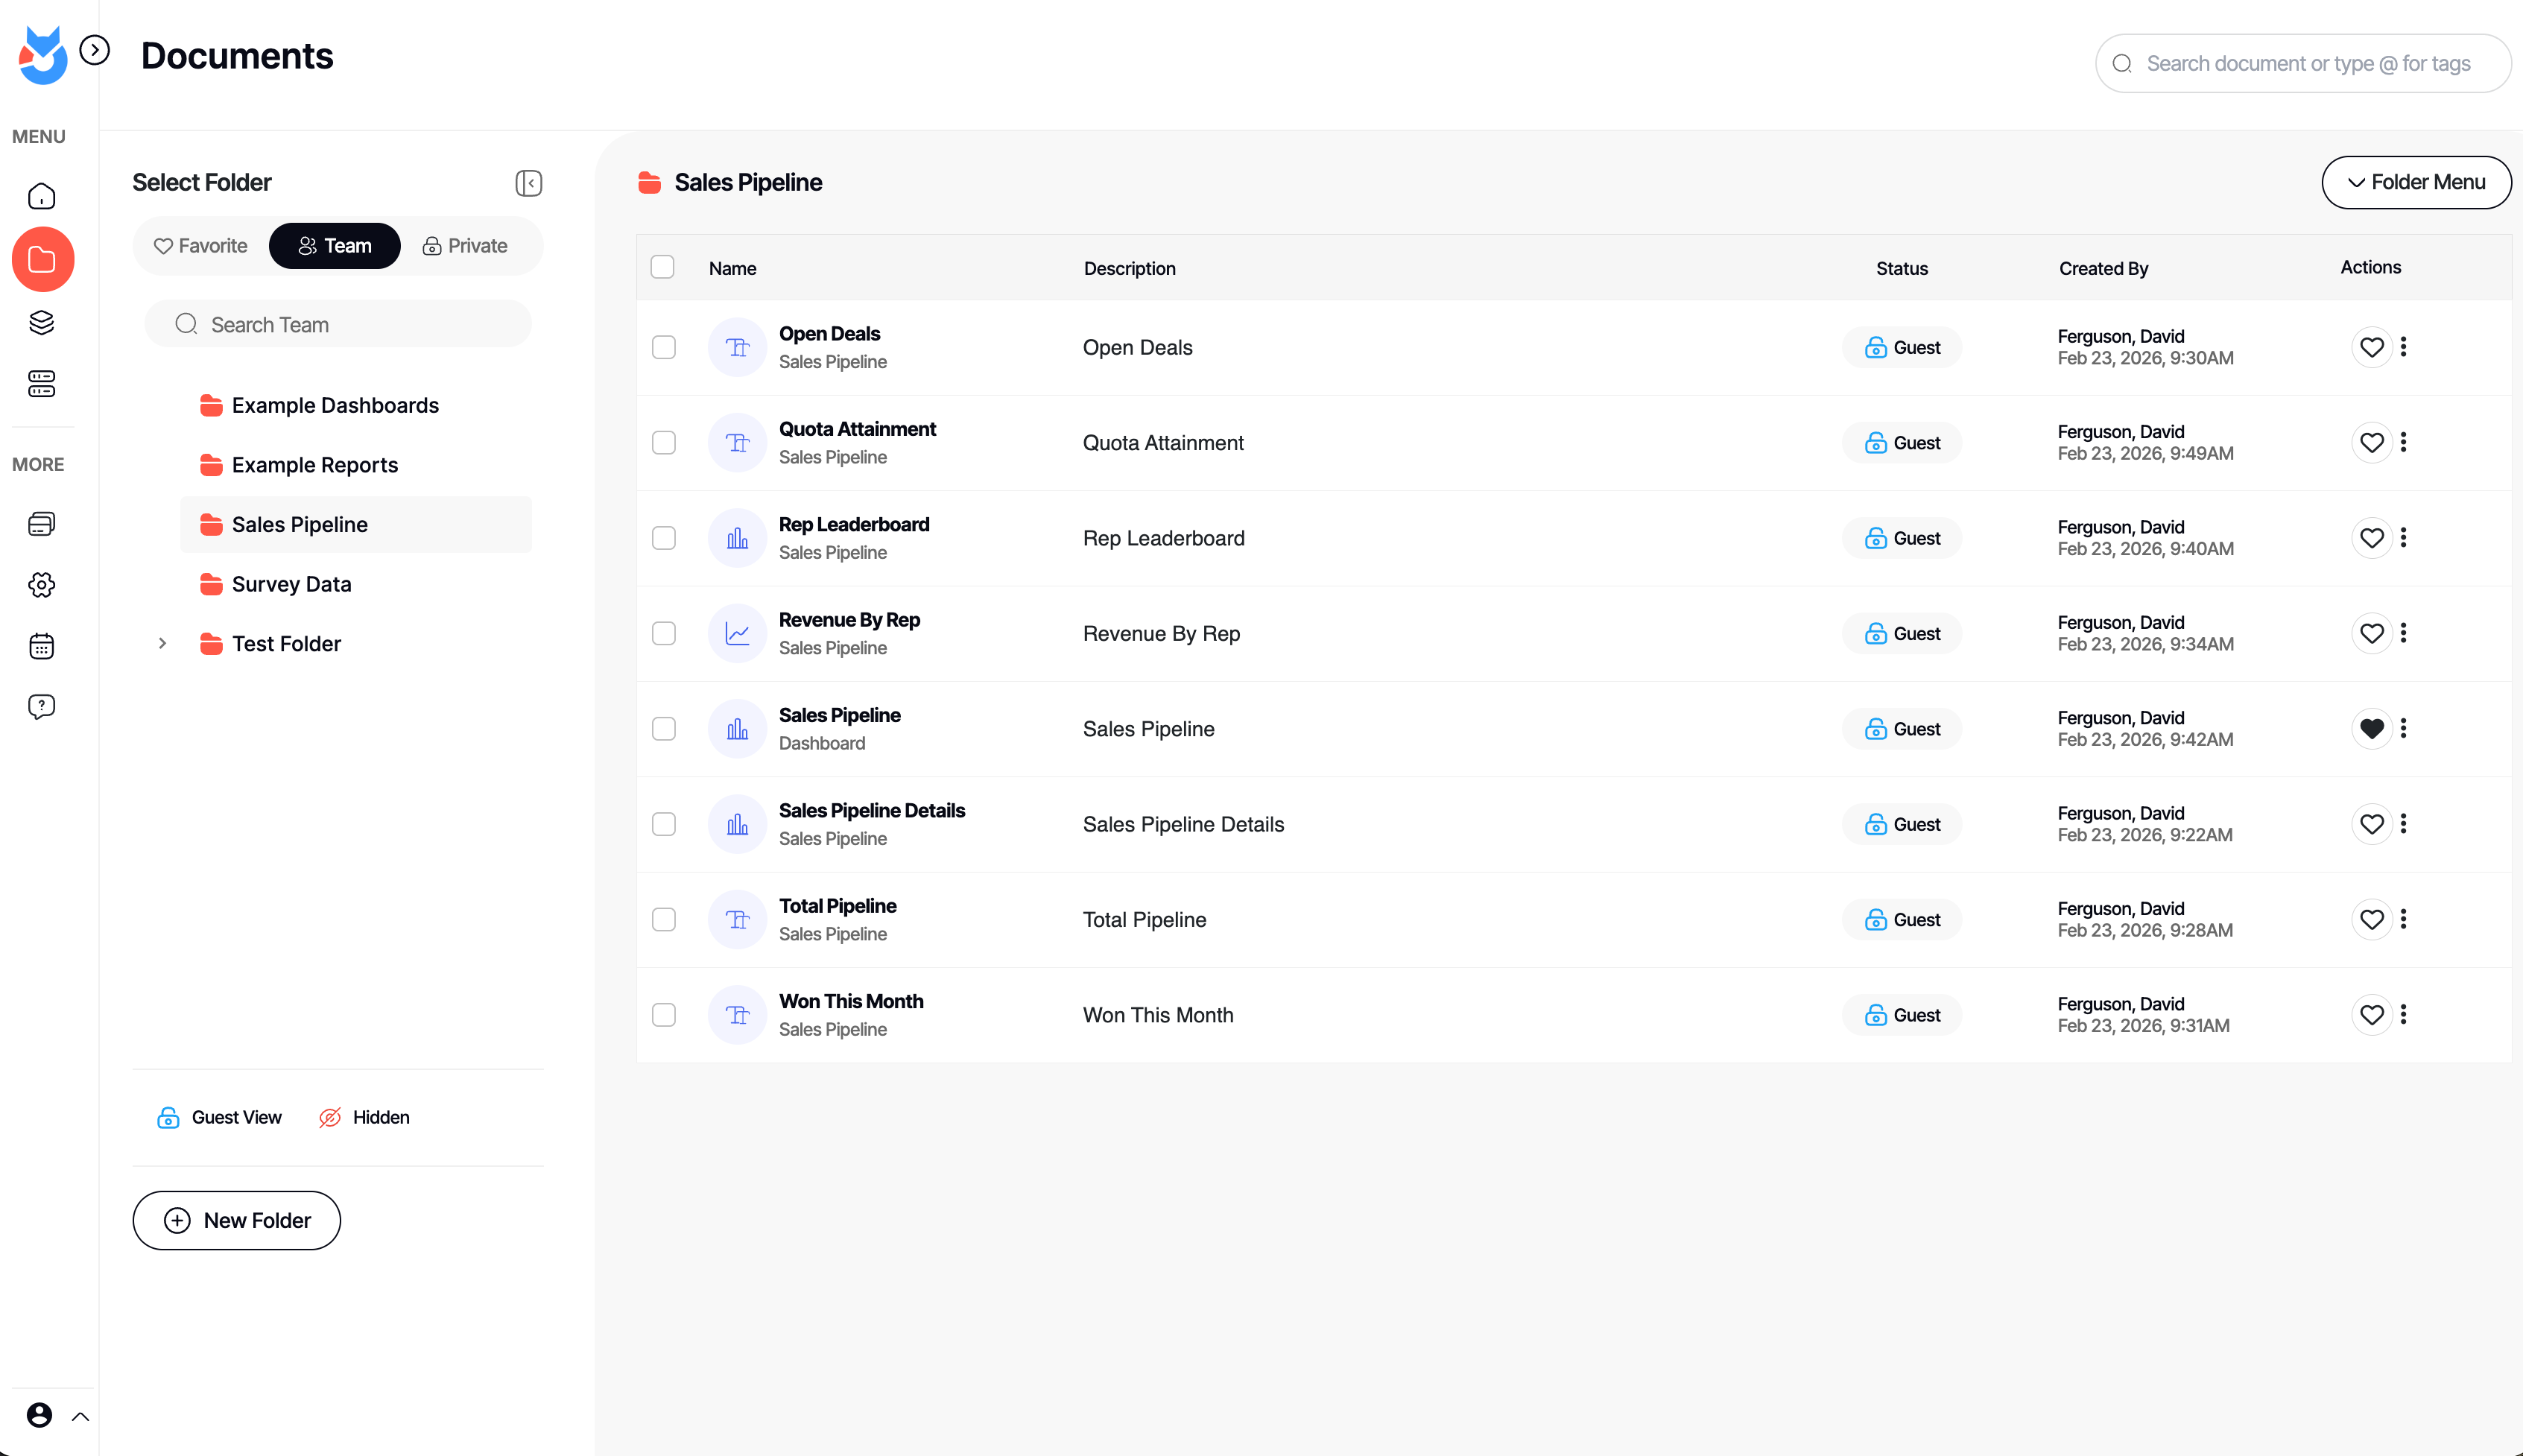
Screenshot of the Documents library in DashboardFox, where teams organize dashboards and reports into Team, Private, and Favorite folders. Share them with colleagues or clients, control guest access per item, and find any report fast with search and tags.
Screenshot of DashboardFox's report Composer: pick fields, apply formulas and sorting, and preview the result live as a chart. Build dashboards and reports across 20+ visualizations without writing code, then save and share them with your team or clients.
Screenshot of the App Builder in DashboardFox, where admins connect a data source and choose the exact tables and fields users can report on. Set up governed self-service reporting once, so business users only ever see the data they're allowed to.
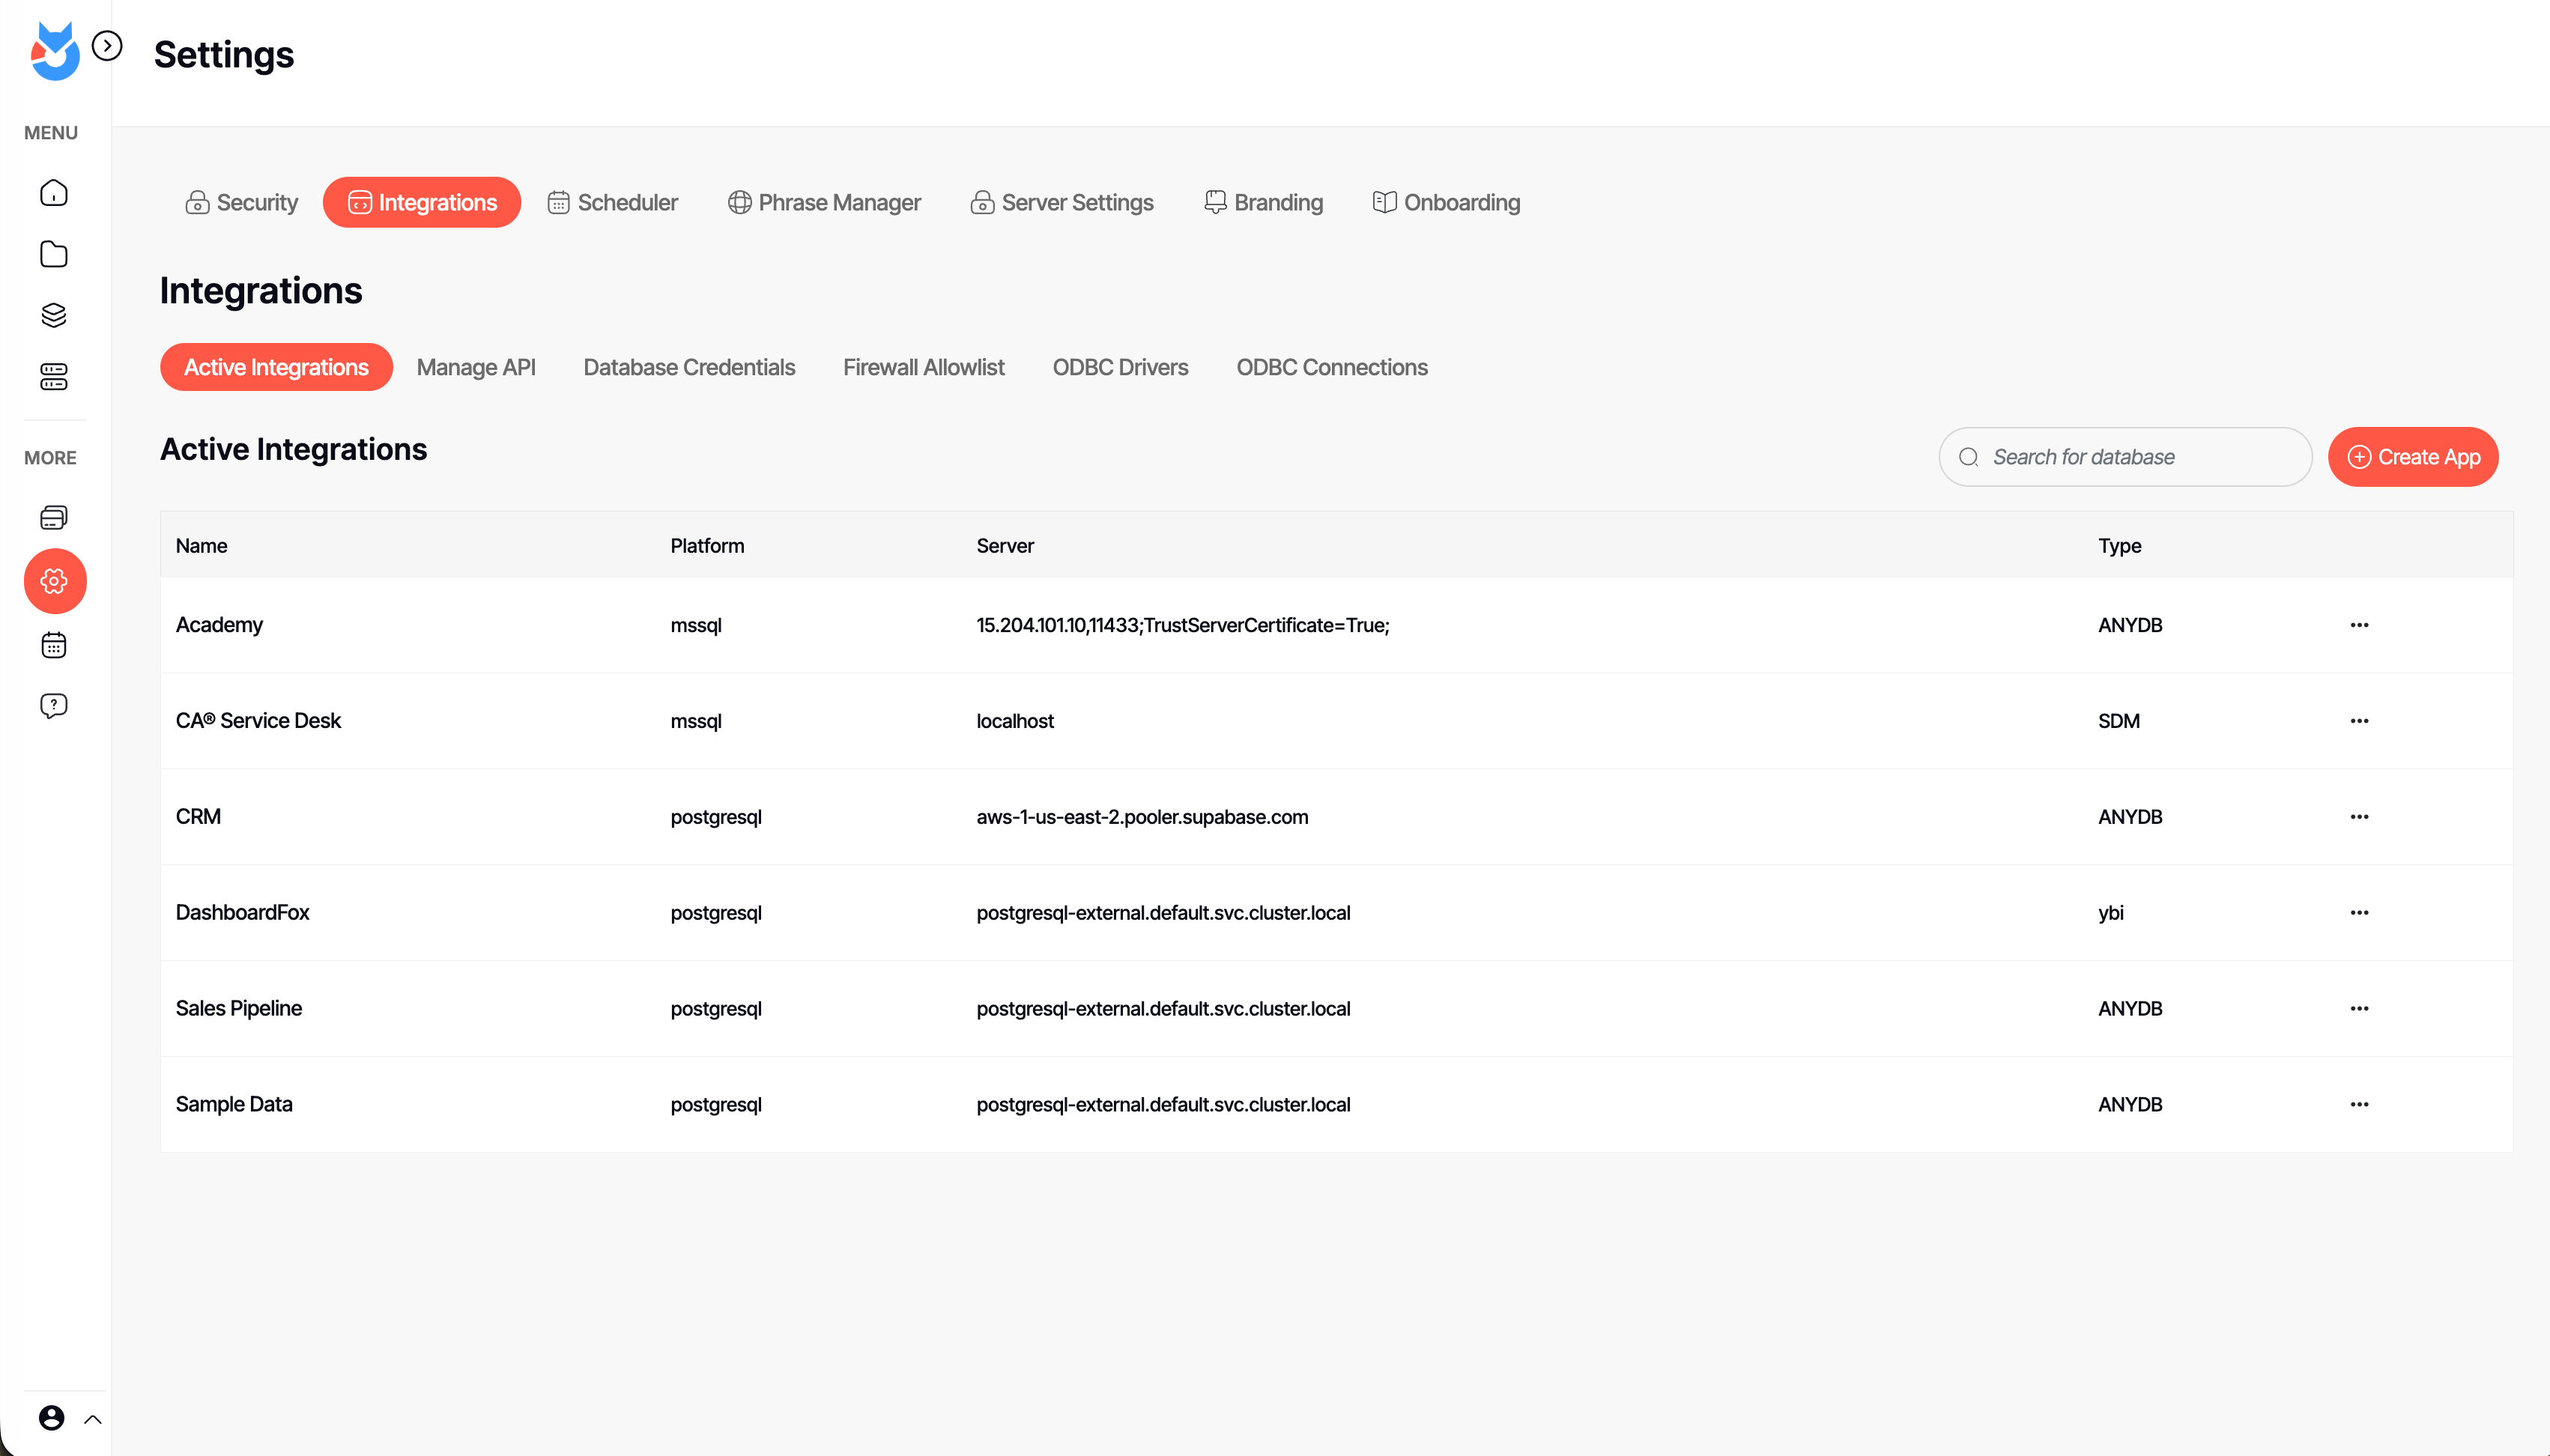
Screenshot of DashboardFox admin settings: manage data-source integrations, ODBC drivers, API access, scheduling, branding, and security in one place. Connect SQL Server, PostgreSQL, and more with no ETL, and white-label the experience for your clients.
Screenshot of a single DashboardFox report shown as a color-coded calendar heatmap, flagging good, watch, and bad days at a glance. Open any report from the library, refresh or schedule it, and deliver it branded to your team or clients.

1 / 6

Screenshot of an interactive DashboardFox sales pipeline dashboard with KPI tiles, a revenue-by-rep chart, and a rep leaderboard. Business users filter by region, industry, or fiscal year and save their own views — self-service analytics with no SQL required.