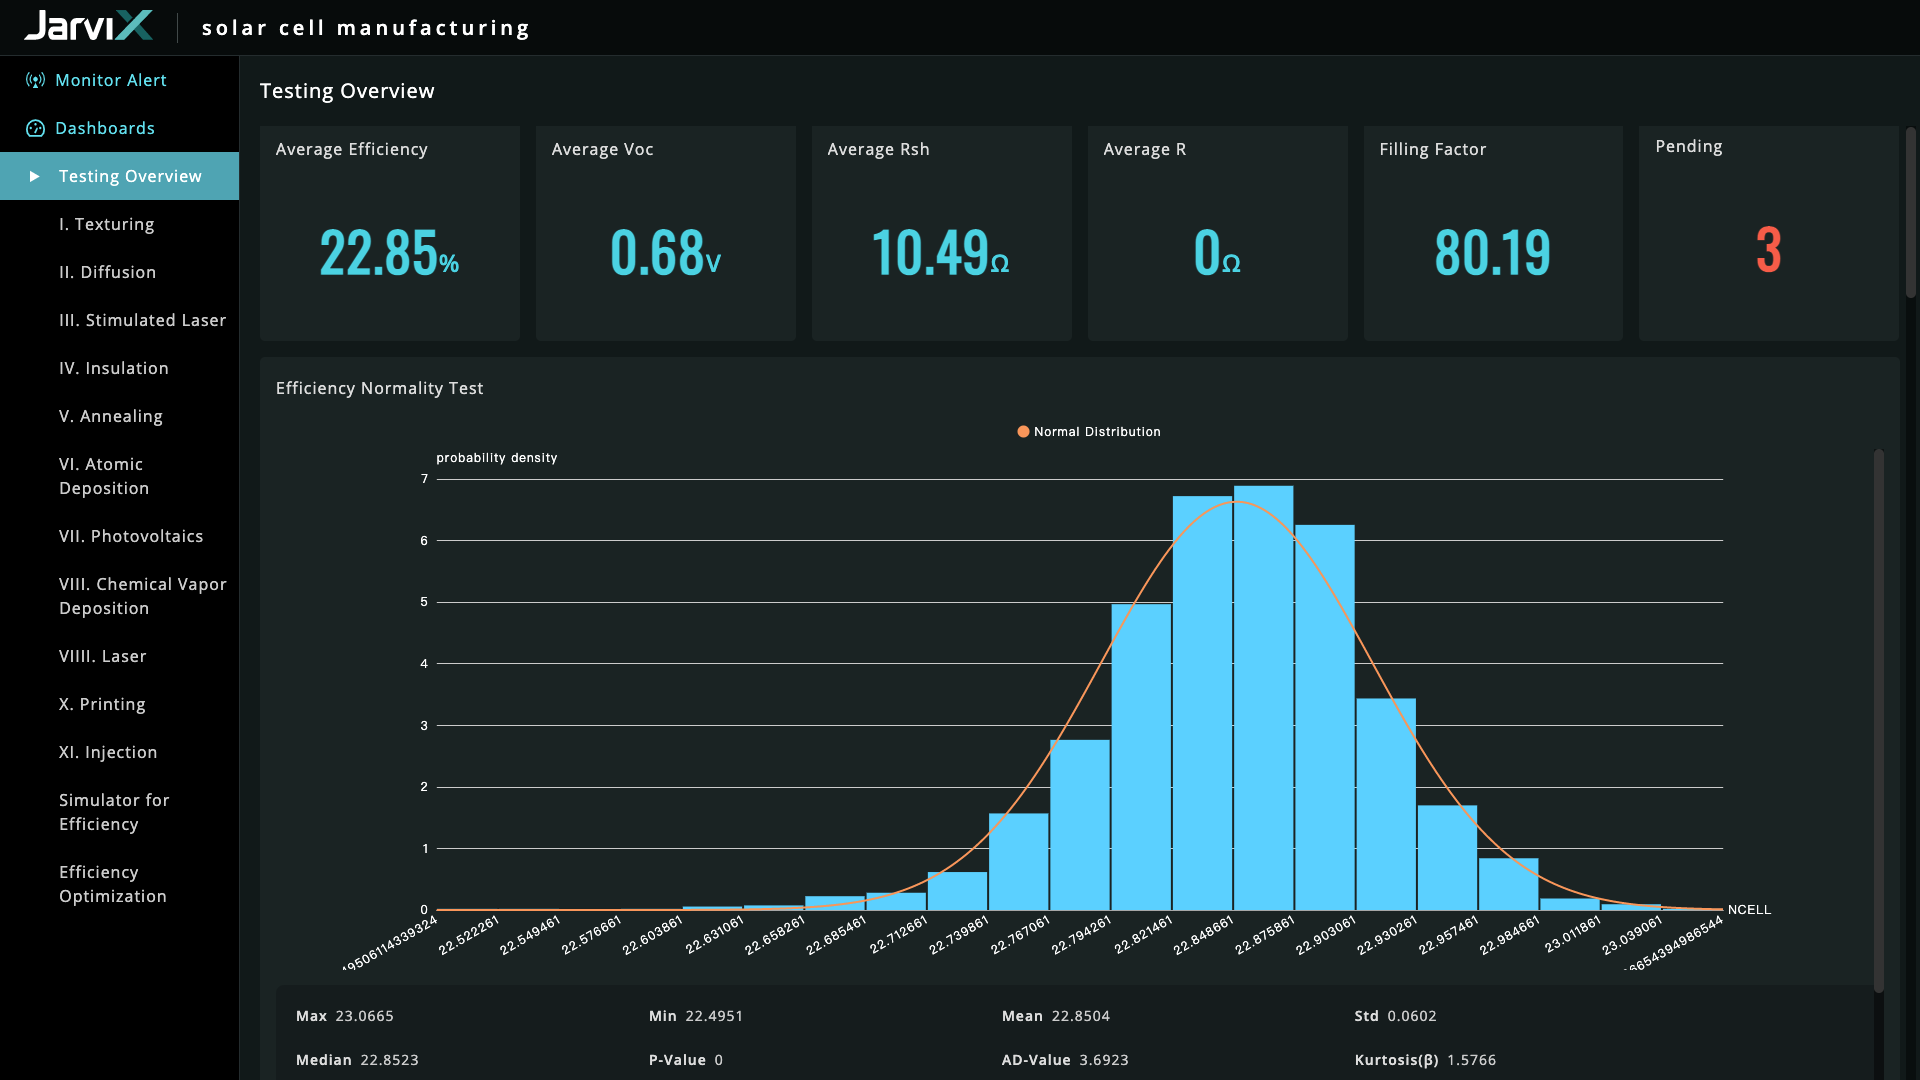
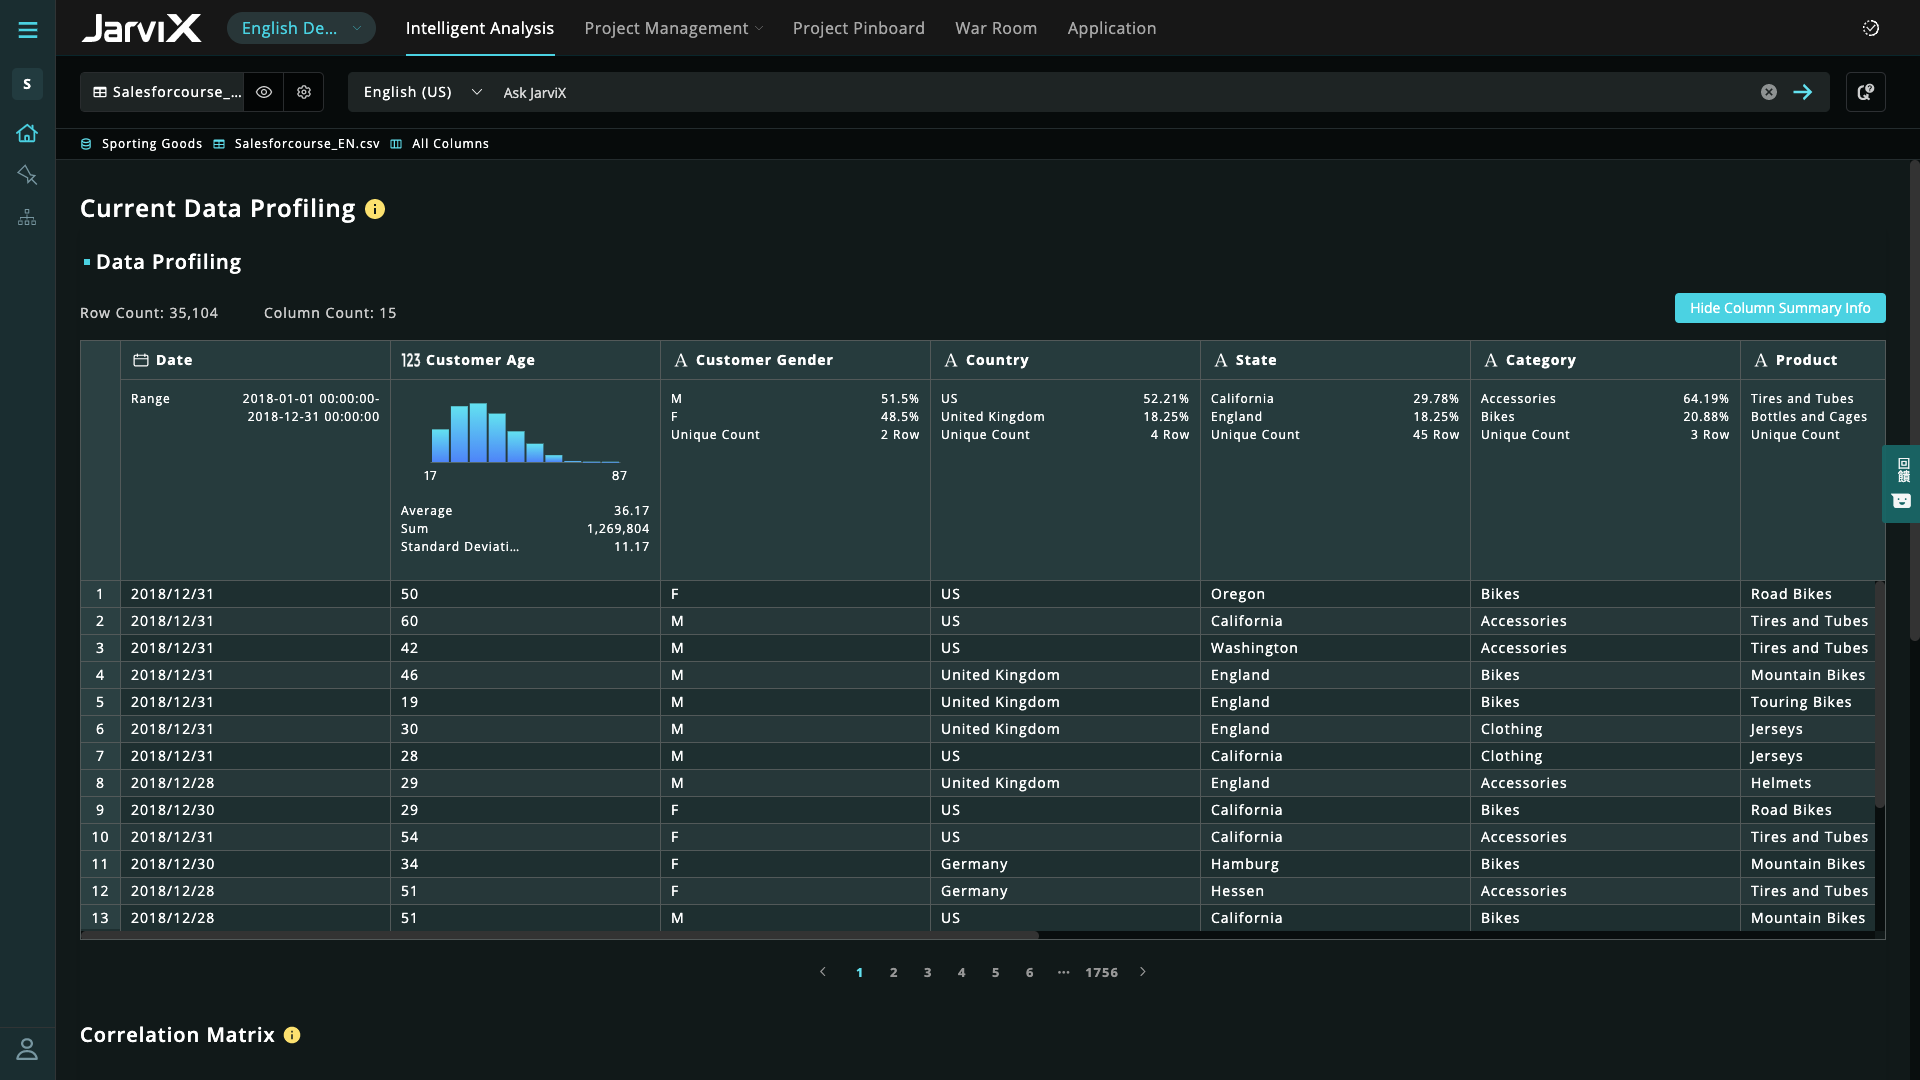
Synergies is a cognitive application service provider that combines business knowledge, artificial intelligence technology, and software development. Their mission is to help businesses through their digital transformation journey, become leaders and innovators in their industries by unlocking the power of data in the hands of business users and decision makers. Their product, JarviX, is an AnalyticOps Platform . JarviX uses NLP…
N/A
Tableau Server
Score 7.6 out of 10
N/A
Tableau Server allows Tableau Desktop users to publish dashboards to a central server to be shared across their organizations. The product is designed to facilitate collaboration across the organization. It can be deployed on a server in the data center, or it can be deployed on a public cloud.
$12
Per User Per Month
Pricing
JarviX
Tableau Server
Editions & Modules
No answers on this topic
Viewer
$12.00
Per User Per Month
Explorer
$35.00
Per User Per Month
Creator
$70.00
Per User Per Month
Offerings
Pricing Offerings
JarviX
Tableau Server
Free Trial
No
Yes
Free/Freemium Version
No
No
Premium Consulting/Integration Services
No
Yes
Entry-level Setup Fee
No setup fee
No setup fee
Additional Details
—
—
More Pricing Information
Community Pulse
JarviX
Tableau Server
Features
JarviX
Tableau Server
BI Standard Reporting
Comparison of BI Standard Reporting features of Product A and Product B
JarviX
7.6
2 Ratings
7% below category average
Tableau Server
8.4
95 Ratings
3% above category average
Pixel Perfect reports
8.21 Ratings
9.129 Ratings
Customizable dashboards
7.32 Ratings
7.094 Ratings
Report Formatting Templates
7.31 Ratings
9.081 Ratings
Ad-hoc Reporting
Comparison of Ad-hoc Reporting features of Product A and Product B
JarviX
7.8
2 Ratings
3% below category average
Tableau Server
7.8
95 Ratings
3% below category average
Drill-down analysis
7.12 Ratings
8.095 Ratings
Formatting capabilities
7.31 Ratings
8.093 Ratings
Integration with R or other statistical packages
9.11 Ratings
8.059 Ratings
Report sharing and collaboration
7.72 Ratings
7.089 Ratings
Report Output and Scheduling
Comparison of Report Output and Scheduling features of Product A and Product B
JarviX
7.8
1 Ratings
5% below category average
Tableau Server
7.2
91 Ratings
13% below category average
Publish to Web
9.11 Ratings
8.085 Ratings
Publish to PDF
7.31 Ratings
7.084 Ratings
Report Versioning
6.41 Ratings
8.070 Ratings
Report Delivery Scheduling
8.21 Ratings
8.077 Ratings
Delivery to Remote Servers
8.21 Ratings
5.19 Ratings
Data Discovery and Visualization
Comparison of Data Discovery and Visualization features of Product A and Product B
JarviX is very good at data integration, creating charts and reports for data visualization. It is really impressive that Jarvix can let our marketing team know the number of members living in a specific area in seconds. In addition, the product manager from Synergies is willing to help us with all problems we encounter. I accidentally changed one of the settings in a data table which threw the existing dashboard into chaos. However, after assistance from the product manager, we were able to successfully bring the data back to normal.
Whole funnel and specific channel performance from upper to lower funnel metrics. The ability to view full channel performance for some time, such as weekly, monthly, or quarterly, has truly been monumental in how my team optimizes specific channels and campaigns. Daily performance tracking is a bit overwhelming, with load times and having to refresh specific live views over time. It can be challenging to do so at times, as extensive dashboards take much longer to load.
It's good at doing what it is designed for: accessing visualizations without having to download and open a workbook in Tableau Desktop. The latter would be a very inefficient method for sharing our metrics, so I am glad that we have Tableau Server to serve this function.
Publishing to Tableau Server is quick and easy. Just a few clicks from Tableau Desktop and a few seconds of publishing through an average speed network, and the new visualizations are live!
Seeing details on who has viewed the visualization and when. This is something particularly useful to me for trying to drive adoption of some new pages, so I really appreciate the granularity provided in Tableau Server
There should be more flexibility in changing the data tables uploaded into JarviX. For example, it should enable users to edit the syntax of the table or change the data format of the columns without affecting the existing dashboard and charts already created using that data table.
Tableau Server has had some issue handling some of our larger data sets. Our extract refreshes fail intermittently with no obvious error that we can fix
Tableau Server has been hard to work with before they launched their new Rest API, which is also a little tricky to work with
It simply is used all the time by more and more people. Migrating to something else would involve lots of work and lots of training. The renewal fee being fair, it simply isn't worth migrating to a different tool for now.
Tableau Server takes training and experience in order to unlock the application's full potential. This is best handled by a qualified data scientist or data analytics manager. Tableau user interface layout, nomenclature, and command structure take time and training to become proficient with. Integration and connectivity require proper IT developer support.
Our instance of Tableau Server was hosted on premises (I believe all instances are) so if there were any outages it was normally due to scheduled maintenance on our end. If the Tableau server ever went down, a quick restart solved most issues
While there are definitely cases where a user can do things that will make a particular worksheet or dashboard run slowly, overall the performance is extremely fast. The user experience of exploratory analysis particularly shines, there's nothing out there with the polish of Tableau.
We have consistently had highly satisfactory results every time we've reached out for help. Our contractor, used for Tableau server maintenance and dashboard development is very technically skilled. When he hits a roadblock on how to do something with Tableau, the support staff have provided timely and useful guidance. He frequently compares it to Cognos and says that while Cognos has capabilities Tableau doesn't, the bottom line value for us is a no-brainer
In our case, they hired a private third party consultant to train our dept. It was extremely boring and felt like it dragged on. Everything I learned was self taught so I was not really paying attention. But I do think that you can easily spend a week on the tool and go over every nook and cranny. We only had the consultant in for a day or two.
The Tableau website is full of videos that you can follow at your own pace. As a very small company with a Tableau install, access to these free resources was incredibly useful to allowing me to implement Tableau to its potential in a reasonable and proportionate manner.
Implementation was over the phone with the vendor, and did not go particularly well. Again, think this was our fault as our integration and IT oversight was poor, and we made errors. Would they have happened had a vendor been onsite? Not sure, probably not, but we probably wouldn't have paid for that either
Tableau and Power BI. Obviously, they are not in the same category. Tableau and Power BI only provide data visualizations plus a little bit of analytics. JarviX not only provides data exploration, so you can find out what the problem is, as well as model management and App builder. If you only look for a dashboard, yes BI is probably enough, but if you constantly feel lacking actionable insights for actual implementations of improvements, JarviX is the choice for you.
Today, if my shop is largely Microsoft-centric, I would be hard pressed to choose a product other than Power BI. Tableau was the visualization leader for years, but Microsoft has caught up with them in many areas, and surpassed them in some. Its ability to source, transform, and model data is superior to Tableau. Tableau still has the lead in some visualizations, but Power BI's rise is evidenced by its ever-increasing position in the leadership section of the Gartner Magic Quadrant.
I think the best part of JarviX is that we can get the analysis results in several minutes. We spent lots of time making reports and managing our data in the past. All in all, it helps us save the time, cost, and labor of managing data.
Tableau does take dedicated FTE to create and analyze the data. It's too complex (and powerful) a product not to have someone dedicated to developing with it.
There are some significant setup for the server product.
Once sever setup is complete, it's largely "fire and forget" until an update is necessary. The server update process is cumbersome.