Synergies is a cognitive application service provider that combines business knowledge, artificial intelligence technology, and software development. Their mission is to help businesses through their digital transformation journey, become leaders and innovators in their industries by unlocking the power of data in the hands of business users and decision makers. Their product, JarviX, is an AnalyticOps Platform . JarviX uses NLP…
N/A
Tableau Cloud
Score 8.0 out of 10
N/A
Tableau Cloud (formerly Tableau Online) is a self-service analytics platform that is fully hosted in the cloud. Tableau Cloud enables users to publish dashboards and invite colleagues to explore hidden opportunities with interactive visualizations and accurate data, from any browser or mobile device.
$15
per month per user
Pricing
JarviX
Tableau Cloud
Editions & Modules
No answers on this topic
Tableau Viewer
$15
per month billed annually per user
Enterprise Viewer
$35
per month billed annually per user
Tableau Explorer
$42
per month billed annually per user
Enterprise Explorer
$70
per month billed annually per user
Tableau Creator
$75
per month billed annually per user
Enterprise Creator
$115
per month billed annually per user
Tableau+
Contact Sales
Offerings
Pricing Offerings
JarviX
Tableau Cloud
Free Trial
No
No
Free/Freemium Version
No
No
Premium Consulting/Integration Services
No
No
Entry-level Setup Fee
No setup fee
No setup fee
Additional Details
—
—
More Pricing Information
Community Pulse
JarviX
Tableau Cloud
Features
JarviX
Tableau Cloud
BI Standard Reporting
Comparison of BI Standard Reporting features of Product A and Product B
JarviX
7.6
2 Ratings
7% below category average
Tableau Cloud
7.6
74 Ratings
7% below category average
Pixel Perfect reports
8.21 Ratings
7.656 Ratings
Customizable dashboards
7.32 Ratings
8.774 Ratings
Report Formatting Templates
7.31 Ratings
6.563 Ratings
Ad-hoc Reporting
Comparison of Ad-hoc Reporting features of Product A and Product B
JarviX
7.8
2 Ratings
3% below category average
Tableau Cloud
7.6
74 Ratings
5% below category average
Drill-down analysis
7.12 Ratings
8.574 Ratings
Formatting capabilities
7.31 Ratings
7.371 Ratings
Integration with R or other statistical packages
9.11 Ratings
6.147 Ratings
Report sharing and collaboration
7.72 Ratings
8.672 Ratings
Report Output and Scheduling
Comparison of Report Output and Scheduling features of Product A and Product B
JarviX
7.8
1 Ratings
5% below category average
Tableau Cloud
7.8
72 Ratings
5% below category average
Publish to Web
9.11 Ratings
8.668 Ratings
Publish to PDF
7.31 Ratings
7.567 Ratings
Report Versioning
6.41 Ratings
7.655 Ratings
Report Delivery Scheduling
8.21 Ratings
8.559 Ratings
Delivery to Remote Servers
8.21 Ratings
6.638 Ratings
Data Discovery and Visualization
Comparison of Data Discovery and Visualization features of Product A and Product B
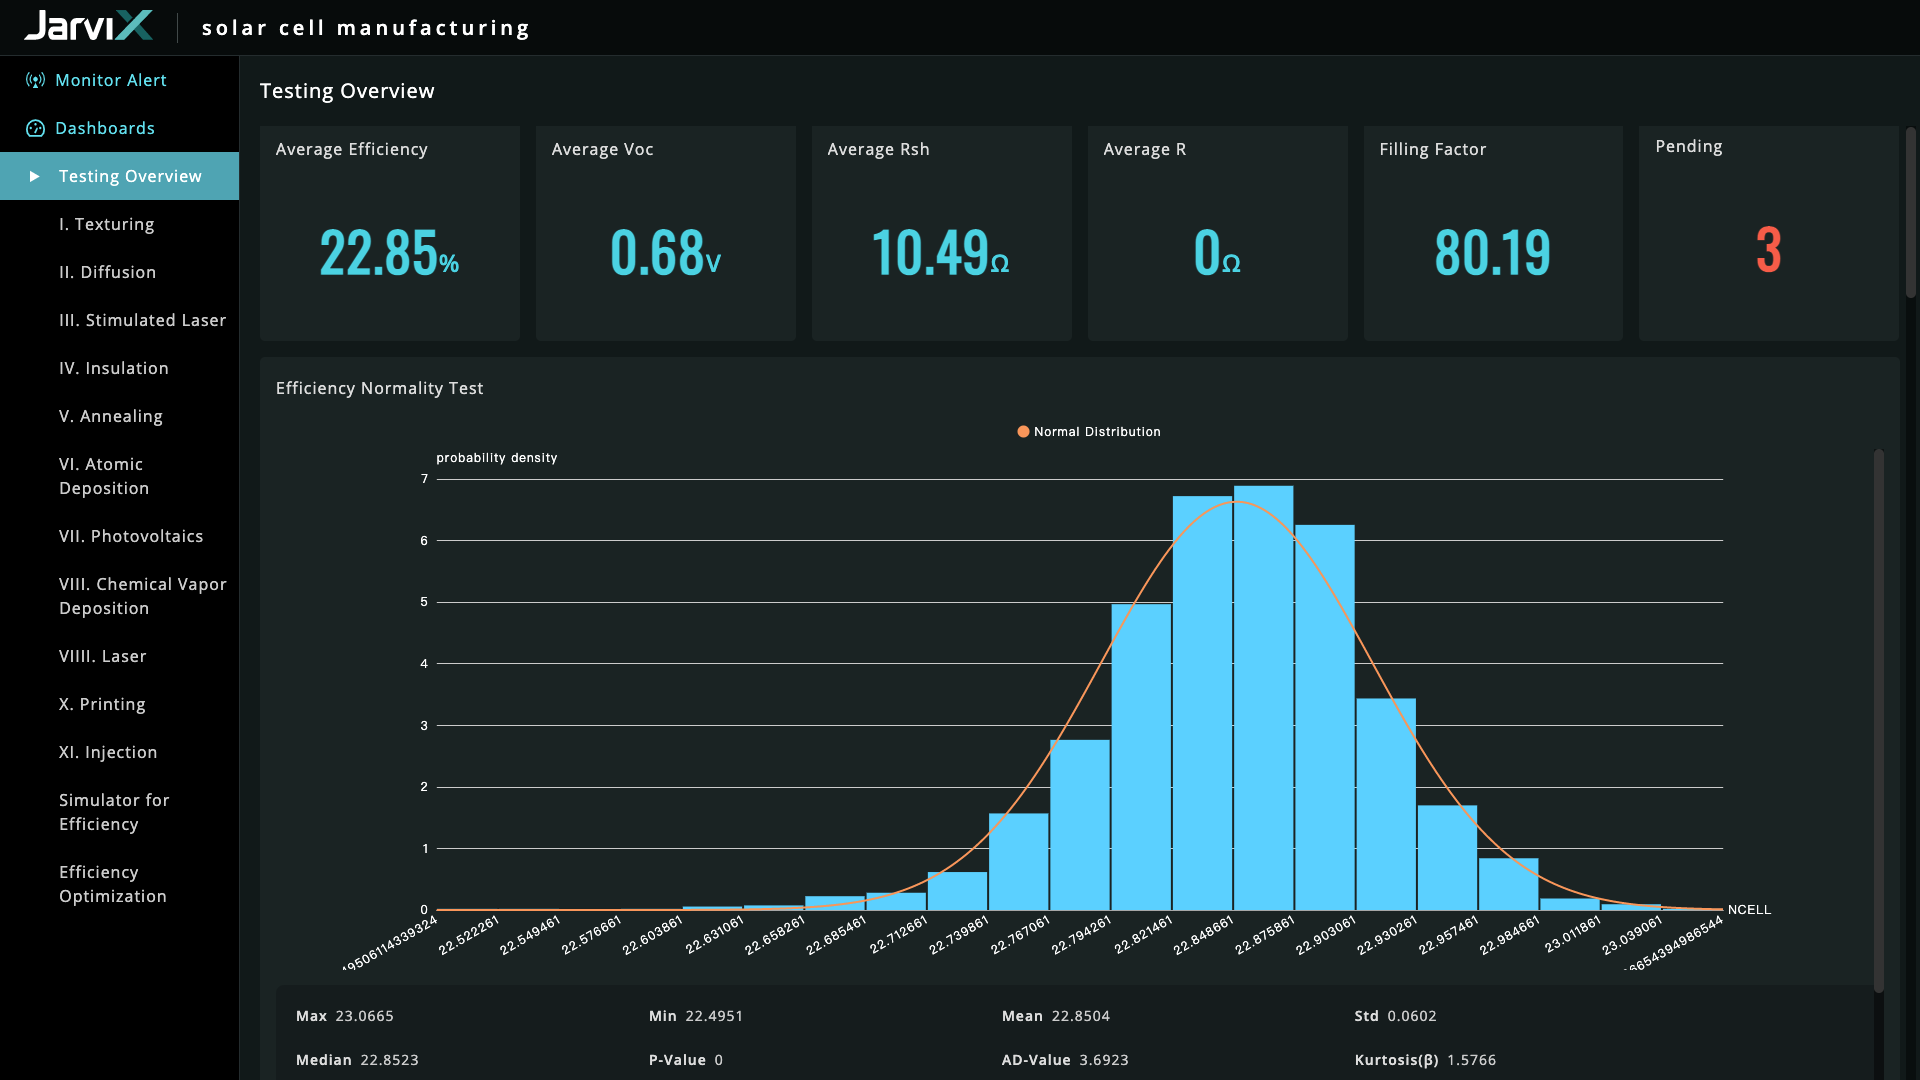
JarviX is very good at data integration, creating charts and reports for data visualization. It is really impressive that Jarvix can let our marketing team know the number of members living in a specific area in seconds. In addition, the product manager from Synergies is willing to help us with all problems we encounter. I accidentally changed one of the settings in a data table which threw the existing dashboard into chaos. However, after assistance from the product manager, we were able to successfully bring the data back to normal.
If you're using Tableau as the primary BI tool, then Tableau Cloud is well suited to publish and share the results with a wide(r) audience. It is well suited for various degrees of self-service proficiency, from pure consumers of analytical work to more advanced users who can use web editing for smaller or larger adjustments, and even for desktop power users who will publish their work to Tableau Cloud. It has many good ways to organize the content and make it easily accessible via search, favorites, folders, collections ("playlists for your data"), or history ("recents"). It might not be ideally suited if there are many on-prem sources to be used (even though there are options to connect them) or if you have very special requirements regarding custom server setup, which is limited in a shared cloud environment like Tableau Cloud.
Tableau Online is completely cloud based and that's why the reports and dashboards are accessible even on the go. One doesn't always need to access the office laptop to access the reports.
The visualizations are interactive and one can quickly change the level at which they want to view the information. For example, one person might be more interested in looking at the country level performances rather than client level. This is intuitive and one doesn't need to create multiple reports for the same.
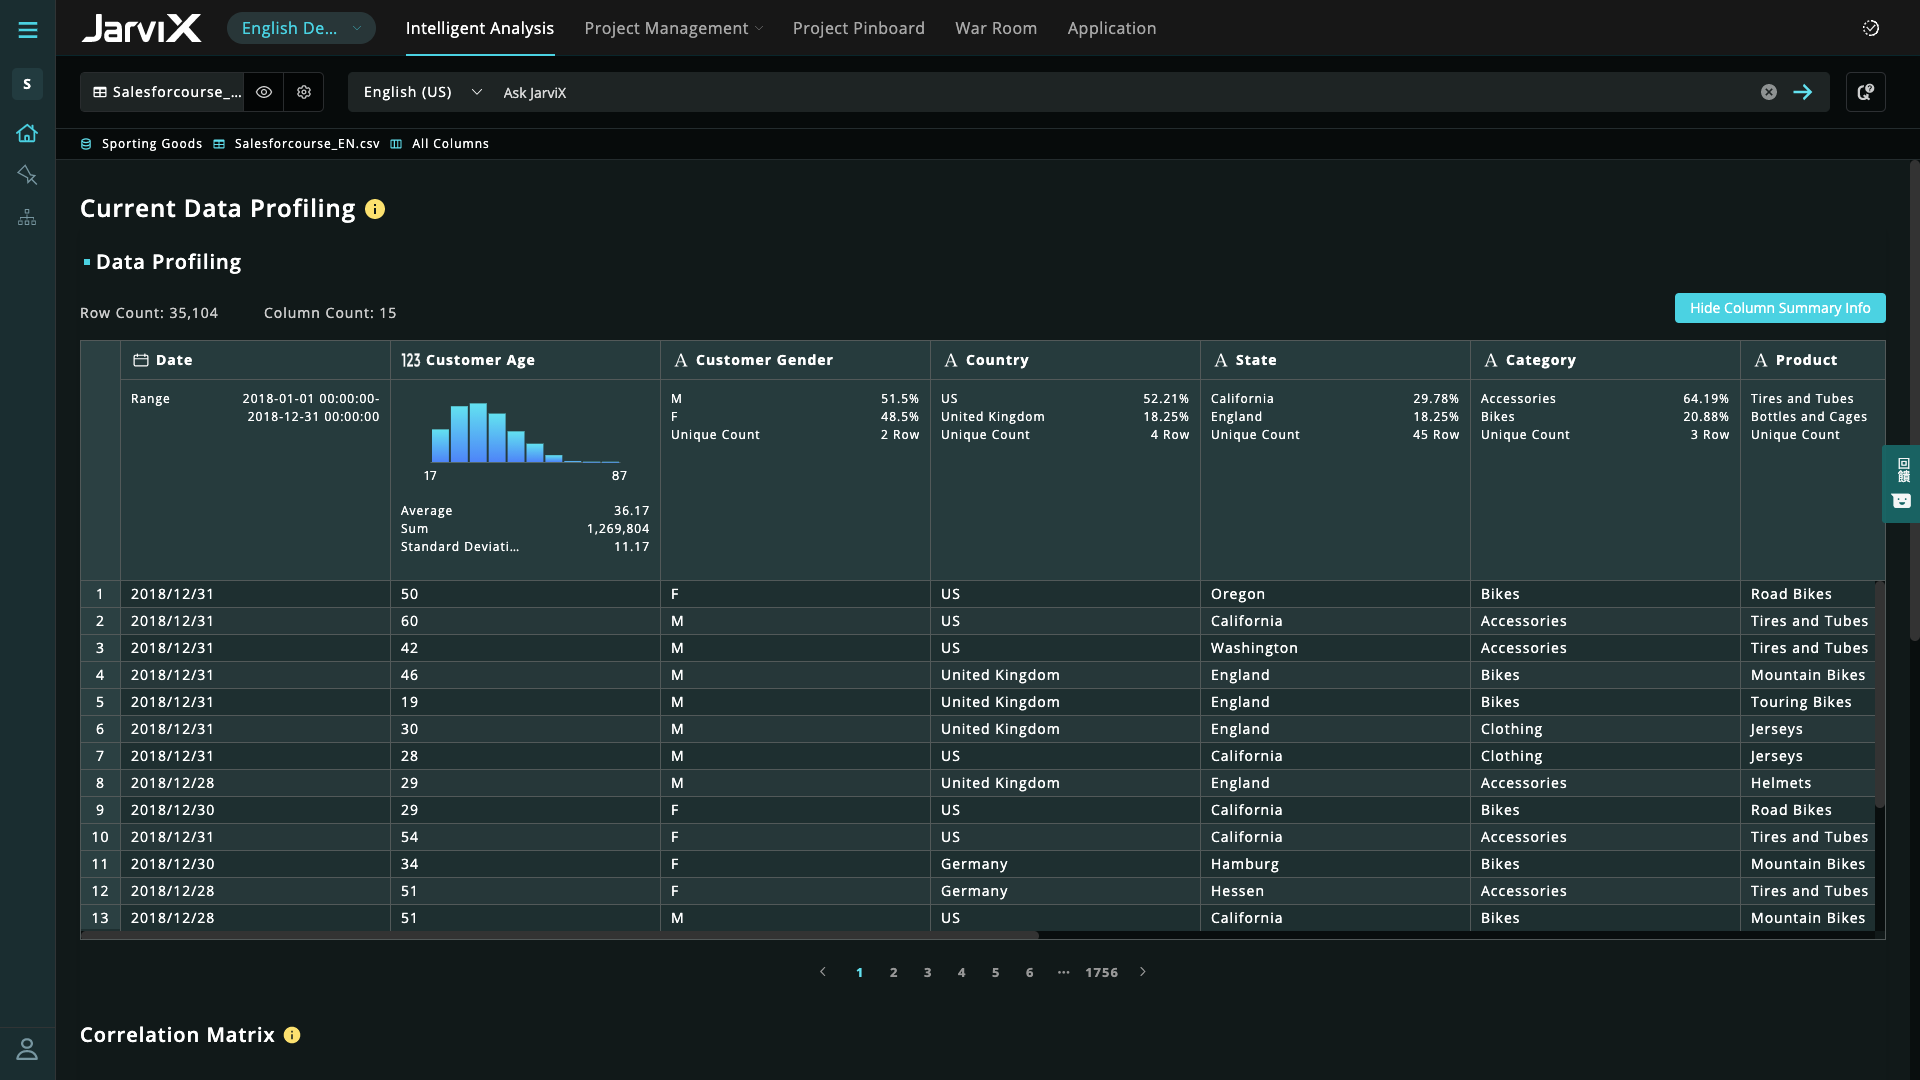
The feature to ask questions in plain vanilla English language is great and helpful. For quick adhoc fact checks one can simply type what they are looking for and the Natural Language Programming algorithms under the hood parse the query, interpret it and then fetch the results accordingly in a visual form.
There should be more flexibility in changing the data tables uploaded into JarviX. For example, it should enable users to edit the syntax of the table or change the data format of the columns without affecting the existing dashboard and charts already created using that data table.
Based on comments from our clients, I awarded it this grade. Non-technical customers frequently compliment us on the ease with which they can utilize Tableau Online. Usability is rarely a source of contention amongst our customers. Few complaints have come from me as a user of our internal products.
I have not had any issues that require customer support from Tableau at this time, which speaks well to Tableau. I have taken an online course with Tableau and it was very professional and well done, so based on that I would assume a similar level of quality for their customer service.
Tableau and Power BI. Obviously, they are not in the same category. Tableau and Power BI only provide data visualizations plus a little bit of analytics. JarviX not only provides data exploration, so you can find out what the problem is, as well as model management and App builder. If you only look for a dashboard, yes BI is probably enough, but if you constantly feel lacking actionable insights for actual implementations of improvements, JarviX is the choice for you.
In determining whether to go with Tableau Online versus Alteryx, two important factors stood out in determining our go-to solution. First, while Alteryx is an impressive tool for data cleansing, it did not stack up in terms of data visualization capabilities. Tableau, on the other hand, provided us everything we needed in terms of visualizing our data and analytics. The second factor is cost. Well neither solution would be considered cheap, Tableau was the more cost effective solution for our needs.
I think the best part of JarviX is that we can get the analysis results in several minutes. We spent lots of time making reports and managing our data in the past. All in all, it helps us save the time, cost, and labor of managing data.