Chartio (discontinued) vs. Jet Reports
Chartio (discontinued) vs. Jet Reports
| Product | Rating | Most Used By | Product Summary | Starting Price |
|---|---|---|---|---|
 Chartio (discontinued) | N/A | Chartio is a visualization tool designed to enable anyone to explore, transform and visualize data on the fly through a drag-and-drop interface. Chartio was acquired by Atlassian in February 2021 so that it's capabilities could be integrated into the Atlassian product portfolio's capabilities. Chartio is no longer available to new customers, standalone. Existing customers must migrate to alternatives by March 2022, when the service will be retired. | $40 per user/per month | |
 Jet Reports | N/A | Jet Reports is a business intelligence software now offered by insightsoftware, inc since the company's 2019 acquisition of Jet Global Data Technologies. | N/A |
| Chartio (discontinued) | Jet Reports | |||||||||||||||
|---|---|---|---|---|---|---|---|---|---|---|---|---|---|---|---|---|
| Editions & Modules |
| No answers on this topic | ||||||||||||||
| Offerings |
| |||||||||||||||
| Entry-level Setup Fee | No setup fee | No setup fee | ||||||||||||||
| Additional Details | — | — | ||||||||||||||
| More Pricing Information | ||||||||||||||||
| Chartio (discontinued) | Jet Reports |
|---|
| Chartio (discontinued) | Jet Reports | ||||||||||||||||||
|---|---|---|---|---|---|---|---|---|---|---|---|---|---|---|---|---|---|---|---|
| BI Standard Reporting |
| ||||||||||||||||||
| Ad-hoc Reporting |
| ||||||||||||||||||
| Report Output and Scheduling |
| ||||||||||||||||||
| Data Discovery and Visualization |
|
| Chartio (discontinued) | Jet Reports | |
|---|---|---|
| Small Businesses |  Supermetrics Score 9.8 out of 10 | Supermetrics Score 9.8 out of 10 |
| Medium-sized Companies | Supermetrics Score 9.8 out of 10 | Supermetrics Score 9.8 out of 10 |
| Enterprises |  IBM Analytics Engine Score 7.1 out of 10 | IBM Analytics Engine Score 7.1 out of 10 |
| All Alternatives | View all alternatives | View all alternatives |
| Chartio (discontinued) | Jet Reports | |
|---|---|---|
| Likelihood to Recommend | 8.0 (30 ratings) | 7.0 (5 ratings) |
| Likelihood to Renew | 8.0 (24 ratings) | - (0 ratings) |
| Usability | 7.6 (6 ratings) | 6.0 (1 ratings) |
| Availability | 8.6 (2 ratings) | - (0 ratings) |
| Performance | 7.3 (1 ratings) | - (0 ratings) |
| Support Rating | - (0 ratings) | 5.0 (1 ratings) |
| Online Training | 8.2 (1 ratings) | - (0 ratings) |
| Implementation Rating | 7.3 (1 ratings) | - (0 ratings) |
| Product Scalability | 6.8 (2 ratings) | - (0 ratings) |
| Chartio (discontinued) | Jet Reports | |
|---|---|---|
| Likelihood to Recommend |  Atlassian
 Kyle Epps Sr. Manager, Business Operations and Technology | Insightsoftware, Inc
 Grant Nelson, CPA Accounting Manager |
| Pros | Atlassian
| Insightsoftware, Inc
 Ojas Korde Digital Paid Media Strategist |
| Cons | Atlassian
| Insightsoftware, Inc
|
| Likelihood to Renew | Atlassian
 Devin Knight User Researcher | Insightsoftware, Inc No answers on this topic |
| Usability | Atlassian
| Insightsoftware, Inc
Ojas Korde Digital Paid Media Strategist |
| Support Rating | Atlassian No answers on this topic | Insightsoftware, Inc
Ojas Korde Digital Paid Media Strategist |
| Online Training | Atlassian
| Insightsoftware, Inc No answers on this topic |
| Alternatives Considered | Atlassian
| Insightsoftware, Inc
 Matt Scamardo, CSM Consulting Solutions Analyst |
| Scalability | Atlassian
 Asa Pogrelis Director of Sales and Marketing | Insightsoftware, Inc No answers on this topic |
| Return on Investment | Atlassian No answers on this topic | Insightsoftware, Inc
Ojas Korde Digital Paid Media Strategist |
| ScreenShots | Chartio (discontinued) Screenshots      | Jet Reports Screenshots 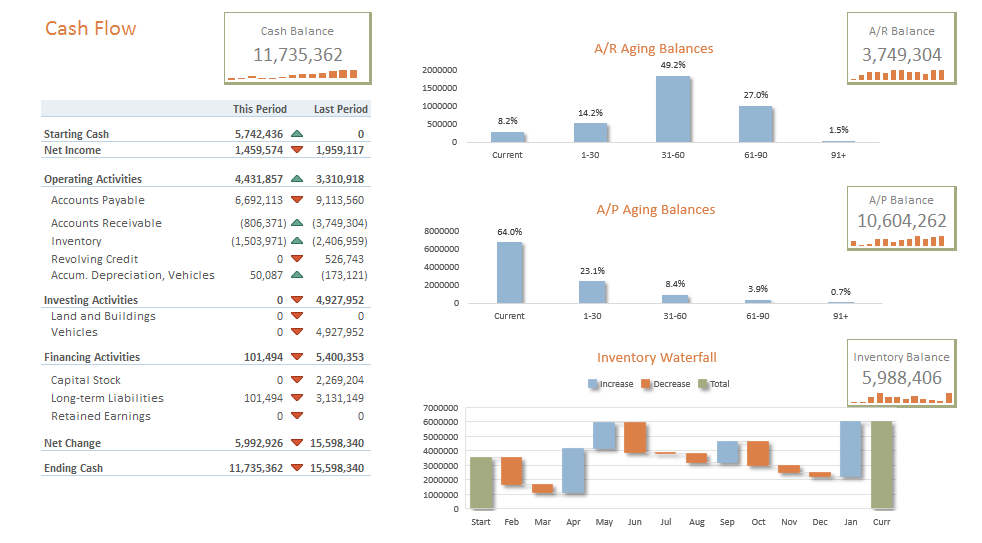     |