Cisco Nexus Dashboard simplifies data-center networks with automation and analytics. The data-center network helps organizations to meet business demands, and provision reliable data-center networking services as fast as possible, when and where organizations need it. As network infrastructure management is becoming more complex, diverse, and distributed, with multiple configuration points, monitoring tools, and vast amounts of data being generated every second. Cisco Nexus Dashboard is…
N/A
SolarWinds NetFlow Traffic Analyzer (NTA)
Score 9.4 out of 10
N/A
SolarWinds Netflow Traffic Analyzer is a network monitoring tool within the broader SolarWinds ecosystem. It includes core traffic monitoring features, as well as customizable traffic reports and alerts.
I have tried using SolarWinds specifically the previous Network configuration manager the log analyzer. When I compare them with Cisco Nexus Dashboard snapshots, delta analysis, and connectivity analysis, we can say that Cisco Nexus Dashboard raises the bar way higher. It gives …
We used Cisco Nexus Dashboard specifically for automating the creation of networks in our private cloud environment using a VXLAN EVPN multisite environment. It integrates into Infoblox well. It's also very suited in network troubleshooting for past and present issues. Where I don't see it being used much is in the campus but it's nice to know we have the ability to add catalyst if needed.
We use and depend on it for status state of our network gear, switches and routers. It does an excellent job of getting you the details you need to confirm all devices and products are working at the level needed. At times, it does tend to flag network switch ports and/or switches themselves as exceeding their rated capacity when frequently it was a quick blip of high traffic due to downloads, or uploads causing the max'ing of the device. Again, you can adjust the settings but then you adjust it too high and miss real activity. It can become nuisance alerting when you tend to then ignore
The level of customization possible with Network Bandwidth Analyzer is very valuable. Rather than being stuck with a "one-size-fits-all" presentation, an administrator can easily create customized views, reports, and alerts so that users can have a more tailored view of the data provided by Network Bandwidth Analyzer. This has the effect of making the tool more attractive to the end user.
The NetFlow Traffic Analyzer piece of Network Bandwidth Analyzer provides the details on bandwidth usage on the network. More than knowing how much bandwidth is being used, one is provided with detailed information on how that bandwidth is being used. This provides invaluable information for capacity planning and even certain forensic tasks faced by the network engineer.
The ability to produce network maps provides an easy way to create an attractive and functional NOC/SOC view of the entire network. Both technician and the occasional passerby can quickly determine if there are issues to be addressed. The ability to customize a map with background images and custom icons and stencils can make these maps really pop.
With the latest version release of Cisco Nexus Dashboard to version 3.0.1 I can say that most of the features have already improved but one of the wishlists that I want for ND is the possibility of extracting lists of Anomaly.
Include older versions of Firmware in the list of choices when doing the firmware upgrade analysis, currently only the recommended is in the list of choices.
If possible, include all the prechecks in the Firmware pre-upgrade analysis same in the script provided by Cisco.
The ability to intuitively and quickly serve up specified information up to a dashboard for general “public” consumption, that cycles through several pages of information.
The ability to intuitively set up alerting on bandwidth levels, instead of having to dig through all types of alerts available to find the one needed.
Provide a pricing model based on different support levels: if I want only available update installations, don’t make me pay the same amount as those wanting full support.
We observe significant product development with each release, along with substantial expansion of functionality. The program code has been consolidated into a single image, which simplifies installation and routine system update operations. Additionally, it is possible to install it outside the production network, which further enhances the solution’s availability.Additionally, the new graphical interface is very simplified and user-friendly.
For the end user, it is relatively easy to use. However, some training and practice is a must because the NSO is not as straightforward as the traditional router CLI. For the administrator, Cisco Network Service Orchestrator (NSO) is just like another program running on the Linux system--there is no big difference.
As far as rating for usability is concerned I would give 10/10 as NTA is very easy to use. All you need to do is install that module and ask network Team to configure the Netflow towards Server IP. [The] rest is pre-configured and reports are pre-built. Moment you receive the flows from Network all you will have is information about traffic.
Great and effective automation functionalities and the tools on network security management are the best and easy data reports building. Cisco Nexus Dashboard Fabric Controller feature for the network monitoring and easy management of various services and even offers the best analytics and also powerful integration tools for easy data migration.
here was never a need to contact support, as the system includes several commands that allow for self-healing. Even if, after the upgrade process, one of the processes was not running, I was able to quickly find the appropriate sequence of commands that definitively resolved the issue. The entire architecture was designed in such a way as to be resilient to the failure of one node in a three-server setup.
I know we could probably pay for it, but it would be nice if we could get to a tier 2 technician faster. Spending a couple of hours on the phone with the level 1 technician, when we have already tried the troubleshooting they are walking us through, is just a waste of time.
The training offered by SolarWinds is some of the best out there. They have several different videos that go into great detail from initial setup to advanced configurations. In addition to the view at your own pace video, they also have live training for customers that focus on a single product and you can ask questions with the folks who develop the software. I have had good success with their live sessions and getting questions answered.
Honestly, the product implementation took 1–2 days to comprehensively manage the client’s entire infrastructure. The delivered on-premise solution, provided as physical servers, quickly builds the required environment in which individual data centers are rapidly added. The data collection process takes some time but also depends on the number of devices in the network.
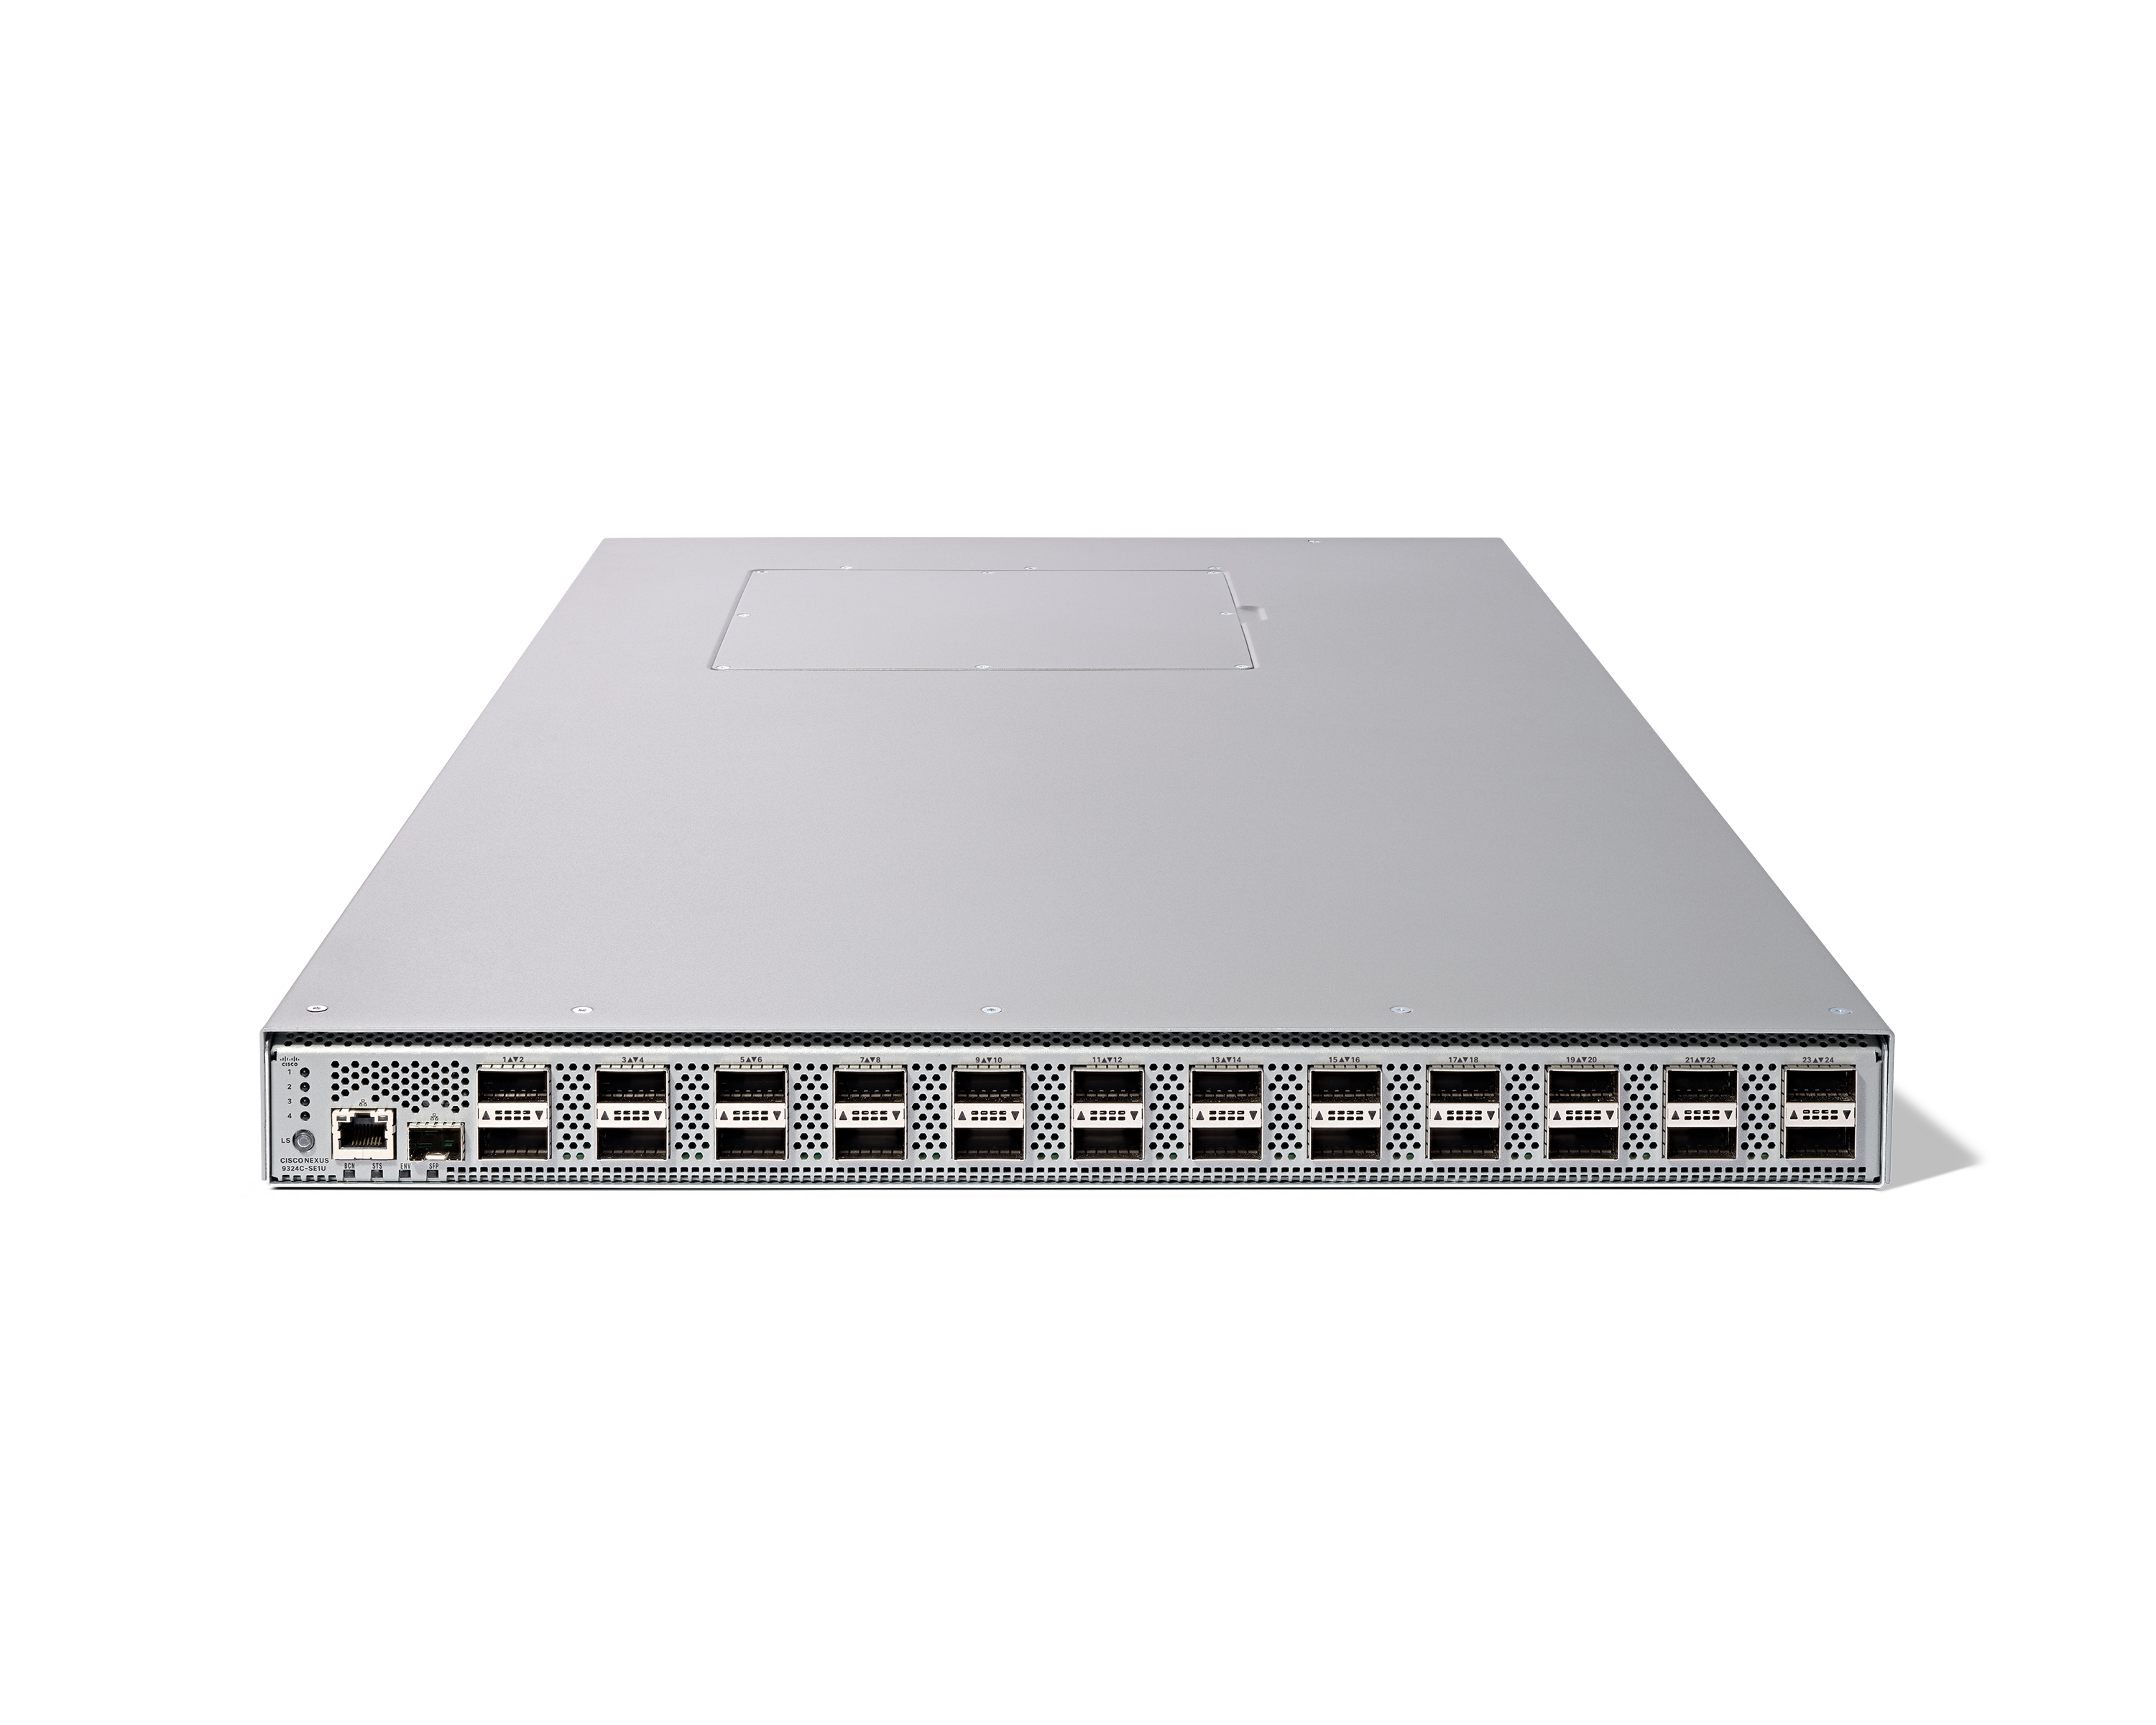
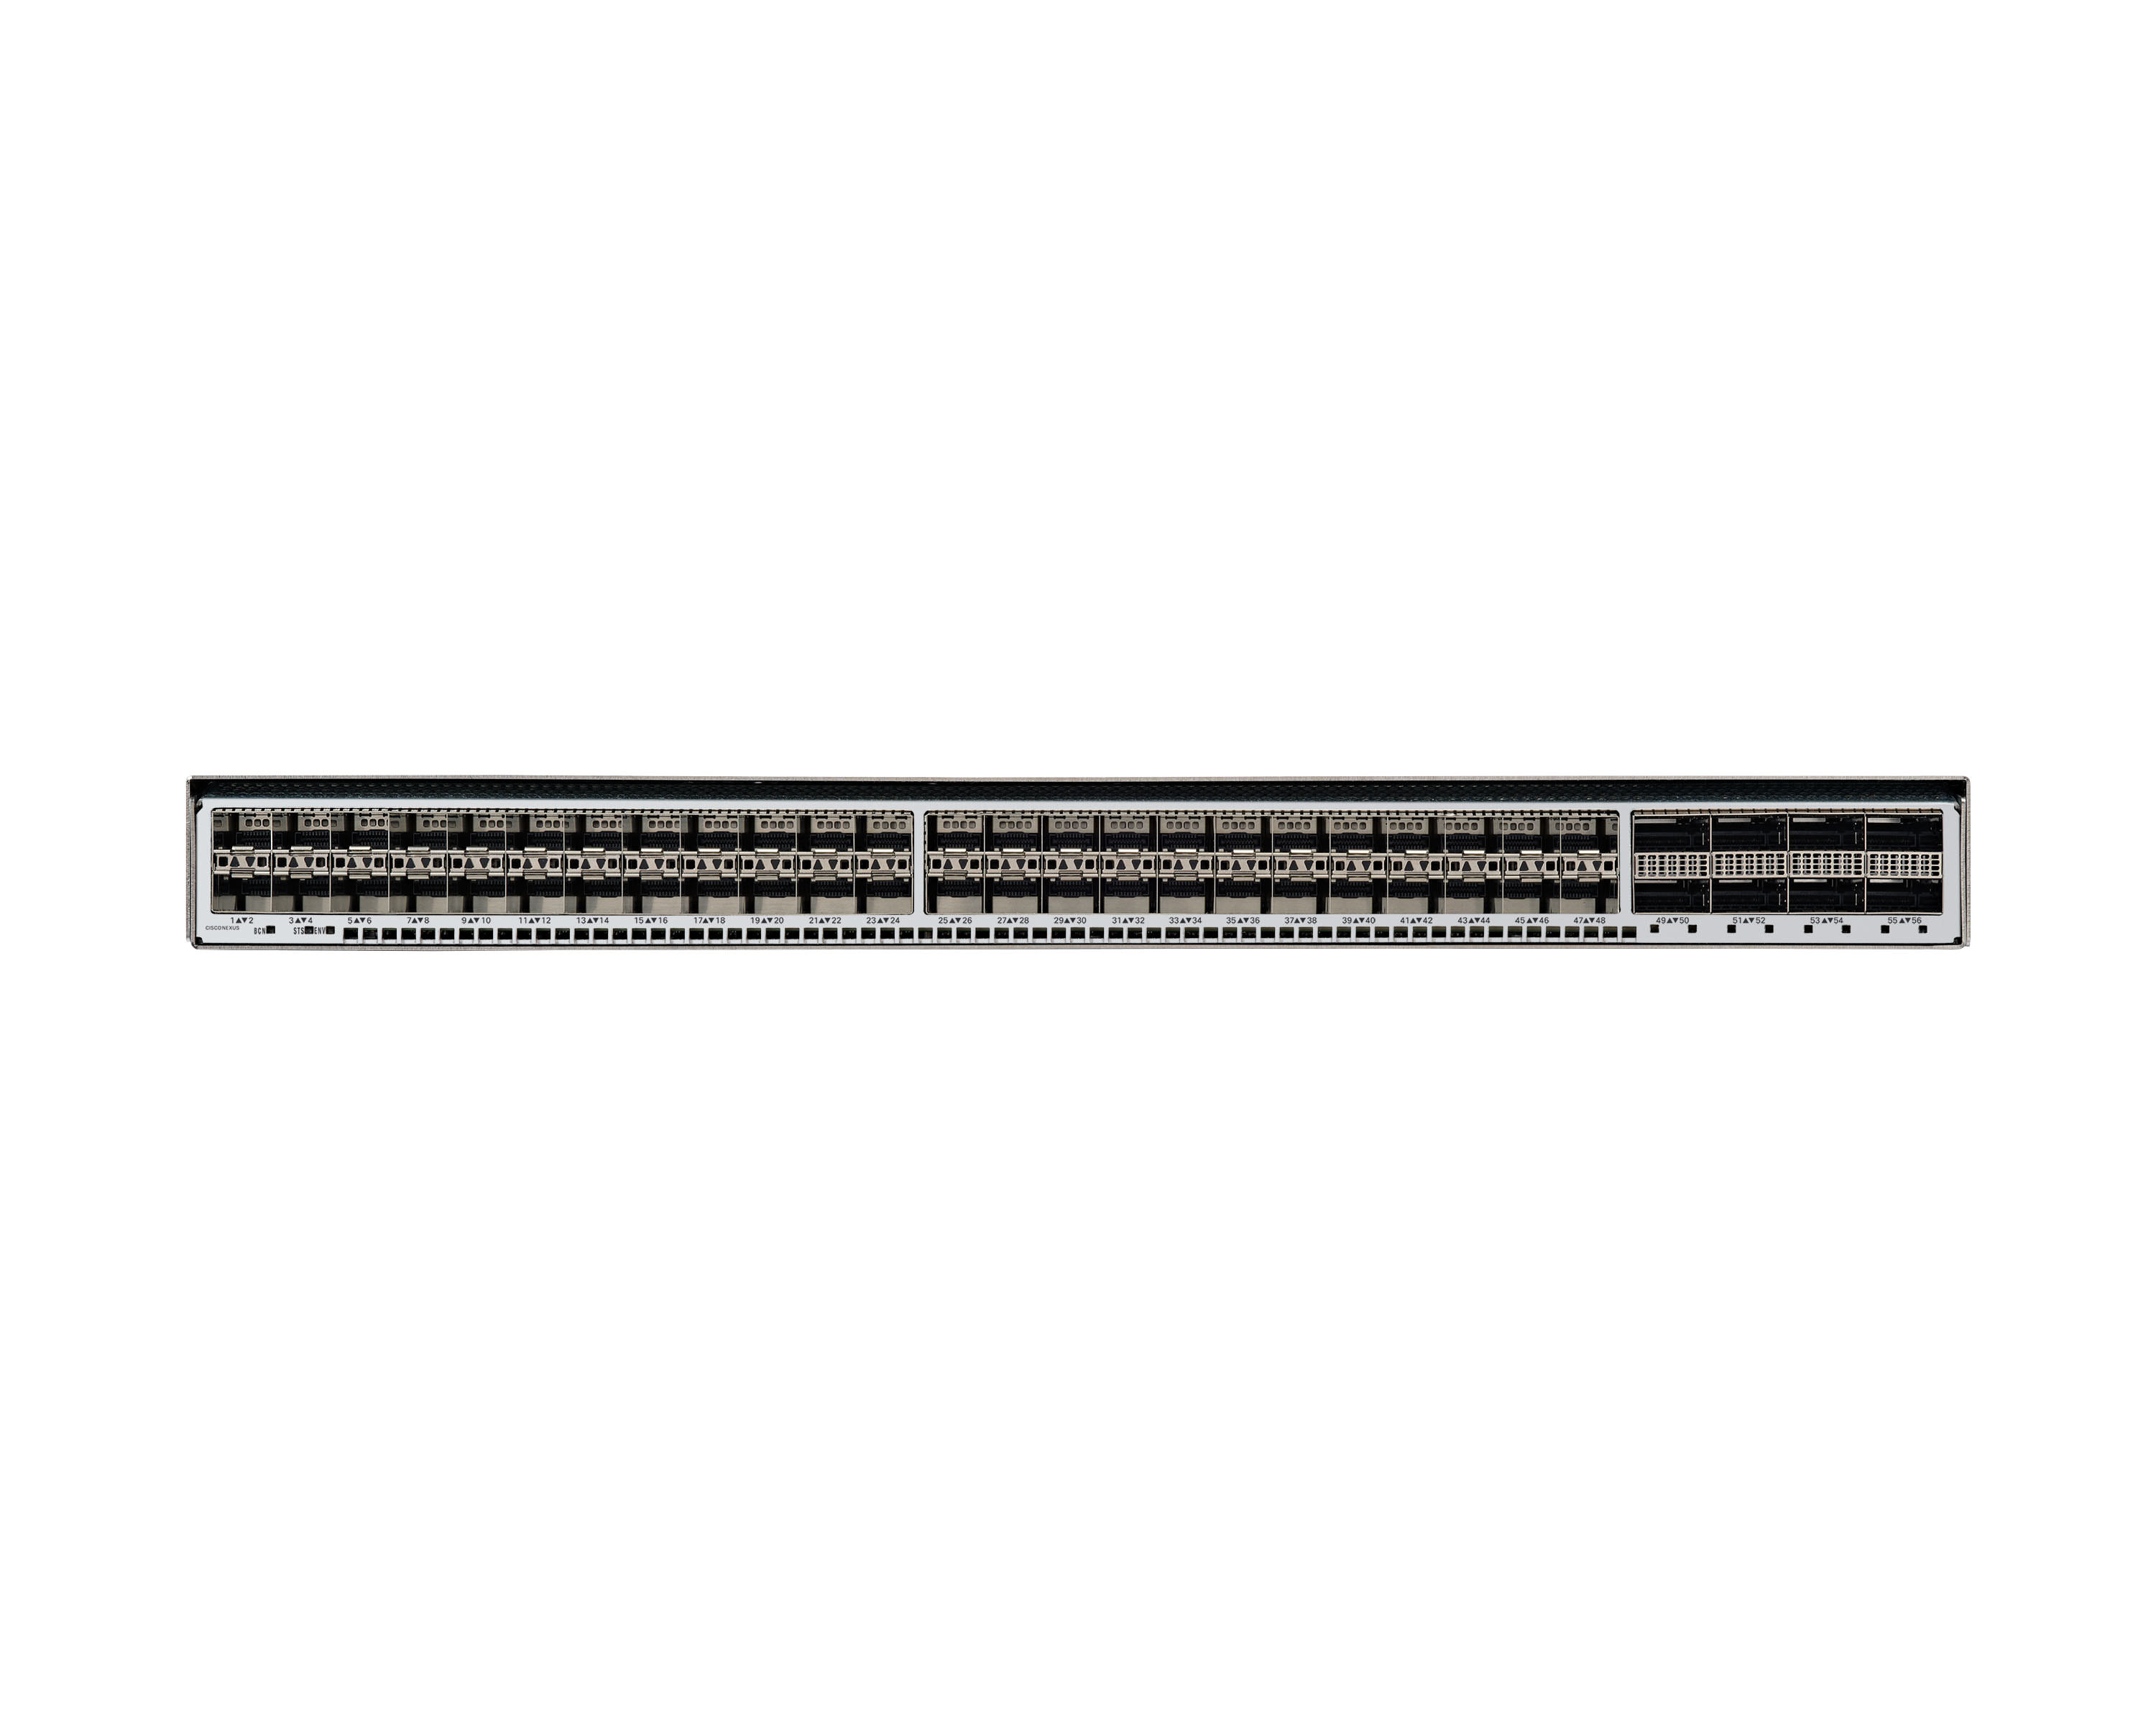
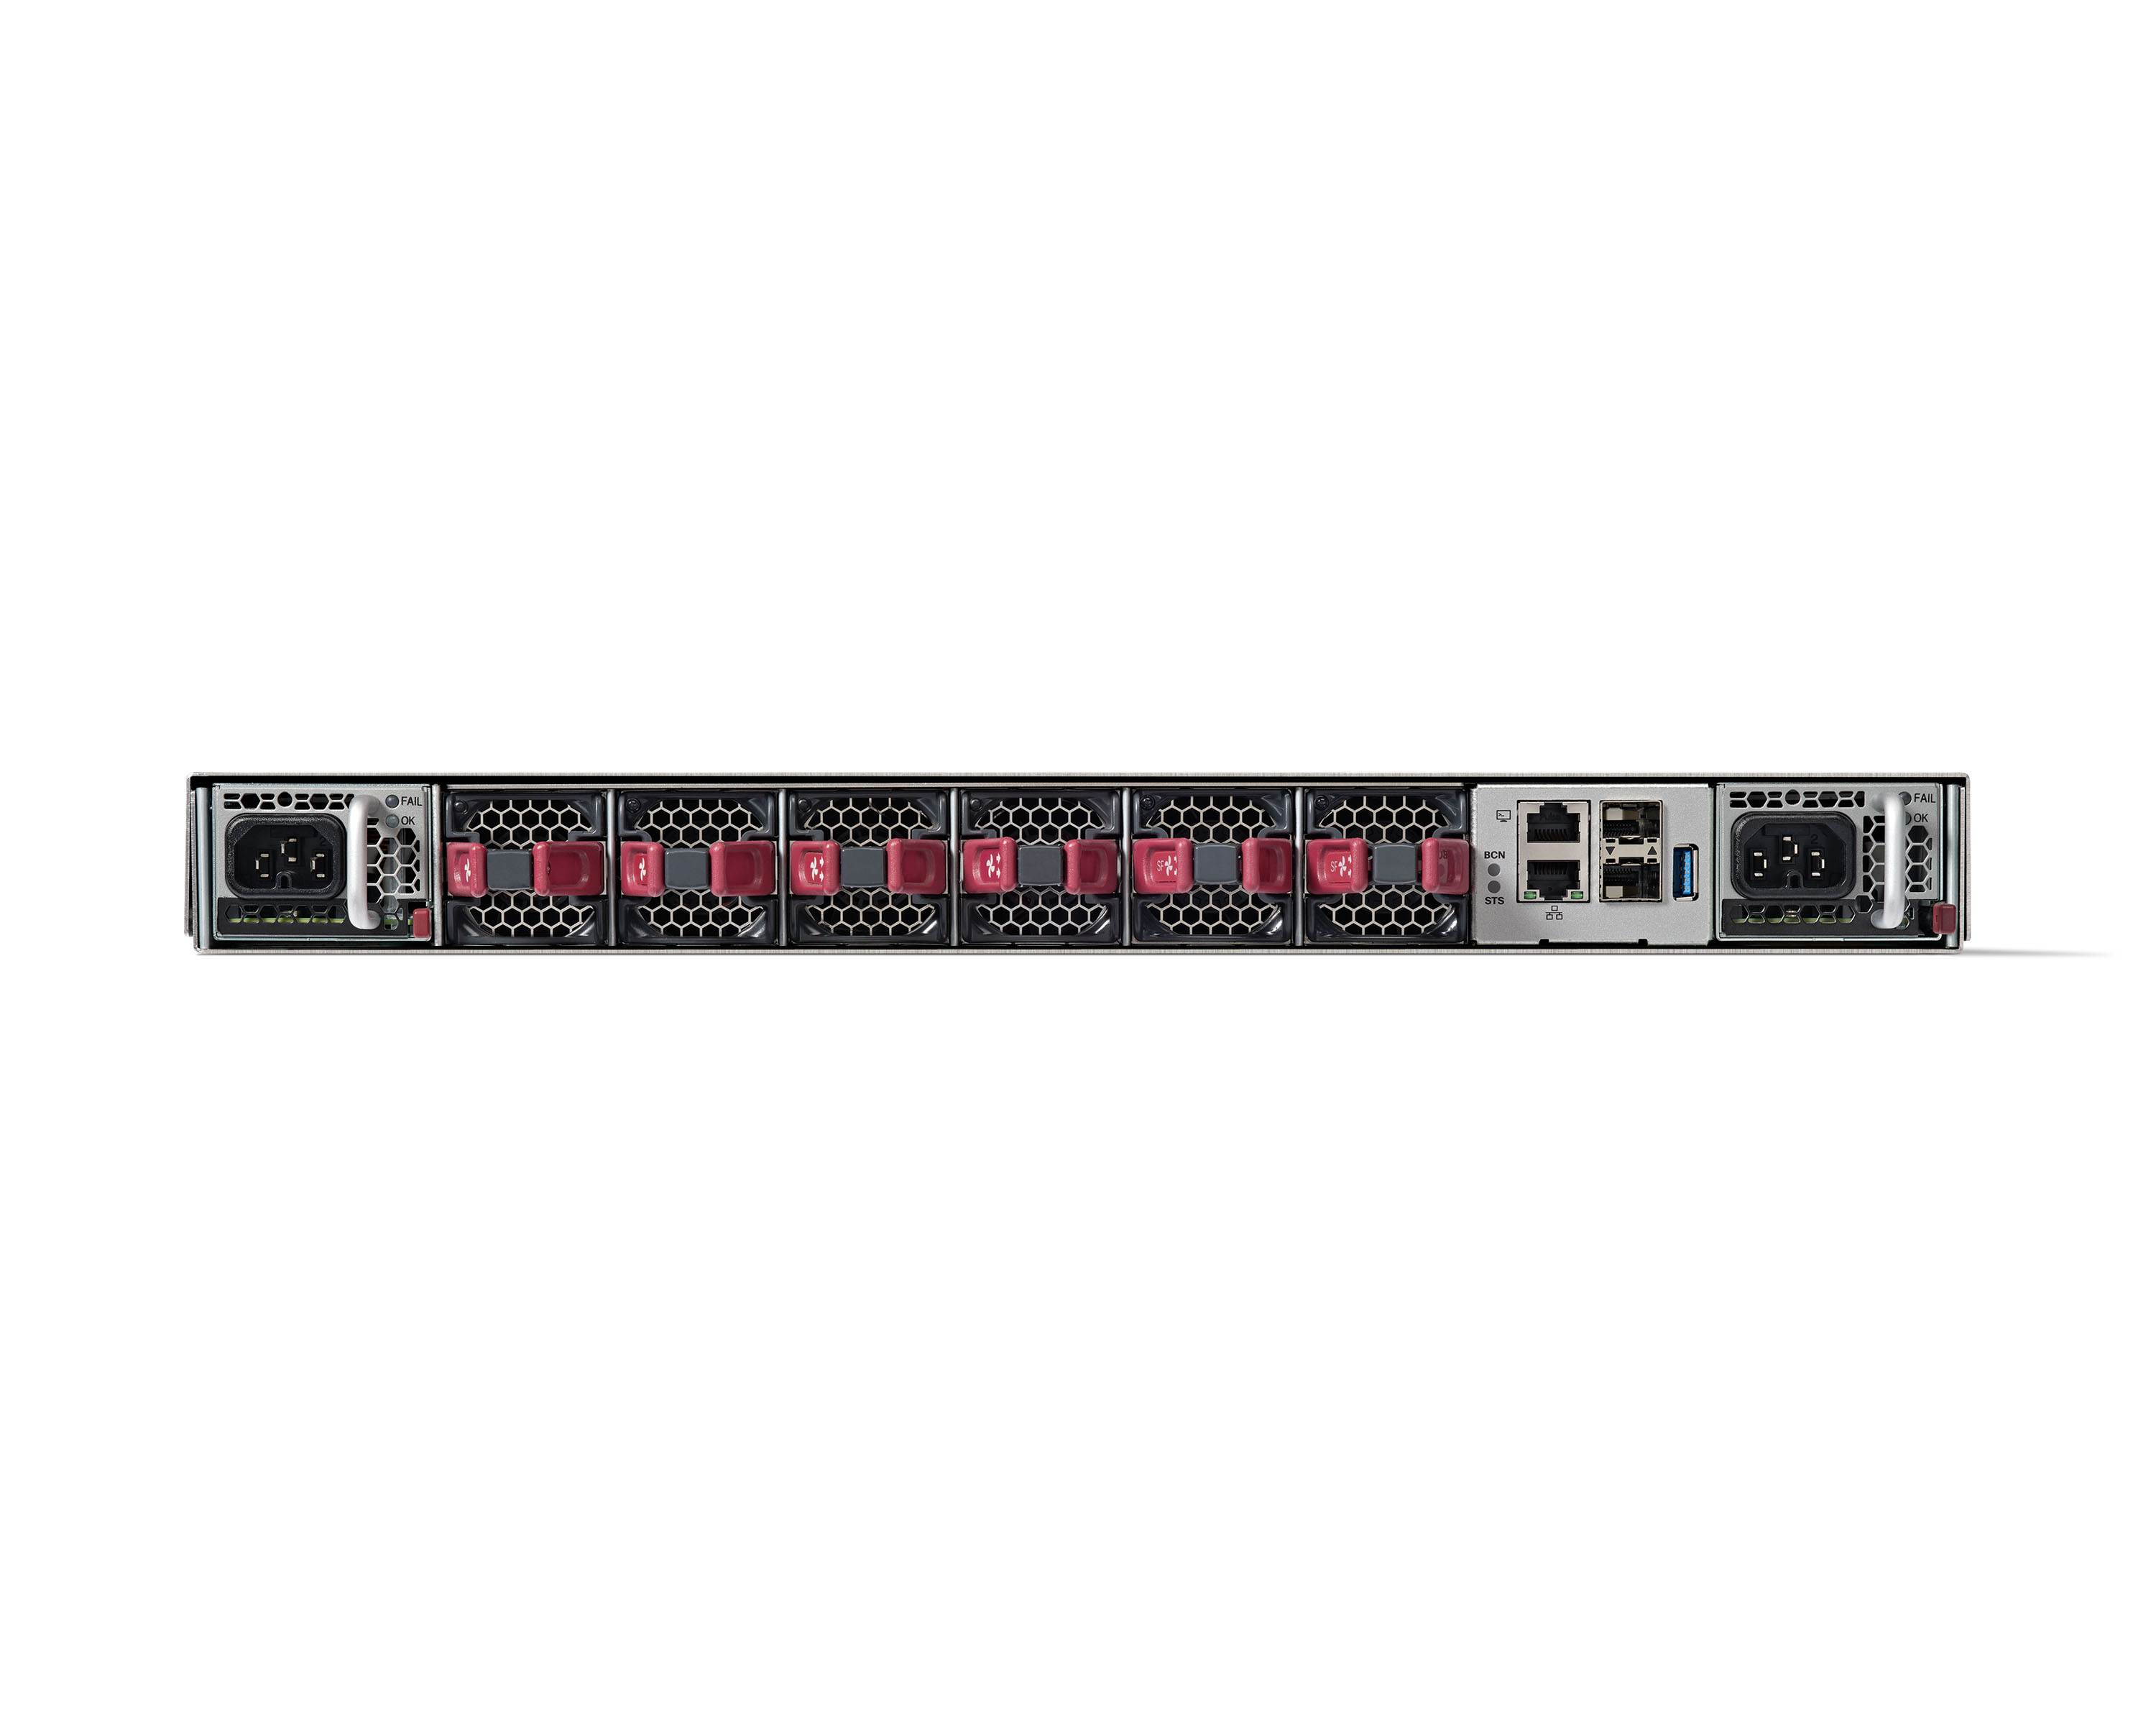
The Cisco Nexus Series switches perform admirably in our blended distributed system. We have been dealing with any of these sorts of switches for over 5 years and have been exceptionally happy with their functionality. Several of our other computer networks in our data rooms have proved effective with Cisco equipment. Because of the simplicity of maintenance and the high quality of technical support provided by Cisco representatives, there is a high level of trust in these switches.
SolarWinds NetFlow Traffic Analyzer compared to Wireshark and PRTG Network Monitor beats it by just the simple interface. Though all are manual setup, NTA takes it a step further with graphs and reports that analyze the data for you. In comparing to Extrahop from a bandwidth comparison, Extrahop wins but Extrahop is a lot more than just a bandwidth monitoring and cost.
The platform is very well done, and to date, I have had no complaints about the implementation of the platform and no security issues or vulnerabilities. Cisco in all its product releases new versions to resolve security issues or bugs that appear on the platform, this is a big plus.
Be prepared to answer lots of questions. When people see the data in NTA they are going to want to know why App A is talking to App B. Be ready to explain!
Hand the keys to the NTA kingdom to the network team. They will thank you. Everyone wants to have friends on the network team, right?
Be prepared to invest in some significant compute and storage performance to keep up with your NTA monitoring
Running the latest firmware for your network gear is (often) required to take advantage of all the flow-monitoring. You upgrade regularly, right??