Clear Analytics vs. Jama Analyze (Discontinued) vs. Microsoft BI (MSBI)

Overview
ProductRatingMost Used ByProduct SummaryStarting Price
Clear Analytics
Score 8.8 out of 10
Enterprise companies (1,001+ employees)
Clear Analytics is a business intelligence solution that enables non technical end users to perform analytics by leveraging existing knowledge of Excel coupled with a built in query builder. Some key features include: Dynamic Data Refresh, Data Share and In-Excel Collaboration.
$29
Per Seat per Month
Jama Analyze (Discontinued)
Score 8.0 out of 10
Mid-Size Companies (51-1,000 employees)
Jama Analyze (formerly called Notion) was a solution for quickly creating shareable, custom dashboards. However, the product is no longer available. Jama Software sunset the Analyze product in 2019. Some of the benefits of Jama Analyze included the ability to: Create custom metrics across all teams with data from any source with the intuitive metric builder. Experience self-serve BI with no coding and no IT to get started making custom dashboards.…
$23
per month
Microsoft BI (MSBI)
Score 8.7 out of 10
N/A
Microsoft BI is a business intelligence product used for data analysis and generating reports on server-based data. It features unlimited data analysis capacity with its reporting engine, SQL Server Reporting Services alongside ETL, master data management, and data cleansing.
$14
per month per user
Pricing
Clear AnalyticsJama Analyze (Discontinued)Microsoft BI (MSBI)
Editions & Modules
Personal
$29
Per Seat per Month
Team
$165
upto 10 Seat per Month
Department
$265
upto 25 Seat per month
Organization
$565
Upto 100 per seat per month
Starter Teams - 2 users
$23
per month
Small Teams - 5 users
$89
per month
Growing Teams - 10 users
$179
per month
Growing Teams - 15 users
$259
per month
Growing Teams - 20 users
$339
per month
Power BI Pro
$14
per month per user
Power BI Premium
$24
per month per user
Offerings
Pricing Offerings
Clear AnalyticsJama Analyze (Discontinued)Microsoft BI (MSBI)
Free Trial
YesYesNo
Free/Freemium Version
NoNoYes
Premium Consulting/Integration Services
YesNoNo
Entry-level Setup Fee$800 Initial OnBoardingNo setup feeNo setup fee
Additional DetailsCertain Enterprise level features can be made available to Small Business edition at additional cost. Such services include Scheduler and OLAP connectivity. Custom adapters can also be created to connect to SaaS services.
More Pricing Information
Community Pulse
Clear AnalyticsJama Analyze (Discontinued)Microsoft BI (MSBI)
Features
Clear AnalyticsJama Analyze (Discontinued)Microsoft BI (MSBI)
BI Standard Reporting
Comparison of BI Standard Reporting features of Product A and Product B
Clear Analytics
9.0
8 Ratings
9% above category average
Jama Analyze (Discontinued)
9.3
1 Ratings
13% above category average
Microsoft BI (MSBI)
9.0
53 Ratings
9% above category average
Pixel Perfect reports9.08 Ratings9.01 Ratings8.646 Ratings
Customizable dashboards9.18 Ratings10.01 Ratings9.653 Ratings
Report Formatting Templates8.78 Ratings9.01 Ratings9.051 Ratings
Ad-hoc Reporting
Comparison of Ad-hoc Reporting features of Product A and Product B
Clear Analytics
8.9
8 Ratings
10% above category average
Jama Analyze (Discontinued)
8.0
1 Ratings
0% below category average
Microsoft BI (MSBI)
8.6
53 Ratings
7% above category average
Drill-down analysis9.28 Ratings00 Ratings8.648 Ratings
Formatting capabilities8.78 Ratings00 Ratings8.353 Ratings
Report sharing and collaboration8.98 Ratings8.01 Ratings9.053 Ratings
Integration with R or other statistical packages00 Ratings00 Ratings8.442 Ratings
Report Output and Scheduling
Comparison of Report Output and Scheduling features of Product A and Product B
Clear Analytics
9.0
8 Ratings
9% above category average
Jama Analyze (Discontinued)
7.0
1 Ratings
16% below category average
Microsoft BI (MSBI)
8.6
52 Ratings
5% above category average
Publish to Web9.08 Ratings7.01 Ratings9.448 Ratings
Publish to PDF9.17 Ratings00 Ratings9.248 Ratings
Report Versioning8.98 Ratings7.01 Ratings7.544 Ratings
Report Delivery Scheduling8.87 Ratings00 Ratings8.647 Ratings
Delivery to Remote Servers00 Ratings00 Ratings8.626 Ratings
Data Discovery and Visualization
Comparison of Data Discovery and Visualization features of Product A and Product B
Clear Analytics
9.0
8 Ratings
12% above category average
Jama Analyze (Discontinued)
10.0
1 Ratings
22% above category average
Microsoft BI (MSBI)
8.8
52 Ratings
10% above category average
Pre-built visualization formats (heatmaps, scatter plots etc.)8.98 Ratings10.01 Ratings9.651 Ratings
Location Analytics / Geographic Visualization9.18 Ratings00 Ratings8.848 Ratings
Predictive Analytics00 Ratings00 Ratings7.945 Ratings
Pattern Recognition and Data Mining00 Ratings00 Ratings8.86 Ratings
Access Control and Security
Comparison of Access Control and Security features of Product A and Product B
Clear Analytics
9.3
8 Ratings
9% above category average
Jama Analyze (Discontinued)
7.7
1 Ratings
10% below category average
Microsoft BI (MSBI)
9.3
53 Ratings
9% above category average
Multi-User Support (named login)9.48 Ratings8.01 Ratings9.549 Ratings
Role-Based Security Model9.08 Ratings7.01 Ratings9.447 Ratings
Multiple Access Permission Levels (Create, Read, Delete)9.48 Ratings8.01 Ratings9.049 Ratings
Report-Level Access Control00 Ratings00 Ratings9.46 Ratings
Single Sign-On (SSO)00 Ratings00 Ratings9.531 Ratings
Mobile Capabilities
Comparison of Mobile Capabilities features of Product A and Product B
Clear Analytics
8.6
6 Ratings
11% above category average
Jama Analyze (Discontinued)
6.5
1 Ratings
17% below category average
Microsoft BI (MSBI)
8.1
42 Ratings
5% above category average
Mobile Application8.54 Ratings00 Ratings8.030 Ratings
Dashboard / Report / Visualization Interactivity on Mobile8.76 Ratings6.01 Ratings7.939 Ratings
Responsive Design for Web Access00 Ratings7.01 Ratings8.239 Ratings
Application Program Interfaces (APIs) / Embedding
Comparison of Application Program Interfaces (APIs) / Embedding features of Product A and Product B
Clear Analytics
-
Ratings
Jama Analyze (Discontinued)
6.0
1 Ratings
25% below category average
Microsoft BI (MSBI)
8.6
24 Ratings
11% above category average
REST API00 Ratings6.01 Ratings9.321 Ratings
Javascript API00 Ratings00 Ratings8.921 Ratings
iFrames00 Ratings00 Ratings8.920 Ratings
Java API00 Ratings00 Ratings8.918 Ratings
Themeable User Interface (UI)00 Ratings00 Ratings8.221 Ratings
Customizable Platform (Open Source)00 Ratings00 Ratings7.619 Ratings
Best Alternatives
Clear AnalyticsJama Analyze (Discontinued)Microsoft BI (MSBI)
Small Businesses
Yellowfin
Yellowfin
Score 8.7 out of 10
Yellowfin
Yellowfin
Score 8.7 out of 10
Yellowfin
Yellowfin
Score 8.7 out of 10
Medium-sized Companies
Reveal
Reveal
Score 10.0 out of 10
Reveal
Reveal
Score 10.0 out of 10
Reveal
Reveal
Score 10.0 out of 10
Enterprises
Kyvos Semantic Layer
Score 9.5 out of 10
Kyvos Semantic Layer
Score 9.5 out of 10
Kyvos Semantic Layer
Score 9.5 out of 10
All AlternativesView all alternativesView all alternativesView all alternatives
User Ratings
Clear AnalyticsJama Analyze (Discontinued)Microsoft BI (MSBI)
Likelihood to Recommend
9.0
(8 ratings)
8.0
(1 ratings)
10.0
(73 ratings)
Likelihood to Renew
-
(0 ratings)
-
(0 ratings)
8.0
(25 ratings)
Usability
9.1
(8 ratings)
-
(0 ratings)
10.0
(15 ratings)
Availability
-
(0 ratings)
-
(0 ratings)
9.5
(2 ratings)
Performance
-
(0 ratings)
-
(0 ratings)
7.0
(2 ratings)
Support Rating
9.5
(8 ratings)
-
(0 ratings)
8.9
(15 ratings)
In-Person Training
-
(0 ratings)
-
(0 ratings)
6.9
(3 ratings)
Online Training
-
(0 ratings)
-
(0 ratings)
8.5
(2 ratings)
Implementation Rating
-
(0 ratings)
-
(0 ratings)
9.6
(7 ratings)
Configurability
-
(0 ratings)
-
(0 ratings)
10.0
(2 ratings)
User Testimonials
Clear AnalyticsJama Analyze (Discontinued)Microsoft BI (MSBI)
Likelihood to Recommend
Clear Analytics
Clear Analytics has almost all the features which are mostly required by the organizations for their data analytics and transformation activities. Clear Analytics is built on the support of a parallel query engine which makes it handle large volume requests and also provides optimized results. However, every solution has some limitations, Clear Analytics lacks advanced features such as Predictive Analytics which is a very demanding feature in the market as most organizations are adopting AI/ML automation for their businesses. Also, it needs to add a lot of advanced visualizations so that the user has the choice of selection. Overall a good solution to be recommended.
Read full review
Jama Software
The integration with JIRA is quite a handy tool to have. It allows for team progress to be easily tracked and visualized using the software while key metrics are brought to the forefront through the software's business intelligence. It makes presenting data and milestones achieved to non-technical management quite simple and can be extremely useful.
Read full review
Microsoft
Microsoft BI has a lot of features and is a very powerful tool, especially if you have folks on your team that know how to utilize all of its capabilities. To truly unlock all that it can do, it does require people to have a deep understanding of its capabilities. That's where the software really shines. If you are looking for a simpler, more basic reporting tool, there are other programs available that do not require such a steep learning curve.
Read full review
Pros
Clear Analytics
  • Quick management of the data through Excel thanks to the tools Clear Analytics provides such as filtering different information for an easier view.
  • Ability to add new KPIs to measure different areas of our business.
  • Drag and drop tool which makes an easier usage of Excel.
  • Cost-effective. I find Clear Analytics to be affordable considering the number of features added and the unlimited sharing and editing it provides.
Read full review
Jama Software
  • This allows us to keep track of our team's work by integrating with our product boards on JIRA.
  • It allows us to create visualized reports for our team's progress.
  • It allows us to gain insights about things that are going well in our product pipeline as well as potential areas of concern based on the data that is collected.
Read full review
Microsoft
  • Comparatively easy to use compared to other data analytics solutions, collaborating with other colleagues on data work is simple.
  • Using Visual Studio for database, ETL, reporting, and analytics development save time and money.
  • Transfer of data from one application to another via Excel and comparison of data attributes between applications
  • Dashboard functionality, as well as Python support, are available, allowing you to add additional charts and graphs.
Read full review
Cons
Clear Analytics
  • For Charts and Graphs , getting the Power Point Deck would be helpful. As of now we use the data from Excel Reports
Read full review
Jama Software
  • The service tends to be slow at times and working offline can be a pain.
  • It has a bit of a learning curve when you start out.
  • The price is quite high for the features it offers.
Read full review
Microsoft
  • MSBI designs can work on increasing data processing capabilities enough to handle the huge datasets etc.
  • It would be a lot better if it is a little low on cost.
  • it needs to create opportunities little more than they do regarding customization of some very unique visualization effects
Read full review
Likelihood to Renew
Clear Analytics
No answers on this topic
Jama Software
No answers on this topic
Microsoft
Microsoft BI is fundamental to our suite of BI applications. That being said, Northcraft Analytics is focused on delighting our customers, so if the underlying factors of our decision change, we would choose to re-write our BI applications on a different stack. Luckily, mathematics are the fundamental IP of our technology... and is portable across all BI platforms for the foreseeable future.
Read full review
Usability
Clear Analytics
I have really enjoyed working with Clear Analytics. This platform has contributed to increased production and reliable data control processes. It has flexible user interface that can be operated by any organization member. Reports are shared on simple and transparent way in the dashboard for easy access. Data analytics from all departments have created manageable working environment that have increased production.
Read full review
Jama Software
No answers on this topic
Microsoft
The Microsoft BI tools have great usability for both developers and end users alike. For developers familiar with Visual Studio, there is little learning curve. For those not, the single Visual Studio IDE means not having to learn separate tools for each component. For end-users, the web interface for SSRS is simple to navigate with intuitive controls. For ad-hoc analysis, Excel can connect directly to SSAS and provide a pivot table like experience which is familiar to many users. For database development, there is beginning to be some confusion, as there are now three tool choices (VS, SSMS, Azure Data Studio) for developers. I would like to see Azure Data Studio become the superset of SSMS and eventually supplant it.
Read full review
Reliability and Availability
Clear Analytics
No answers on this topic
Jama Software
No answers on this topic
Microsoft
The product has been reliable.
Read full review
Performance
Clear Analytics
No answers on this topic
Jama Software
No answers on this topic
Microsoft
SQL Server Reporting Services (SSRS) can drag at times. We created two report servers and placed them under an F5 load balancer. This configuration has worked well. We have seen sluggish performance at times due to the Windows Firewall.
Read full review
Support Rating
Clear Analytics
I have had multiple scenarios where I had to reach out to the support team of Clear Analytics, be it access-related, general queries, during initial implementation, etc. My overall experience has always been good. I got the needed support every time without any delay. I can definitely recommend Clear Analytics simply on the basis of its excellent support team.
Read full review
Jama Software
No answers on this topic
Microsoft
MSBI natively has a site that allows you to vote on user enhancements and bug fixes. This allows the largest nagging issues to float to the top and the development team can prioritize accordingly. As mentioned earlier, the large community base of MSBI developers assist technical resources in handling technical questions.
Read full review
In-Person Training
Clear Analytics
No answers on this topic
Jama Software
No answers on this topic
Microsoft
This training was more directed toward what the product was capable of rather than actual programming.
Read full review
Online Training
Clear Analytics
No answers on this topic
Jama Software
No answers on this topic
Microsoft
I have used on-line training from Microsoft and from Pragmatic Works. I would recommend Pragmatic Works as the best way to get up to speed quickly, and then use the Microsoft on-line training to deep dive into specific features that you need to get depth with.
Read full review
Implementation Rating
Clear Analytics
No answers on this topic
Jama Software
No answers on this topic
Microsoft
We are a consulting firm and as such our best resources are always billing on client projects. Our internal implementation has weaknesses, but that's true for any company like ours. My rating is based on the product's ease of implementation.
Read full review
Alternatives Considered
Clear Analytics
There are other great tools that are out there but Clear Analytics is reasonable for our business and provides a lot of features that we specifically needed
Read full review
Jama Software
Jama Analyze, as well as Asana, connect with JIRA to visualize milestone tracking and team progress. While Asana is cheaper, Jama Analyze provides better reports and visual data. Google Data Studio, through a bit of tinkering from your software development team, can achieve similar results, however, the charts and graphs leave a bit to be desired in terms of design. In all, Jama Analyze is great if you have few users and don't need to go for the licensing option. Otherwise, there are definitely cheaper options available but you may have to sacrifice on performance and look-and-feel.
Read full review
Microsoft
We have used the built in ConnectWise Manager reports and custom reports. The reports provide static data. PowerBI shows us live data we can drill down into and easily adjust parameters. It's much more useful than a static PDF report.
Read full review
Return on Investment
Clear Analytics
  • Super useful to get started immediately
  • Didn't have to rely on migrating data
  • Easy to add members
  • Easy to learn and build charts
Read full review
Jama Software
No answers on this topic
Microsoft
  • As a SaaS provider we see being able to provide self-service BI to our client users as a competitive advantage. In fact the MSSQL enabled BI is a contributing factor to many winning RFPs we have done for prospective client organisations.
  • However MSSQL BI requires extensive knowledge and skills to design and develop data warehouses & data models as a foundation to support business analysts and users to interrogate data effectively and efficiently. Often times we find having strong in-house MSSQL expertise is a bless.
Read full review
ScreenShots

Clear Analytics Screenshots

Screenshot of Clear Analytics integrated Excel panel essentially transforms standalone Excel into an enterprise strength, fully auditable, collaborative and centralized business intelligence platform.Screenshot of Users have the ability to dynamically query systems and render that data in any way they like.  No more waiting on IT to create reports.Screenshot of Your firms existing knowledge of Excel enables the firm to be product from day 1. Use the skills already present in your organization and don't pay for outside reporting consultants to create reports for you.Screenshot of Leverage the integration capability of Microsoft's Power BI to extend the reach of your data to web and mobile devices.Screenshot of Leverage all of Excels capabilities, from it's slicers to miniature spark-line charts to create incredibly informative and responsive dashboards.

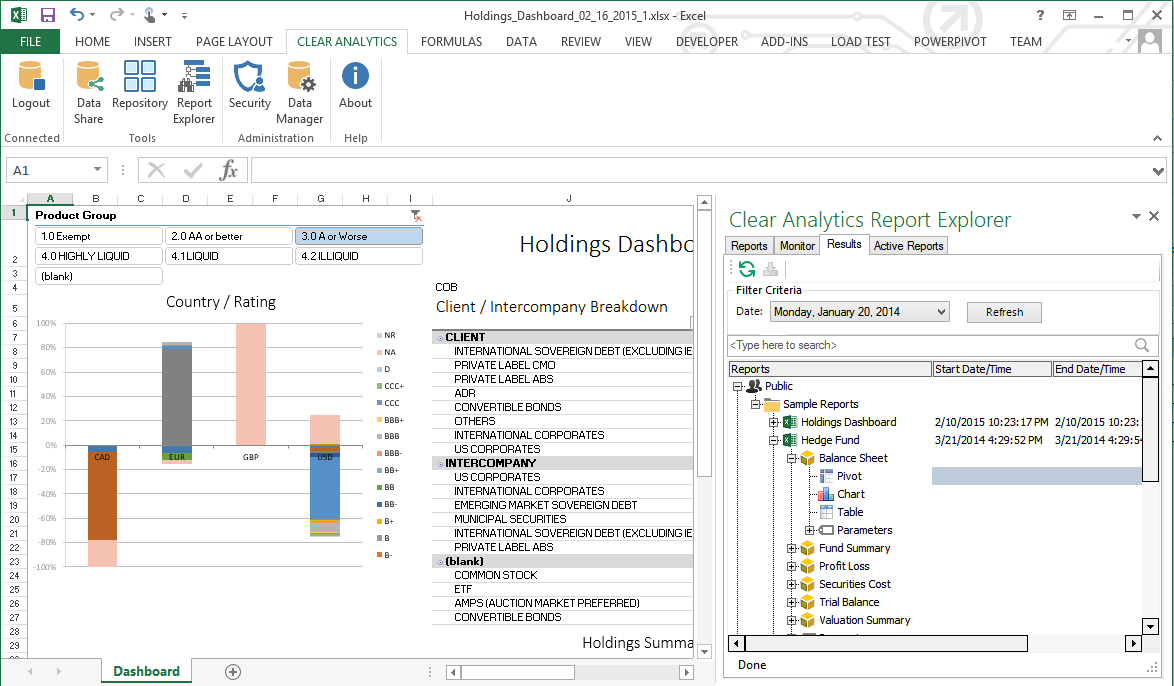
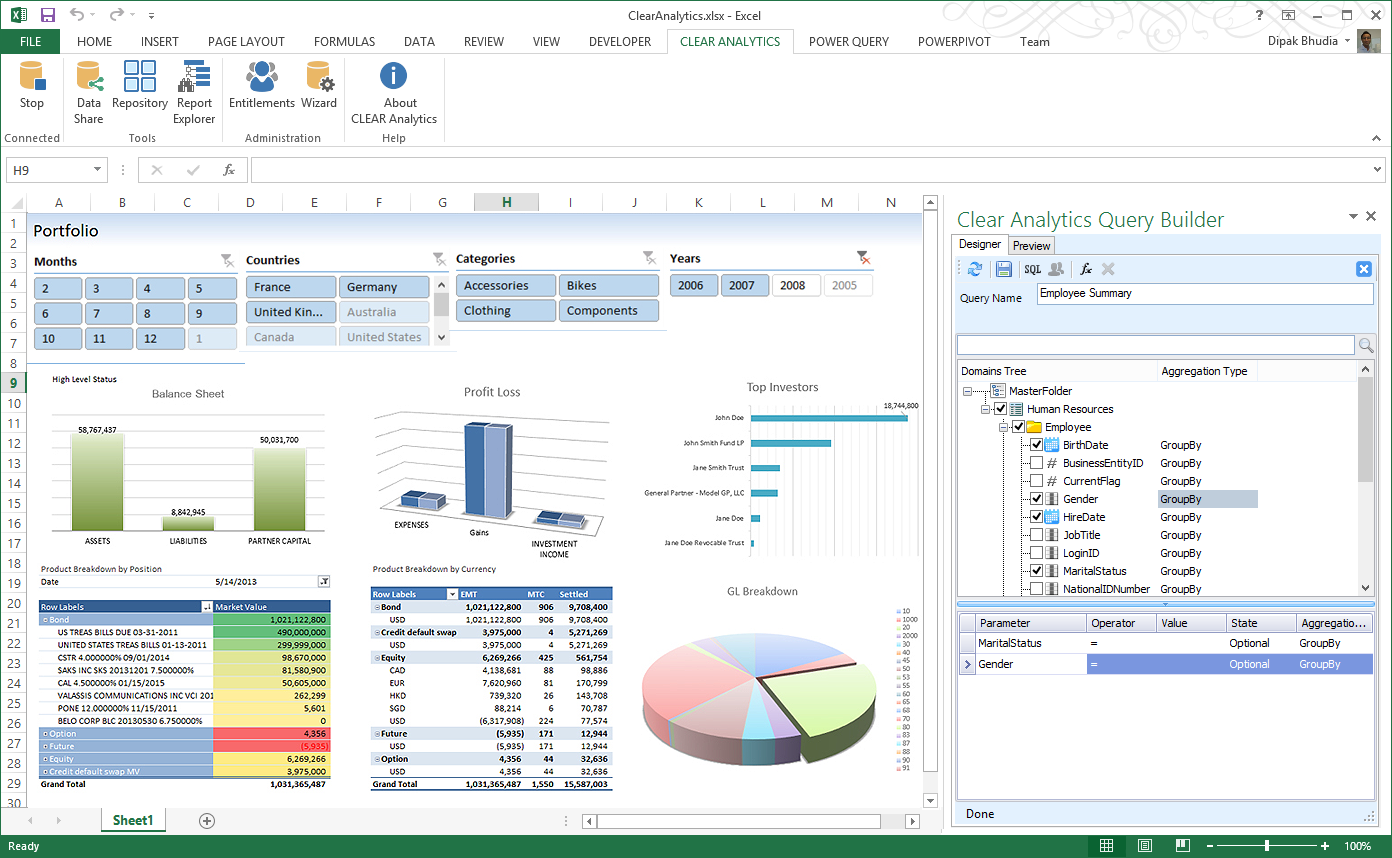
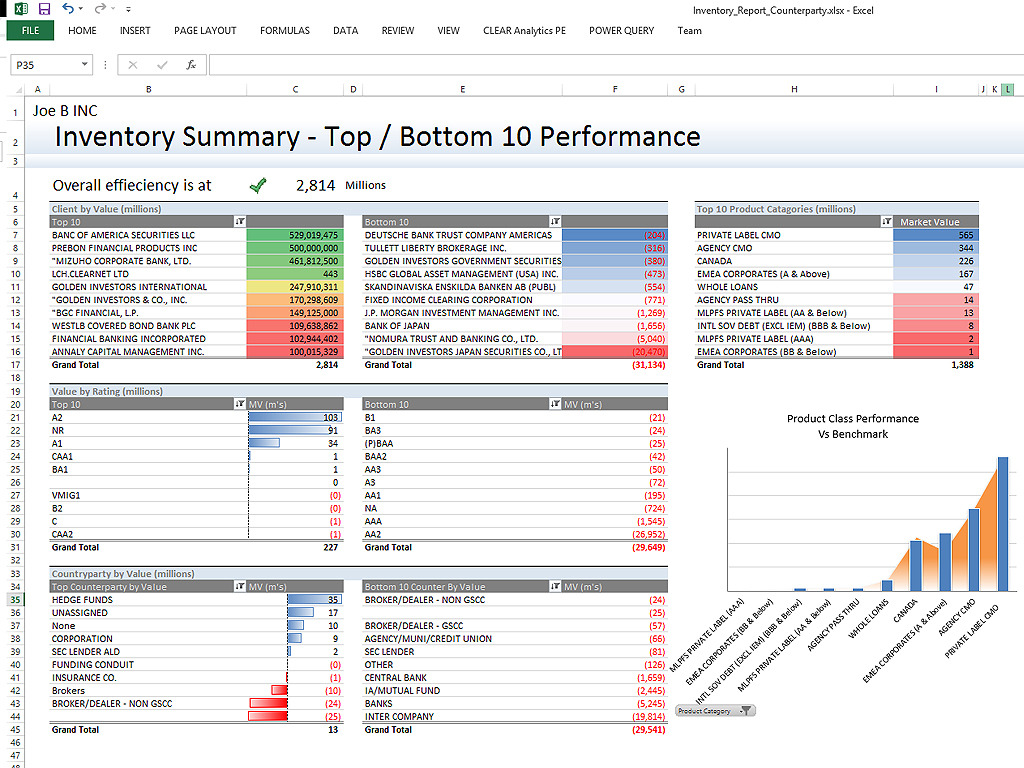
Jama Analyze (Discontinued) Screenshots
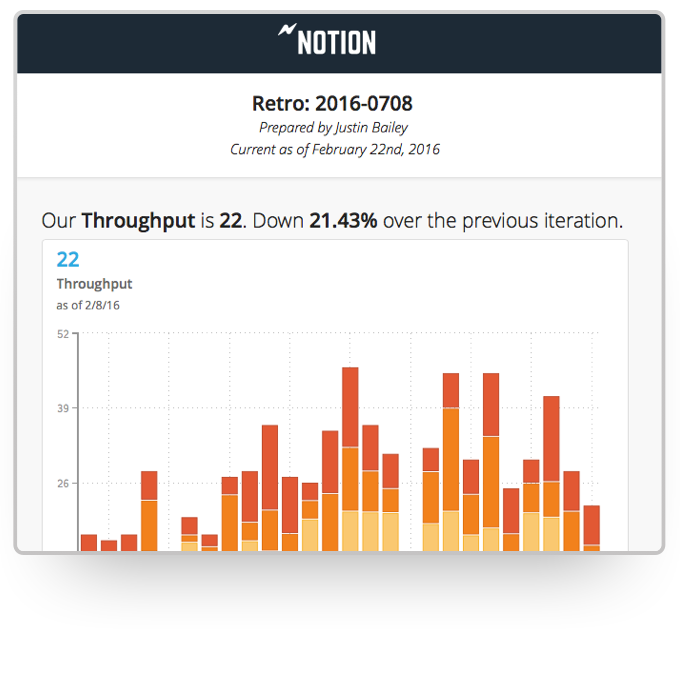
Screenshot of An example of a Notion dashboard with custom team metrics, a variety of visualizations, and summaries of the data at the top of each card.Screenshot of The Notion directory is where metrics from all your data sources live, making it easy to compare and combine. Give your team a single source of truth for the metrics that matter most.Screenshot of You can also assign metric ownership to members of your team. They'll got automatic reminders to report the data.Screenshot of Build custom metrics and quickly change how they're visualized or the reporting interval.Screenshot of Every metric has built-in commenting to help you capture context around the data.Screenshot of One click reporting means it's easy to share important team or product performance data with key stakeholders.