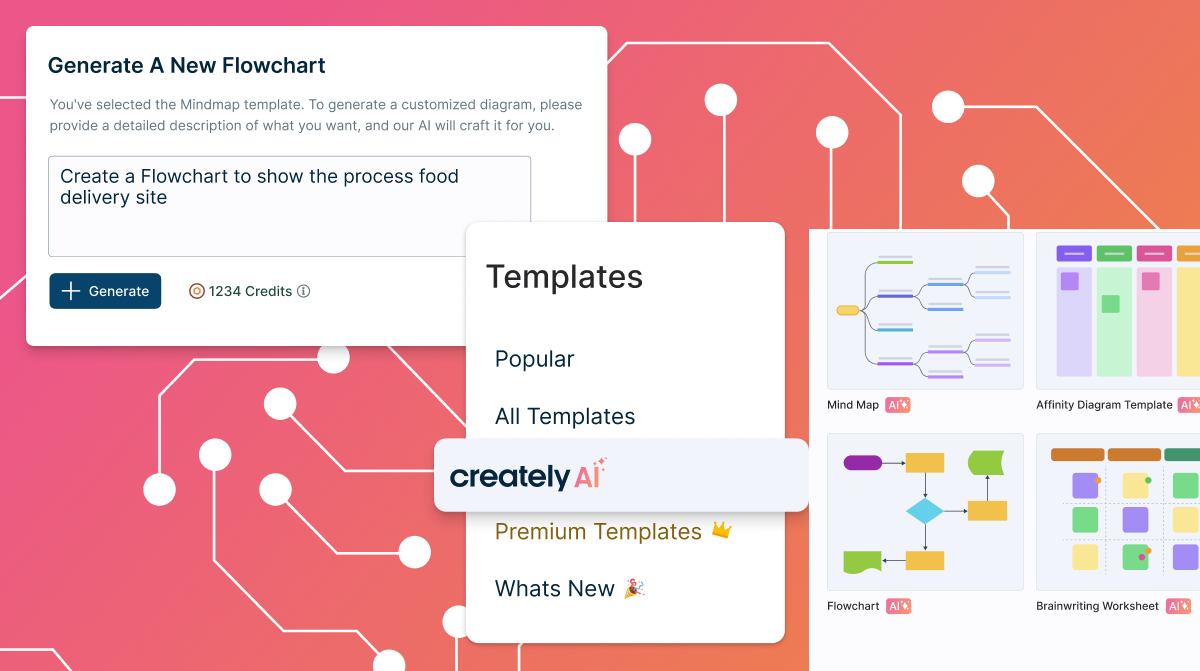
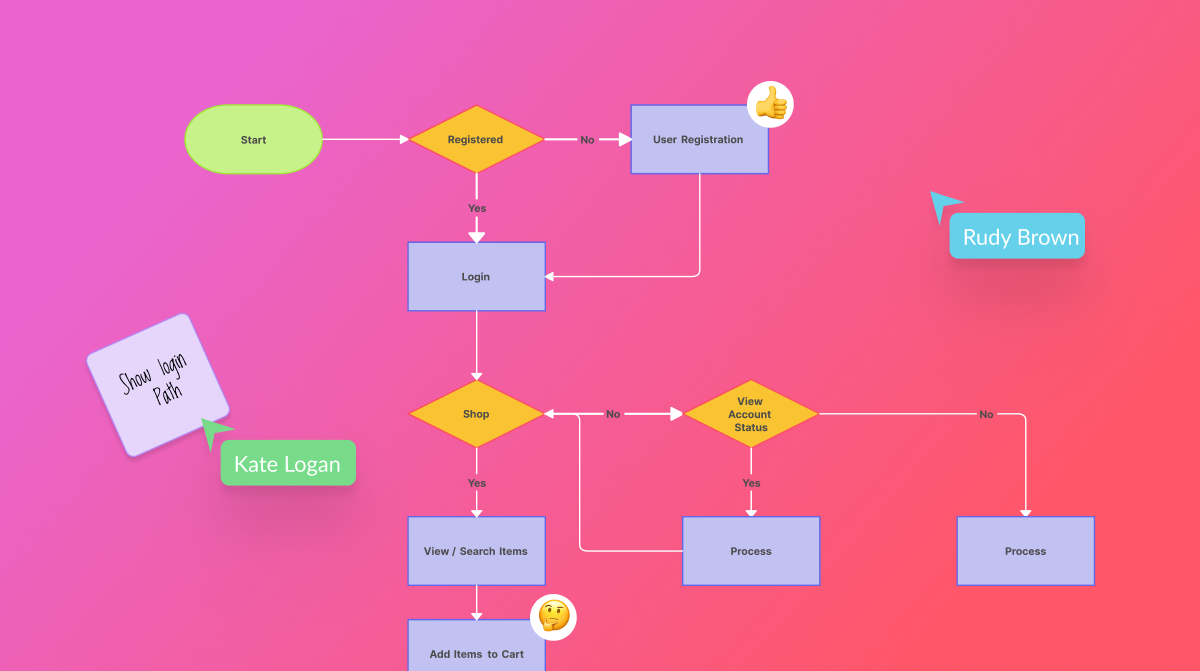
Creately is a visual collaboration platform that supports genograms, flowcharts, org charts, mind maps, and UML diagrams. Featuring template-based AI diagram generation, Creately boasts speed and accuracy in visual planning.
$8
per month (single user)
draw.io
Score 7.8 out of 10
N/A
draw.io is an online diagramming tool with integrations with Jira, Google, and Confluence available free online or at cost depending on integration chosen.
$5
per month
Pricing
Creately
draw.io
Editions & Modules
Creately Personal
$8
per month
Creately Team
$8
per month per user
Creately Team
$60
per year per user
Creately Personal
$60
per year
Creately Business
$149
per month Unlimited Users
Creately Business
$1,068
per year Unlimited Users
Up to 10 Users
$5
per month
Up to 20 Users
$11
per month
Up to 50 Users
$27.50
per month
Up to 75 Users
$41.25
per month
Up to 100 Users
$55
per month
Up to 200 Users
$95
per month
Up to 500 Users
$152.50
per month
Up to 750 Users
$190
per month
Up to 1,000 Users
$227.50
per month
Up to 2,000 Users
$377.50
per month
Up to 5,000 Users
$827.50
per month
Up to 10,000
1,577.50
per month
Offerings
Pricing Offerings
Creately
draw.io
Free Trial
Yes
No
Free/Freemium Version
Yes
No
Premium Consulting/Integration Services
Yes
No
Entry-level Setup Fee
No setup fee
No setup fee
Additional Details
Discounted prices for non profits, educational institutes, and charities.
—
More Pricing Information
Community Pulse
Creately
draw.io
Considered Both Products
Creately
Verified User
Manager
Chose Creately
Creately's folder system is a novel feature that beats its competitors. It helps keep everything organized. In addition, there are many more customization possibilities, especially in the shapes and in the library of templates and drawings. It has an intelligent drawing …
Creately sells itself as software specializing in a wide variety of areas, which is true in some cases. Visualizing and creating marketing processes, research, user flows, and general flowcharts is an extremely powerful tool. However, in other areas, such as Human Resources, UI/UX prototyping, and Wireframe design, it leaves a little to be desired compared to the competition.
draw.io can be more suitable for technical documentation for architectures, flow diagrams/charts, and conceptual images of an application infrastructure. However, this tool is not made for business intelligence work nor for dashboarding to monitor the technical components. From the administrative standpoint, this is not well suited for agile ceremony structures like retrospective boards or planning or even quarterly planning boards. The strength of draw.io lies strongly in being a lightweight diagramming tool.
Draw.io offers a lot of shapes and customizability of how the diagrams are laid out. We've been able to create a lot of different things with it, and have barely scratched the surface of the sorts of things that we could do.
Draw.io is fairly intuitive in the way that you draw shapes and connect shapes together, I was able to figure it out without a tutorial.
Draw.io is fast and performant for me compared with some of the alternatives.
The UI is intuitive. It allows a new user to start diagramming almost instantly. Manipulating elements, linking them together, etc. are all easy to do. Draw.io nevertheless a broad variety of diagram templates to help get started and also of shapes to use in diagrams. Some situations can make it a bit tricky to use, such as when having multiple shapes on top of each other (e.g. shapes placed within swimlanes) but that's a minor issue.
The support for draw.io is pretty decent, considering it is a free website. I had a question one time when I was trying to do something, so I sent an email to their support email and got a response fairly quickly with an answer to my question. They also have some excellent support tools on their support website for helping you get more familiar with their program, and I found that very helpful.
Creately's folder system is a novel feature that beats its competitors. It helps keep everything organized. In addition, there are many more customization possibilities, especially in the shapes and in the library of templates and drawings. It has an intelligent drawing capability superior to all the competition, allowing more customization and detail.
draw.io is open-source and free for many uses, which means minimal upfront cost and good value.It works in the browser, also has a desktop version (so you can use offline) which helps teams that may not always be online or want local backups. Useful when you want a diagram tool that “just works” without huge ecosystem lock-in.For organisations that value control, less vendor-dependency, this is a plus.