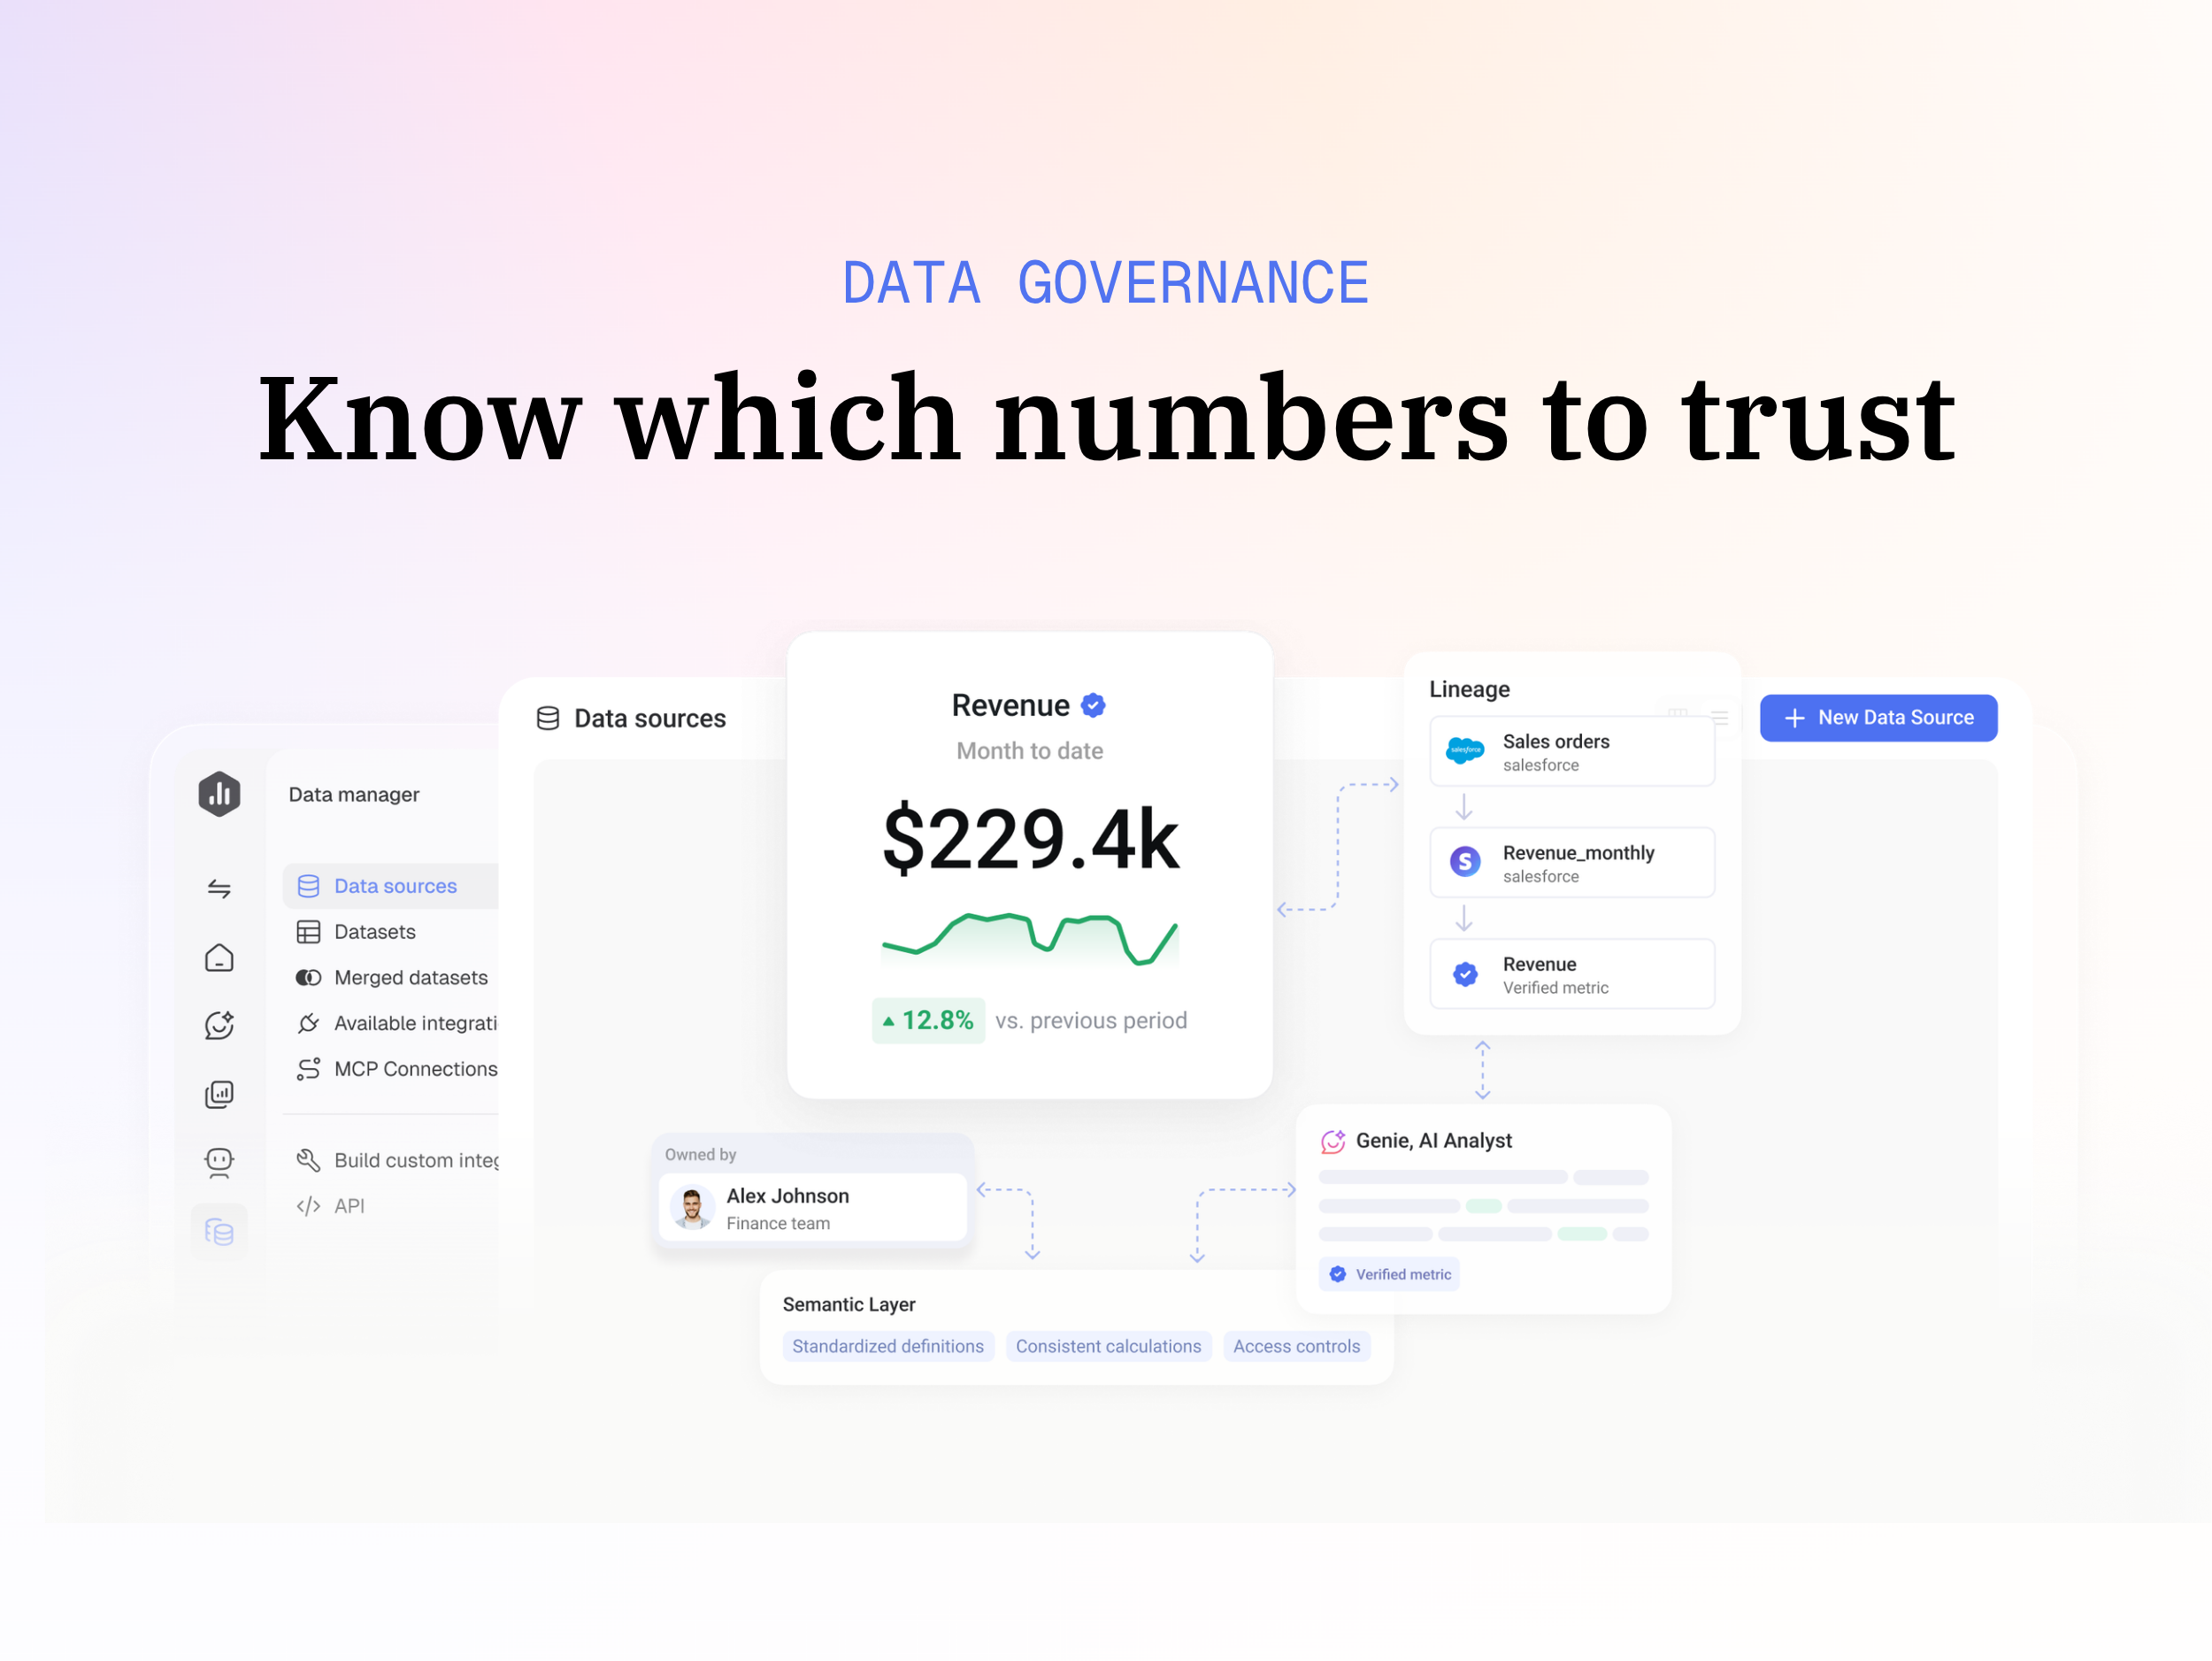
Databox is business intelligence software built for teams that need fast, actionable insights.
$199
per month
Shiny
Score 8.0 out of 10
N/A
Shiny allows users to create data visualization apps, and is designed to be easy to write with. These apps let users interact with data and analyses with R or Python.
In comparison, Databox has been a more robust solution and one that works really well with HubSpot (our preferred marketing automation platform). It's a bit pricier than Cyfe was (not sure now), but the features are worth it.
Much cheaper and seems to do at least as good of a job while having a similar integration stack. I also appreciate the efforts Databox go to on their blog and podcast to help educate people on all things data and metrics.
Databox automatically integrates with tons of different data sources without you needing to arrange the backend information on how everything should connect. Tableau, Power BI, and Sisense require a lot of manual setup unless you have all of your fields perfectly matched up …
While HubSpot is where we store our information and utilize the systems, the reporting wasn't deep enough and it didn't include the entire website since it is hosted elsewhere. So I started looking at options, and Databox came as a recommendation so I checked it out and haven't …
Databox and Grow are similar tools, and truthfully, Grow is a more powerful platform with more sophisticated reporting, integrations, and a larger feature set. However, Grow is significantly more expensive and Databox has the features you need most for less of an investment. I …
HubSpot's reporting tool simply isn't enough. It also doesn't help that the reporting add-on for HubSpot is an additional $200/month, and it only reports on HubSpot stuff. That's why we selected Databox--to report on other platforms like FB ads, Google Analytics, etc.
Databox is unique in its ability to report from multiple data sources. Google Analytics is the standard when it comes to web metrics, but it's just one of the tools that integrates with Databox. Tableau is fantastic for data visualizations and reporting, but it's much more …
Whilst dashboarding may be comparable with some of the other products we evaluated. Nothing compared to the analytical capabilities on offer with Shiny. An added advantage was that we had colleagues knowledgeable in R which meant bringing in Shiny and getting to grips with it …
Shiny is much cheaper to use than Tableau Desktop and Microsoft Power BI. It's not as fancy, and maybe not as effective, but you save lots of money by using Shiny over the previously listed alternatives. The graphs and charts you can make in Shiny are very good for …
Both Tableau and Power BI are easier to learn and allow you to develop dashboards in a faster and more intuitive way, but both have limitations in what you can do with them and if you want to do something more specific it is always more complicated. RStudio is much more …
Shiny can be a good tool in academic but its not upto standard of TMT industry but could possibly be useful in life science industry (which is where its more prevalent usually), its good as its mostly free (not including cost of servers and compute). I would rank its …
Shiny allows easy and fast development of a product into production whereas Jupyter Notebook can be broken really easily by a user. The idea of having a specific server that works with that model is very practical and it's a good advantage. In the contrary, the quantity of …
Databox is fantastic for companies or agencies that regularly report on a variety of metrics from multiple data sources. It's ideal for any company that uses a variety of different tools (as long as Databox integrates with them). It's particularly good for HubSpot agencies and companies that use HubSpot. It's maybe not necessary for companies that only use one tool or don't do reporting.
Shiny is very good for developing dashboards or web applications with specific functionalities. But it is not so easy to use to develop from scratch, it is always better to use another tool to have a general idea of what is expected of a dashboard and then develop the most specific functionalities in Shiny. It is much more flexible than other tools and that is why I consider it to be better for most cases, only that it is more complex to develop or has a longer learning curve.
Some types of data can only be reported on for 1-2 months back. Unless I'm misunderstanding the function of the software this seems really weird. I can't figure out how to report on Activities more than 2 months ago
Databox is an intuitive, well-designed platform that can be used by non-technical marketers. It is easy to learn, and while set up takes time, usability is high and the team has enjoyed creating custom dashboards and clients have also given us great feedback regarding its usability and value. While other BI tools are much more complex to navigate, Databox is a breeze.
I have really enjoyed using Databox and have seen the value of it in many ways. They also continue to improve the functions of it and grow their integrations and templates. I look forward to continuing to use Databox in the future, potentially even finding ways to incorporate it into other departments to help them with reporting as well.
While HubSpot is where we store our information and utilize the systems, the reporting wasn't deep enough and it didn't include the entire website since it is hosted elsewhere. So I started looking at options, and Databox came as a recommendation so I checked it out and haven't turned back. I didn't evaluate any other products because Databox met our need and we were able to get started right away.
Whilst dashboarding may be comparable with some of the other products we evaluated. Nothing compared to the analytical capabilities on offer with Shiny. An added advantage was that we had colleagues knowledgeable in R which meant bringing in Shiny and getting to grips with it was a lot more seamless and welcomed by the end users.