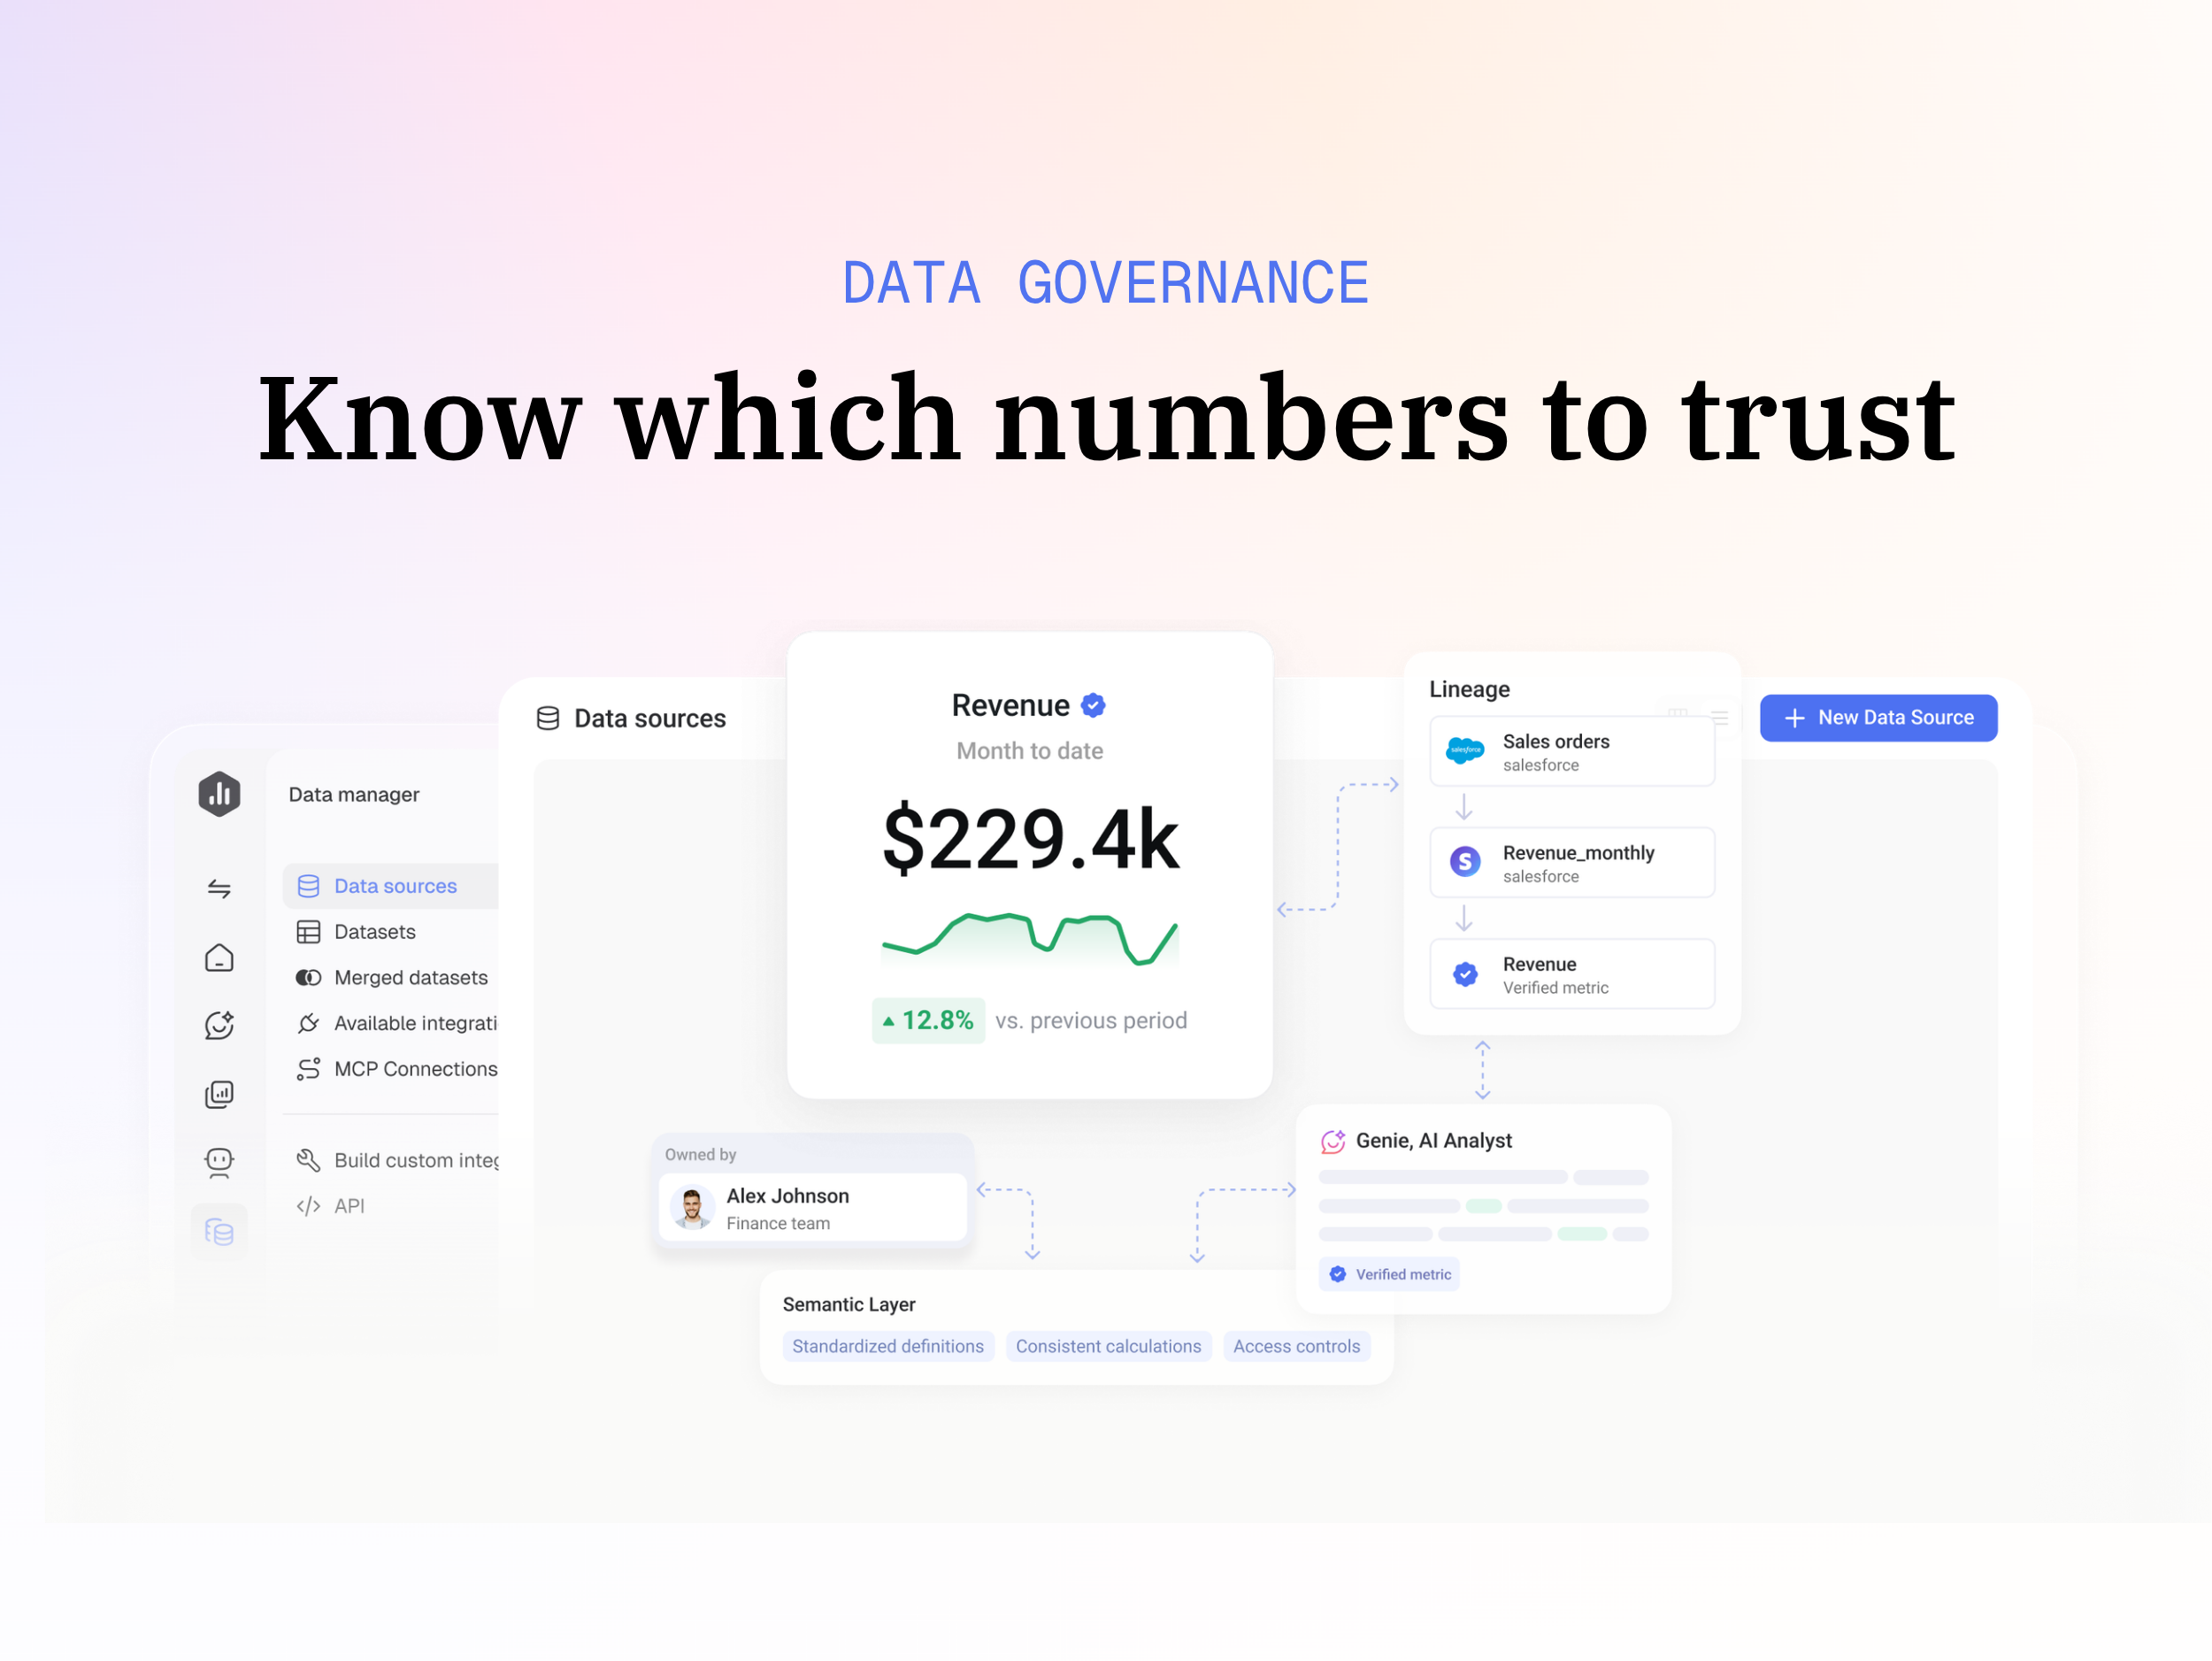
Databox is business intelligence software built for teams that need fast, actionable insights.
$79
per month
Whatagraph
Score9.7 out of 10
N/A
Whatagraph is a marketing data platform that removes data-related manual work and hassle from a marketer's day-to-day. It is designed to make working with data (managing, blending, and visualizing cross-channel data) swift and easy for anyone in a team: Marketing data is collected in a single hub without any third-party tools and connectors. Unstructured, scattered cross-channel data can be managed with no-code transformations. Anyone in a marketing team can execute…
N/A
Pricing
Databox
Whatagraph
Editions & Modules
Free
$0
1 user, 3 data sources & 50 AI credits/mo included
Analyst
$89
per month 1 user, 5 data sources & 150 AI credits/mo included
Team
$249
per month 3 users, 10 data sources & 500 AI credits/mo included
Agency
Starting at $99
per month 4 clients, unlimited users, 20 data sources & 300 AI credits/mo included
Custom
Contact us
More users, More data sources, More AI credits/mo, We optimize it as your needs
No answers on this topic
Offerings
Pricing Offerings
Databox
Whatagraph
Free Trial
Yes
No
Free/Freemium Version
Yes
No
Premium Consulting/Integration Services
Yes
No
Entry-level Setup Fee
No setup fee
No setup fee
Additional Details
20% discount for annual pricing.
—
More Pricing Information
Features
Databox
Whatagraph
BI Standard Reporting
Comparison of BI Standard Reporting features of Databox and Whatagraph
Feature
Databox
9.3
8 Ratings
13% above category average
Whatagraph
-
Ratings
Pixel Perfect reports
10.05 Ratings
00 Ratings
Customizable dashboards
8.98 Ratings
00 Ratings
Report Formatting Templates
8.98 Ratings
00 Ratings
Ad-hoc Reporting
Comparison of Ad-hoc Reporting features of Databox and Whatagraph
Feature
Databox
8.6
8 Ratings
7% above category average
Whatagraph
-
Ratings
Drill-down analysis
8.06 Ratings
00 Ratings
Formatting capabilities
8.98 Ratings
00 Ratings
Integration with R or other statistical packages
7.93 Ratings
00 Ratings
Report sharing and collaboration
9.48 Ratings
00 Ratings
Report Output and Scheduling
Comparison of Report Output and Scheduling features of Databox and Whatagraph
Feature
Databox
8.3
8 Ratings
1% above category average
Whatagraph
-
Ratings
Publish to Web
8.96 Ratings
00 Ratings
Publish to PDF
8.97 Ratings
00 Ratings
Report Versioning
7.74 Ratings
00 Ratings
Report Delivery Scheduling
8.98 Ratings
00 Ratings
Delivery to Remote Servers
7.13 Ratings
00 Ratings
Data Discovery and Visualization
Comparison of Data Discovery and Visualization features of Databox and Whatagraph
I believe Databox can be an asset for any company. We are a small company, but I can see the value for large companies too. Databox is a great fit for departments or organizations that need to put their data into a readable form without needing a ton of reports. Databox allows you to save time and put together a nice report without having to do too much extra work. Once it is set up, it basically runs on its own at the frequency you set. I personally receive a daily report and have it sent to the respective people on the day of our meeting so we can quickly review it.
A de minimis incentive was given to thank the reviewer for their time. The incentive was not used to bias or drive a particular response, nor was the incentive contingent on a positive endorsement. More Info
Whatagraph is especially important and useful for client-facing reports, as well as internal optimizations and monitoring. Some of the data/widgets/AI don't reliably use the context I give them when generating reports, so that could be improved.
A de minimis incentive was given to thank the reviewer for their time. The incentive was not used to bias or drive a particular response, nor was the incentive contingent on a positive endorsement. More Info
A de minimis incentive was given to thank the reviewer for their time. The incentive was not used to bias or drive a particular response, nor was the incentive contingent on a positive endorsement. More Info
A de minimis incentive was given to thank the reviewer for their time. The incentive was not used to bias or drive a particular response, nor was the incentive contingent on a positive endorsement. More Info
Some types of data can only be reported on for 1-2 months back. Unless I'm misunderstanding the function of the software this seems really weird. I can't figure out how to report on Activities more than 2 months ago
A de minimis incentive was given to thank the reviewer for their time. The incentive was not used to bias or drive a particular response, nor was the incentive contingent on a positive endorsement. More Info
Databox is an intuitive, well-designed platform that can be used by non-technical marketers. It is easy to learn, and while set up takes time, usability is high and the team has enjoyed creating custom dashboards and clients have also given us great feedback regarding its usability and value. While other BI tools are much more complex to navigate, Databox is a breeze.
A de minimis incentive was given to thank the reviewer for their time. The incentive was not used to bias or drive a particular response, nor was the incentive contingent on a positive endorsement. More Info
I think anyone in digital marketing can use this platform to find good basic information. It's accessible for someone like me, who's looking for deep dives more often than not, but anyone with time can use it easily.
A de minimis incentive was given to thank the reviewer for their time. The incentive was not used to bias or drive a particular response, nor was the incentive contingent on a positive endorsement. More Info
I have really enjoyed using Databox and have seen the value of it in many ways. They also continue to improve the functions of it and grow their integrations and templates. I look forward to continuing to use Databox in the future, potentially even finding ways to incorporate it into other departments to help them with reporting as well.
A de minimis incentive was given to thank the reviewer for their time. The incentive was not used to bias or drive a particular response, nor was the incentive contingent on a positive endorsement. More Info
Databox is unique in its ability to report from multiple data sources. Google Analytics is the standard when it comes to web metrics, but it's just one of the tools that integrates with Databox. Tableau is fantastic for data visualizations and reporting, but it's much more expensive than Databox, so it's not ideal for everyone. Tableau is also superior with customization
A de minimis incentive was given to thank the reviewer for their time. The incentive was not used to bias or drive a particular response, nor was the incentive contingent on a positive endorsement. More Info
A de minimis incentive was given to thank the reviewer for their time. The incentive was not used to bias or drive a particular response, nor was the incentive contingent on a positive endorsement. More Info
I save so much time on monthly reporting using Whatagraph + ChatGPT. Like 30 hours a month, at least.
Sometimes adjusting filters on already-built reports takes time because EACH filter must be adjusted per widget, rather than changing one shared filter.
A de minimis incentive was given to thank the reviewer for their time. The incentive was not used to bias or drive a particular response, nor was the incentive contingent on a positive endorsement. More Info