Datadog is a monitoring service for IT, Dev and Ops teams who write and run applications at scale, and want to turn the massive amounts of data produced by their apps, tools and services into actionable insight.
$18
per month per host
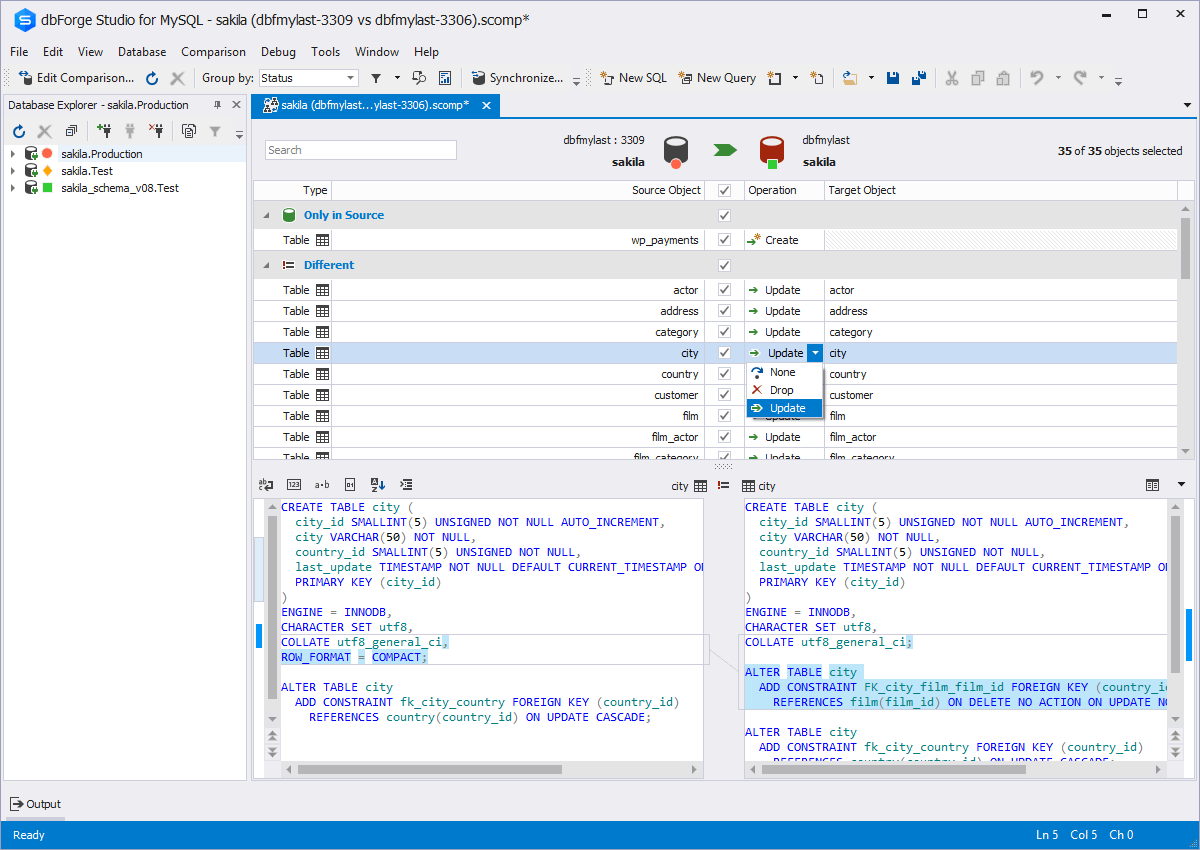
dbForge Studio (Edge)
Score 8.0 out of 10
N/A
dbForge Studio is provided by
Devart and is a universal front-end client for database
management, administration and development. Devart's GUI tool provides
utilities to compare, synchronize, and back up databases (e.g. MySQL, Oracle, SQL Server, PostgreSQL, etc.) with scheduling,
and includes the possibility to analyze and report MySQL tables data. For example, dbForge
Studio for MySQL works with any MariaDB database servers, and supports all
MariaDB objects types. This solution enables users…
$9.95
per month
Pricing
Datadog
dbForge Studio (Edge)
Editions & Modules
Log Management
$1.27
per month (billed annually) per host
Infrastructure
$15.00
per month (billed annually) per host
Standard
$18
per month per host
Enterprise
$27
per month per host
DevSecOps Pro
$27
per month per host
APM
$31.00
per month (billed annually) per host
DevSecOps Enterprise
$41
per month per host
Standard (subcription)
$9.95
per month
Professional (subscription)
$19.95
per month
Enterprise (subscription)
$29.95
per month
Standard (subcription)
$99.95
per year
Professional (subscription)
$179.95
per year
Standard
$199.95
Enterprise (subscription)
$229.95
per year
Professional
$349.95
Enterprise
$449.95
Offerings
Pricing Offerings
Datadog
dbForge Studio (Edge)
Free Trial
Yes
Yes
Free/Freemium Version
Yes
Yes
Premium Consulting/Integration Services
No
Yes
Entry-level Setup Fee
Optional
No setup fee
Additional Details
Discount available for annual pricing. Multi-Year/Volume discounts available (500+ hosts/mo).
Datadog may be better suited for teams that have a more out-of-the-box infrastructure, on the primary platforms Datadog supports. You may also have better results if you have a bigger team dedicated to devops and/or a bigger budget. We found that trying to adapt it to our use case (small team, .NET on AWS Fargate) wasn't feasible. We continually ran into roadblocks that required us to dig through documentation (and at times, having to figure out some documentation was wrong), go back and forth with support, and in my opinion, waste money on excessive and unintended usages due to opaque pricing models and inaccurate usage reports, as well as broken/non-functional rate sampling controls.
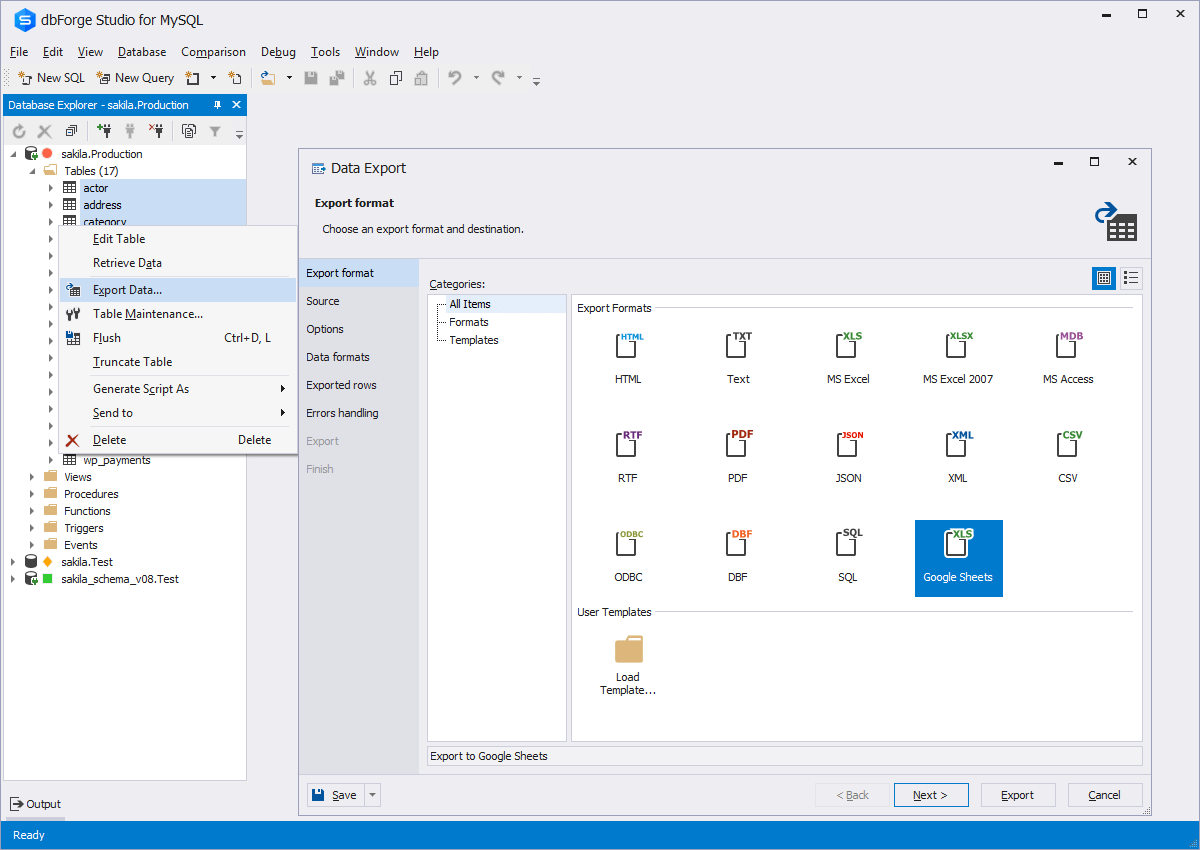
This tool is useful for small and large IT departments and associated data analysts that perform direct database functions such as DBA tasks or extracting/importing data. Non-technical staff members would not benefit from this tool as much as the functions are detailed and technical. However, automation engineers will find this tool very open for automation, and can generate the scripting code for any of its functions.
The thing which Datadog does really well, one of them are its broad range of services integrations and features which makes it one step observability solution for all. We can monitor all types of our application, infrastructure, hosts, databases etc with Datadog.
Its custom dashboard feature which helps us to visualize the data in a better way . It supports different types of charts through those charts we can create our dashboard more attractive.
Its AI powered alerting capability though that we can easily identify the root cause and also it has a low noise alerting capability which means it correlated the similar type of issues.
Alert windows cause lag in notifications (e.g. if the alert window is X errors in 1 hour, we won't get alerted until the end of the 1 hour range)
I would appreciate more supportive examples for how to filter and view metrics in the explorer
I would like a more clear interface for metrics that are missing in a time frame, rather than only showing tags/etc. for metrics that were collected within the currently viewed time frame
The ability to parameterize searches more would be advantageous. For example, being able to specify to only look for certain columns, certain data type changes, etc.
The output reports from dbForge are very plain and could contain more detail, and perhaps be structured more like a pivot table form Excel
There are so many features that it can be hard to figure out where you need to go for your own use case. For example, RUM monitoring us buried in a "Digital Experience" sidebar setting when this is one of our key use cases that I sometimes struggle to find in the application. It appears that ECS + Fargate monitoring was recently released which is great because we had to build a lambda reporting solution for ephemeral task monitoring. But this new feature was never on my radar until I starting clicking around the application.
dbForge Studio (Edge) has a great UI and it's versatile, but it still has some glitches. Its multiple database support makes it possible to stick with only one UI to handle different RDBM systems, even though you have to redefine user credentials for each new connection (no copying/cloning feature for database connections). The Edit View and diagramming features also could be improved.
The support team usually gets it right. We did have a rather complicate issue setting up monitoring on a domain controller. However, they are usually responsive and helpful over chat. The downside would be I don’t think they have any phone support. If that is important to you this might not be a good fit.
Although experience here is limited, as only one question has been asked and answered promptly, the registration and licensing process was very smooth and professional. There are forums online that discuss dbForge issues, as well as a Facts and Questions section on dbForge's website, so product support does seem to exist if needed.
Our logs are very important, and Datadog manages them exceptionally well. We frequently use Datadog services for our investigations. Use case: Monitor your apps, infrastructure, APIs, and user experience.
Key features:
Logs, metrics, and APM (Application Performance Monitoring)
Real-time alerting and dashboards
Supports Kubernetes, AWS, GCP, and other integrations
RUM (Real User Monitoring) and Synthetics
✅ Best for backend, server, and distributed systems monitoring.
Before choosing dbForge Studio I evaluated at least a dozen tools, especially on the Visual Query Builder function. For now, I have identified only one product that has a better Visual Query Builder than dbForge Studio. This other product also manages UNIONs, while dbStudio still doesn't do it visually. However, the better alternative product is enormously slower in operations and less feature-rich than DbForge Studio