Datadog is a monitoring service for IT, Dev and Ops teams who write and run applications at scale, and want to turn the massive amounts of data produced by their apps, tools and services into actionable insight.
$18
per month per host
NetApp Cloud Insights
Score 9.2 out of 10
N/A
NetApp Cloud Insights is an infrastructure monitoring tool that gives
users visibility into their complete infrastructure. With Cloud Insights, users can monitor, troubleshoot and optimize all resources including
public clouds and private data centers.
N/A
Pricing
Datadog
NetApp Cloud Insights
Editions & Modules
Log Management
$1.27
per month (billed annually) per host
Infrastructure
$15.00
per month (billed annually) per host
Standard
$18
per month per host
Enterprise
$27
per month per host
DevSecOps Pro
$27
per month per host
APM
$31.00
per month (billed annually) per host
DevSecOps Enterprise
$41
per month per host
No answers on this topic
Offerings
Pricing Offerings
Datadog
NetApp Cloud Insights
Free Trial
Yes
Yes
Free/Freemium Version
Yes
Yes
Premium Consulting/Integration Services
No
Yes
Entry-level Setup Fee
Optional
Optional
Additional Details
Discount available for annual pricing. Multi-Year/Volume discounts available (500+ hosts/mo).
Cloud Insights is a very compact service compared to others. This is very compatible with the service selection policy suitable for the purpose. So you really pay for the part of the product you need, which increases your financial efficiency and lowers start-up costs (time to …
Easy to install data collectors; the main focus of the product is multi-vendor cloud technology systems. Easy-to-use dashboards with widely supported features, which can be easily used in a WYSIWYG-manner. The NetApp data collector uses Telegraf as a way to integrate data from …
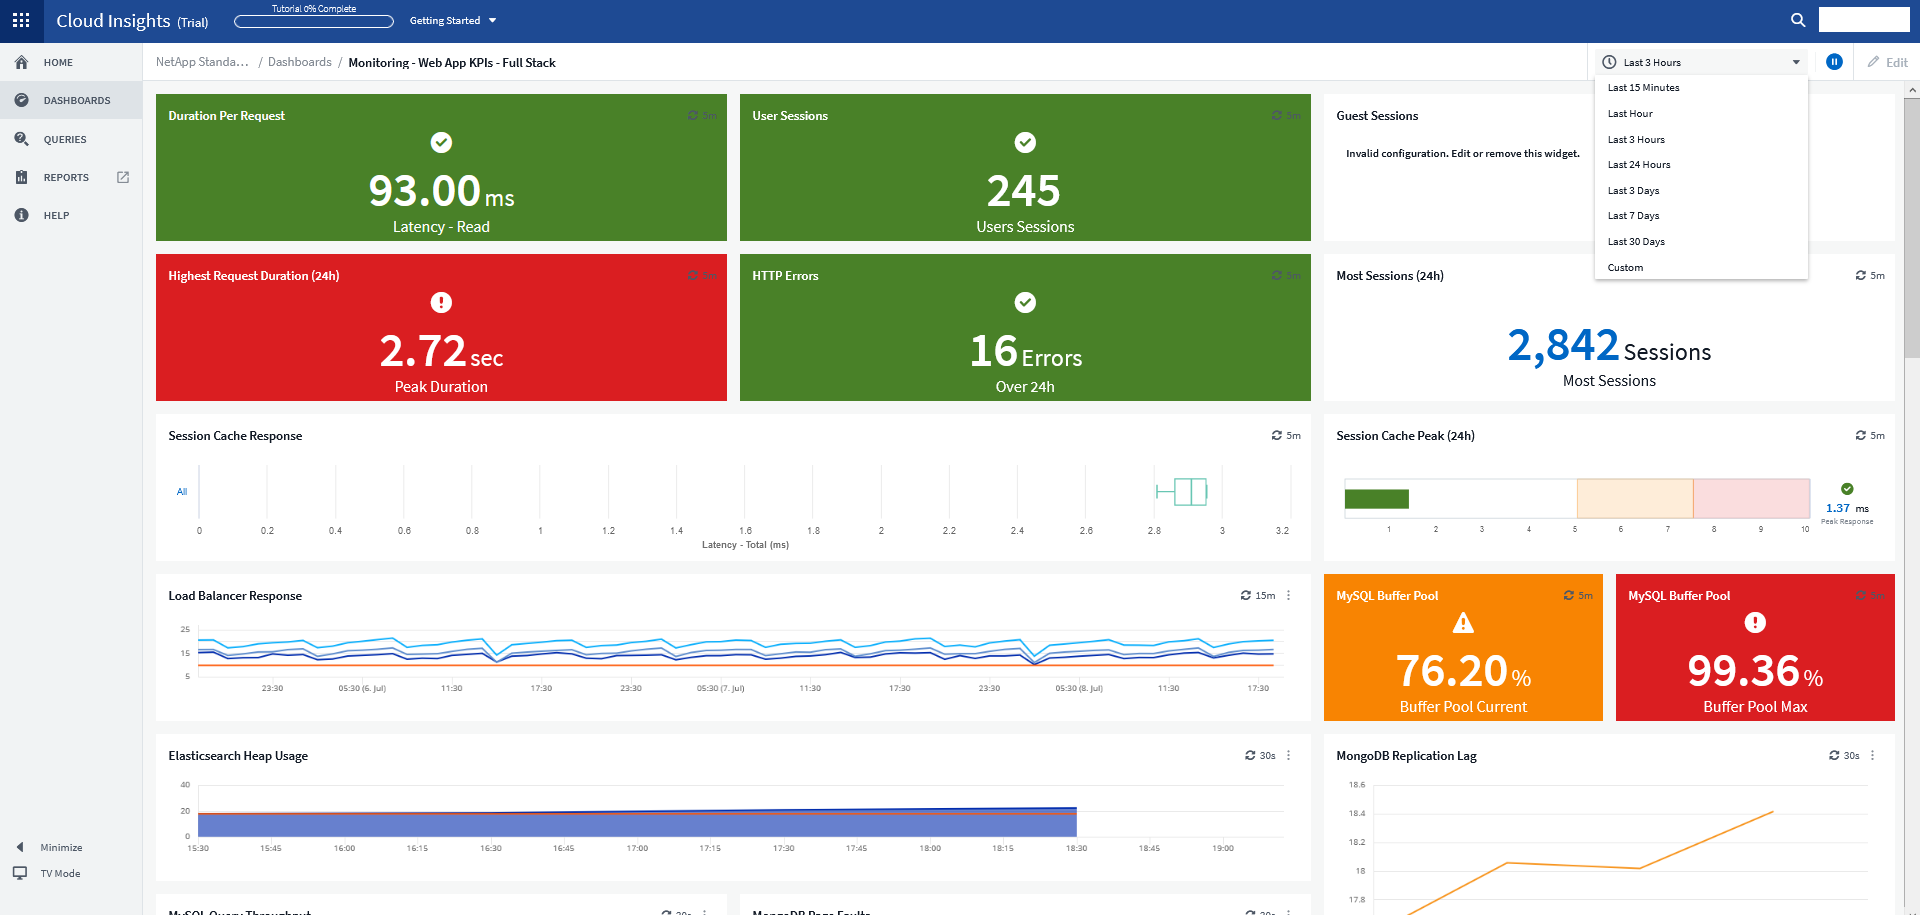
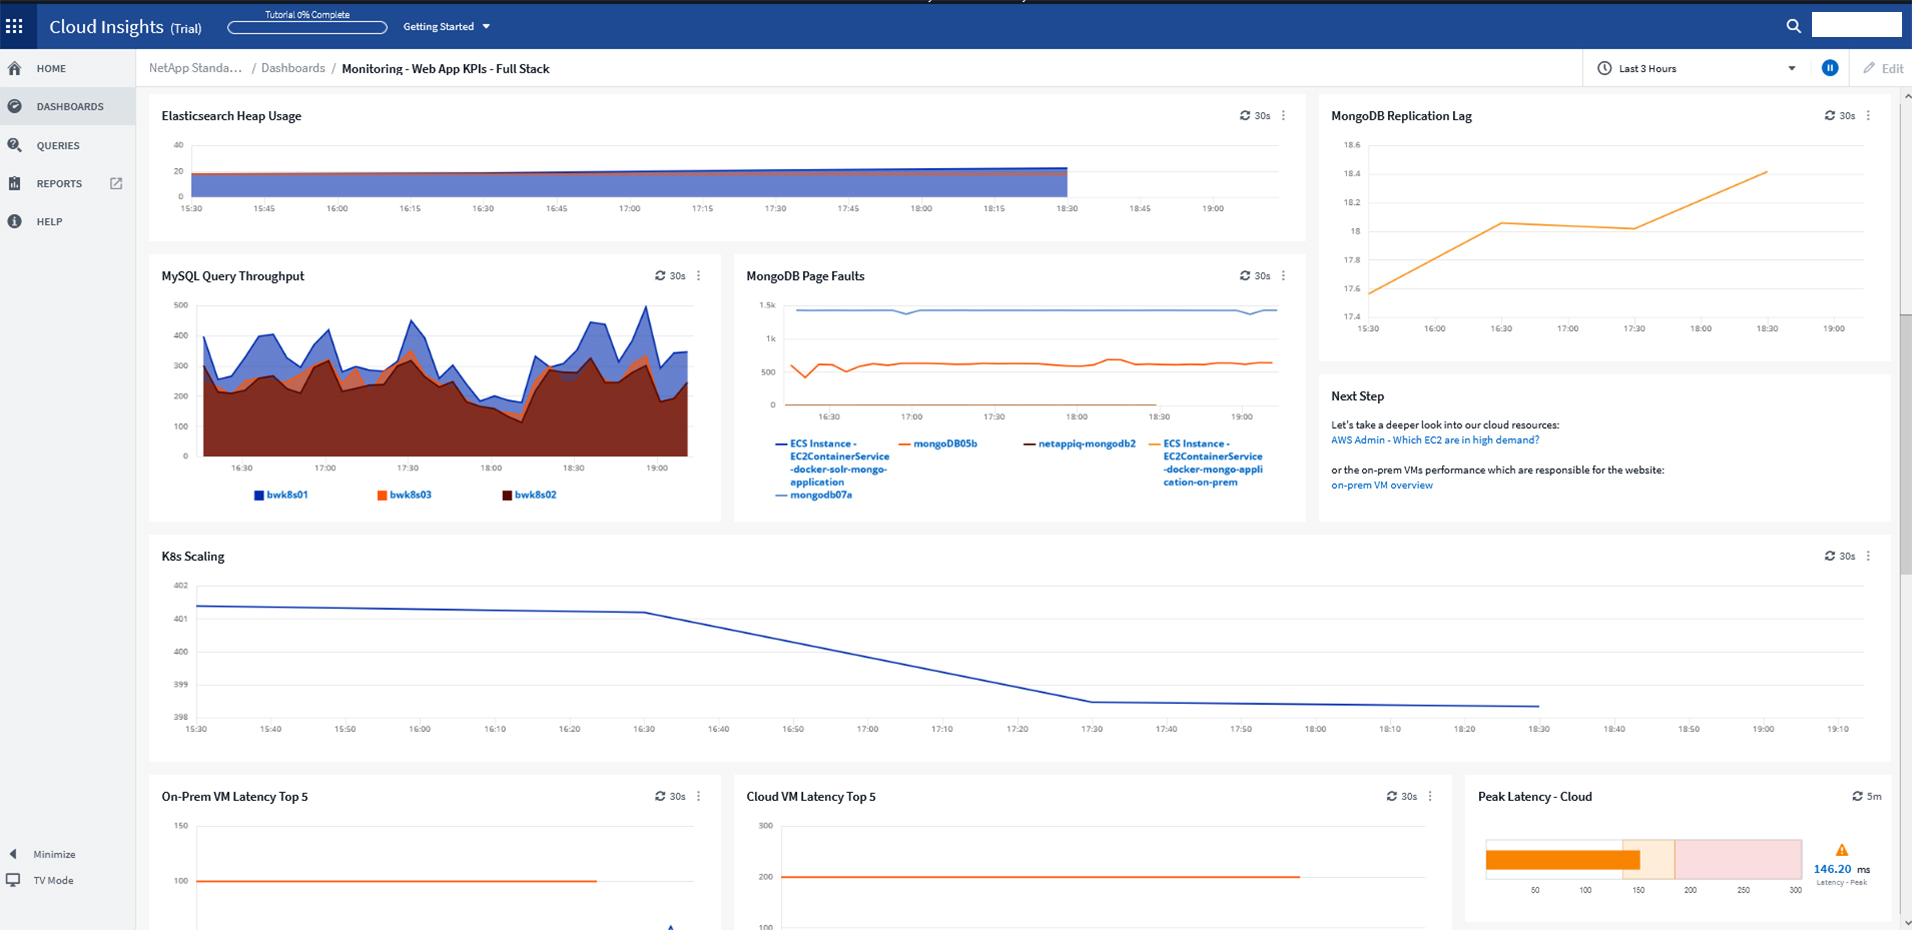
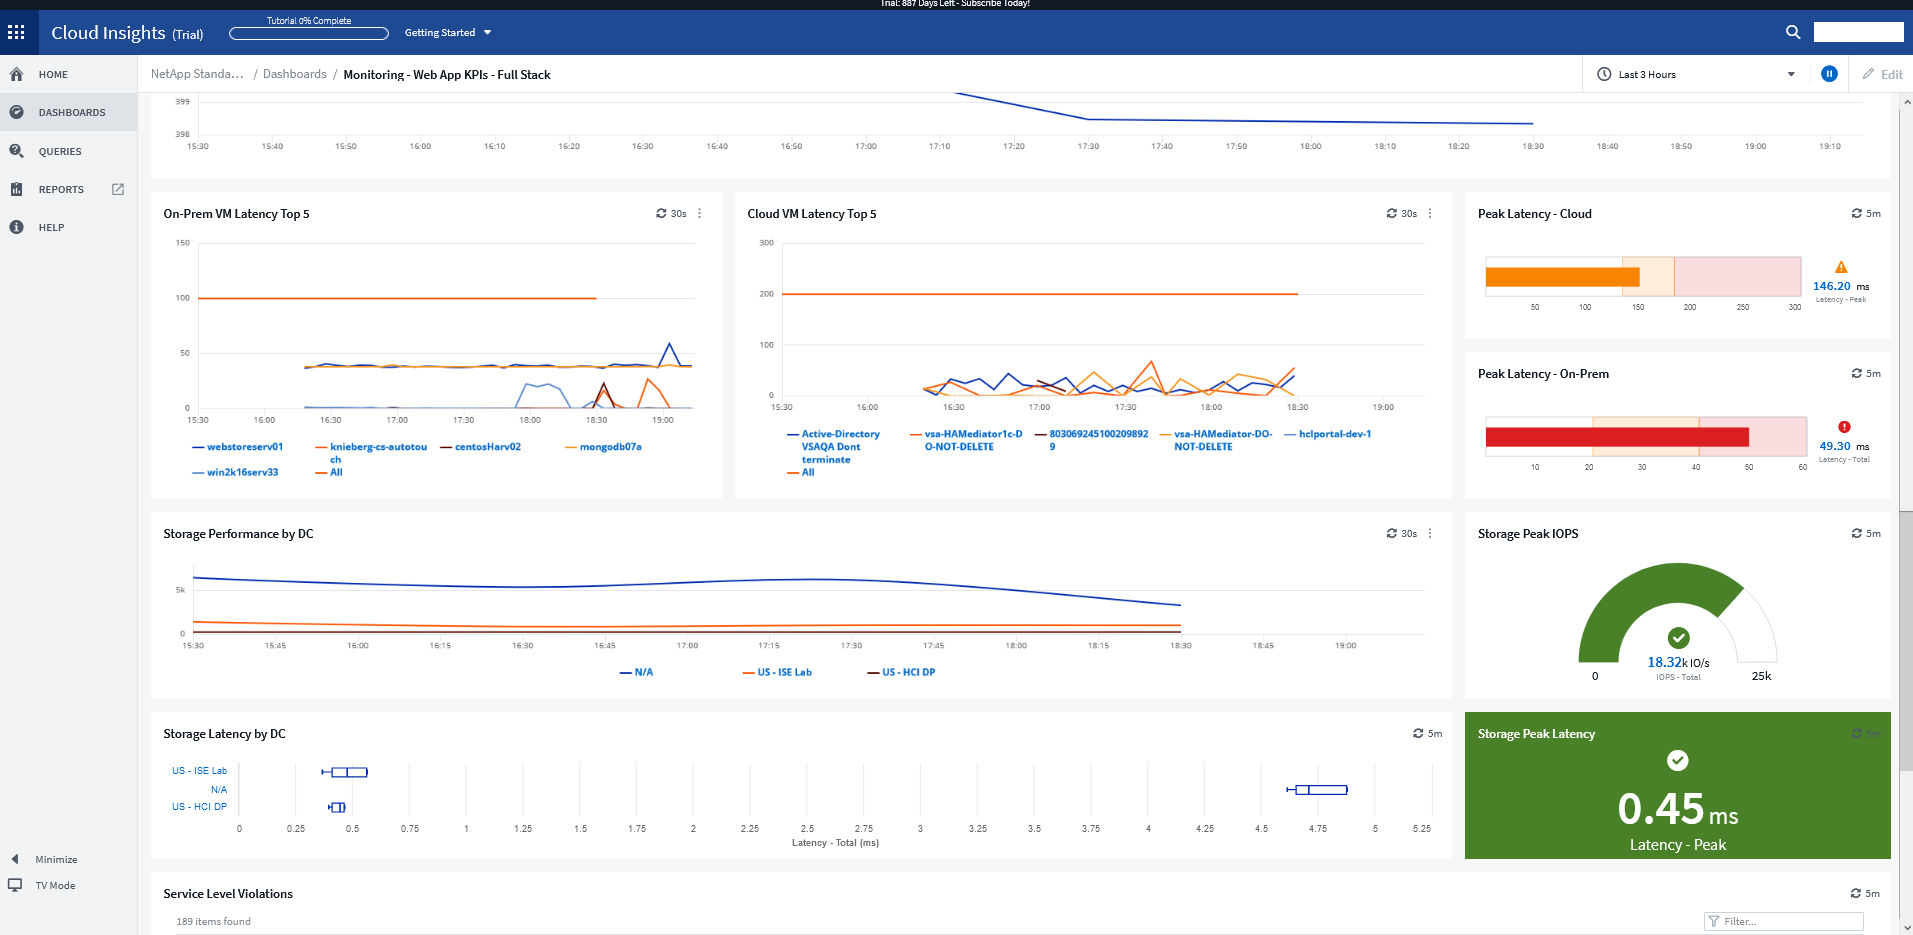
Cloud Insights allows us to create custom dashboards to monitor and trend any aspect of their infrastructure including CPU, memory, storage network utilization, IOPS, capacity utilization and more. Cloud Insights also provides visibility into the inter-connectivity of the …
Datadog may be better suited for teams that have a more out-of-the-box infrastructure, on the primary platforms Datadog supports. You may also have better results if you have a bigger team dedicated to devops and/or a bigger budget. We found that trying to adapt it to our use case (small team, .NET on AWS Fargate) wasn't feasible. We continually ran into roadblocks that required us to dig through documentation (and at times, having to figure out some documentation was wrong), go back and forth with support, and in my opinion, waste money on excessive and unintended usages due to opaque pricing models and inaccurate usage reports, as well as broken/non-functional rate sampling controls.
For example, we had an application slowdown. It looked like the slowdown was storage. However, it was a malformed SQL query that no one realized was pulling data from the storage location that also housed the application. Cloud Insights saved us hours of downtime and frustration. Cloud Insights pinpointed which system was hogging resources. What makes Cloud Insights special is the way it looks at the data collected from the data sources. The insights it provides into the flow of data; sheds new light on how things work in your environment.
The thing which Datadog does really well, one of them are its broad range of services integrations and features which makes it one step observability solution for all. We can monitor all types of our application, infrastructure, hosts, databases etc with Datadog.
Its custom dashboard feature which helps us to visualize the data in a better way . It supports different types of charts through those charts we can create our dashboard more attractive.
Its AI powered alerting capability though that we can easily identify the root cause and also it has a low noise alerting capability which means it correlated the similar type of issues.
Alert windows cause lag in notifications (e.g. if the alert window is X errors in 1 hour, we won't get alerted until the end of the 1 hour range)
I would appreciate more supportive examples for how to filter and view metrics in the explorer
I would like a more clear interface for metrics that are missing in a time frame, rather than only showing tags/etc. for metrics that were collected within the currently viewed time frame
There are so many features that it can be hard to figure out where you need to go for your own use case. For example, RUM monitoring us buried in a "Digital Experience" sidebar setting when this is one of our key use cases that I sometimes struggle to find in the application. It appears that ECS + Fargate monitoring was recently released which is great because we had to build a lambda reporting solution for ephemeral task monitoring. But this new feature was never on my radar until I starting clicking around the application.
I have been extremely happy with its usability. You can take thins as they are out of the box and it is useful. You can carry it as far as you want to go and every step you take improves your ROI.
The support team usually gets it right. We did have a rather complicate issue setting up monitoring on a domain controller. However, they are usually responsive and helpful over chat. The downside would be I don’t think they have any phone support. If that is important to you this might not be a good fit.
Our logs are very important, and Datadog manages them exceptionally well. We frequently use Datadog services for our investigations. Use case: Monitor your apps, infrastructure, APIs, and user experience.
Key features:
Logs, metrics, and APM (Application Performance Monitoring)
Real-time alerting and dashboards
Supports Kubernetes, AWS, GCP, and other integrations
RUM (Real User Monitoring) and Synthetics
✅ Best for backend, server, and distributed systems monitoring.
For a while, we were using Zabbix to monitor our Kubernetes applications and microservices on our infrastructure in more than one public cloud platform. Cloud Insights has much better visualized dashboards. In addition, despite such a large number of quality features, it's still priced competitively.
Once you install the acquisition unit and start collecting data, you can immediately begin using it. It is very self-explanatory and helpful. I could have used Cloud Insights without working with the NetApp Cloud Insights support team. I am glad I engaged them though. They helped me carry Cloud Insights to a new level and it fast-tracked the process that would have taken me time to complete.