Datadog is a monitoring service for IT, Dev and Ops teams who write and run applications at scale, and want to turn the massive amounts of data produced by their apps, tools and services into actionable insight.
$18
per month per host
Opsview Monitor
Score 6.0 out of 10
N/A
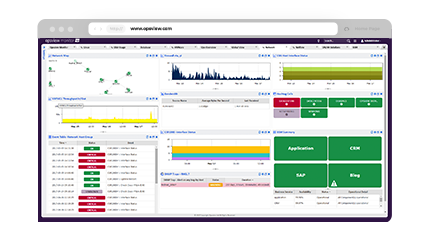
Opsview Monitor is an IT infrastructure and application monitoring solution. It monitors the infrastructure, applications, and endpoints of a network, and supports add-ons for automation and data exporting. Opsview also offers a free version of Monitor.
N/A
Pricing
Datadog
Opsview Monitor
Editions & Modules
Log Management
$1.27
per month (billed annually) per host
Infrastructure
$15.00
per month (billed annually) per host
Standard
$18
per month per host
Enterprise
$27
per month per host
DevSecOps Pro
$27
per month per host
APM
$31.00
per month (billed annually) per host
DevSecOps Enterprise
$41
per month per host
No answers on this topic
Offerings
Pricing Offerings
Datadog
Opsview Monitor
Free Trial
Yes
Yes
Free/Freemium Version
Yes
Yes
Premium Consulting/Integration Services
No
Yes
Entry-level Setup Fee
Optional
Optional
Additional Details
Discount available for annual pricing. Multi-Year/Volume discounts available (500+ hosts/mo).
I am listing how Datadog is better than below chosen NotSensu - Datadog has more integrations and easy to use UI. Prometheus - Datadog Integration are more in number than, simple installation process
As per my experience, Datadog is best suited for complex, cloud-native environments where unified observability is critical, as it integrates seamlessly with AWS and Azure. Moreover, it provides deep visibility into latency and error rates. Datadog pricing is less appropriate for Startups with a tight budget and for organizations needing advanced incident management.
If you know Nagios or Nagios-like monitoring systems, OpsView will be really easy for you to learn and manage. Migrations process will be relatively easy. You're getting great U/I that will speed up adding new objects to the system and present data in a clear, organized way. In addition it's easy to create dedicated dashboards for your clients.
The thing which Datadog does really well, one of them are its broad range of services integrations and features which makes it one step observability solution for all. We can monitor all types of our application, infrastructure, hosts, databases etc with Datadog.
Its custom dashboard feature which helps us to visualize the data in a better way . It supports different types of charts through those charts we can create our dashboard more attractive.
Its AI powered alerting capability though that we can easily identify the root cause and also it has a low noise alerting capability which means it correlated the similar type of issues.
There are so many features that it can be hard to figure out where you need to go for your own use case. For example, RUM monitoring us buried in a "Digital Experience" sidebar setting when this is one of our key use cases that I sometimes struggle to find in the application. It appears that ECS + Fargate monitoring was recently released which is great because we had to build a lambda reporting solution for ephemeral task monitoring. But this new feature was never on my radar until I starting clicking around the application.
The support team usually gets it right. We did have a rather complicate issue setting up monitoring on a domain controller. However, they are usually responsive and helpful over chat. The downside would be I don’t think they have any phone support. If that is important to you this might not be a good fit.
Our logs are very important, and Datadog manages them exceptionally well. We frequently use Datadog services for our investigations. Use case: Monitor your apps, infrastructure, APIs, and user experience.
Key features:
Logs, metrics, and APM (Application Performance Monitoring)
Real-time alerting and dashboards
Supports Kubernetes, AWS, GCP, and other integrations
RUM (Real User Monitoring) and Synthetics
✅ Best for backend, server, and distributed systems monitoring.