Chose Datadog
Its the Enterprise level decision, definitely usability and features perspective Datadog is much more advanced.
| Product | Rating | Most Used By | Product Summary | Starting Price |
|---|---|---|---|---|
 Datadog | N/A | Datadog is a monitoring service for IT, Dev and Ops teams who write and run applications at scale, and want to turn the massive amounts of data produced by their apps, tools and services into actionable insight. | $1.27 per month (billed annually) per host | |
 SolarWinds Security Event Manager (SEM) | N/A | SolarWinds LEM is security information and event management (SIEM) software. | N/A |
| Datadog | SolarWinds Security Event Manager (SEM) | |||||||||||||||
|---|---|---|---|---|---|---|---|---|---|---|---|---|---|---|---|---|
| Editions & Modules |
| No answers on this topic | ||||||||||||||
| Offerings |
| |||||||||||||||
| Entry-level Setup Fee | Optional | No setup fee | ||||||||||||||
| Additional Details | Discount available for annual pricing. Multi-Year/Volume discounts available (500+ hosts/mo). | — | ||||||||||||||
| More Pricing Information | ||||||||||||||||
| Datadog | SolarWinds Security Event Manager (SEM) | |
|---|---|---|
| Considered Both Products |  Datadog  Jeffrey van Santen Sr SWE Chose Datadog Datadog is a more complex but complete solution than any of the other Log Aggregation, monitoring, or general observabilty tools that we have trialed. I found it easier to setup following useful and up-to-date documentation provided directly by Datadog instead of scattered …  Vinit Parakh Sr. DevOps Engineer Chose Datadog First think first - it's easy to use, and very easy to implement in any infrastructure. It provides a custom dashboard and monitors. I’ve used or evaluated Grafana, Prometheus, Amazon CloudWatch, and Dynatrace, and each tool has strong capabilities. Prometheus + Grafana provide …  Joe Cardali Head of Engineering Chose Datadog Much more modern and advanced  Fernando Battistella DevOps Engineer Chose Datadog ease of use and implementation, other than new relic (which I think is terrible in every possible way), the other two support opentelemetry better, have more manageable costs and comparable basic services, but they do not have the breadt of services dd does. |  SolarWinds Security Event Manager (SEM)  Tim Short Infrastructure Administrator Chose SolarWinds Security Event Manager (SEM) We picked SolarWinds because of the better price point, integration with other SolarWinds products, and the ease of training. Because we were already familiar with the SolarWinds way of doing alerts and reports, it made this product a nice fit for our company and it has great …  Brandon Demko Systems Administrator Chose SolarWinds Security Event Manager (SEM) We had an older version of SolarWinds SEM, however, it was not being utilized. |
| Datadog | SolarWinds Security Event Manager (SEM) | ||||||||||||||||||||||||
|---|---|---|---|---|---|---|---|---|---|---|---|---|---|---|---|---|---|---|---|---|---|---|---|---|---|
| Security Information and Event Management (SIEM) |
|
| Datadog | SolarWinds Security Event Manager (SEM) | |
|---|---|---|
| Small Businesses |  Amazon CloudWatch Score 7.7 out of 10 |  LevelBlue USM Anywhere Score 8.0 out of 10 |
| Medium-sized Companies |  ManageEngine Site24x7 Score 10.0 out of 10 |  Sumo Logic Score 8.8 out of 10 |
| Enterprises | ManageEngine Site24x7 Score 10.0 out of 10 | Sumo Logic Score 8.8 out of 10 |
| All Alternatives | View all alternatives | View all alternatives |
| Datadog | SolarWinds Security Event Manager (SEM) | |
|---|---|---|
| Likelihood to Recommend | 8.9 (0 ratings) | 8.0 (0 ratings) |
| Likelihood to Renew | 1.0 (0 ratings) | 7.3 (0 ratings) |
| Usability | 8.7 (0 ratings) | 8.0 (0 ratings) |
| Support Rating | 5.0 (0 ratings) | 7.5 (0 ratings) |
| Implementation Rating | 1.0 (0 ratings) | - (0 ratings) |
| Datadog | SolarWinds Security Event Manager (SEM) | |
|---|---|---|
| Likelihood to Recommend |
|
|
| Pros |
 Aman Makwana DevOps Engineer |
 Adam Morrison Director of IT Engineering |
| Cons |
|
|
| Likelihood to Renew |
|
|
| Usability |
|
|
| Support Rating |
|
Brandon Demko Systems Administrator |
| Implementation Rating |
| No answers on this topic |
| Alternatives Considered |
Jeffrey van Santen Sr SWE |
|
| Return on Investment |
|
|
| ScreenShots | Datadog Screenshots      | SolarWinds Security Event Manager (SEM) Screenshots 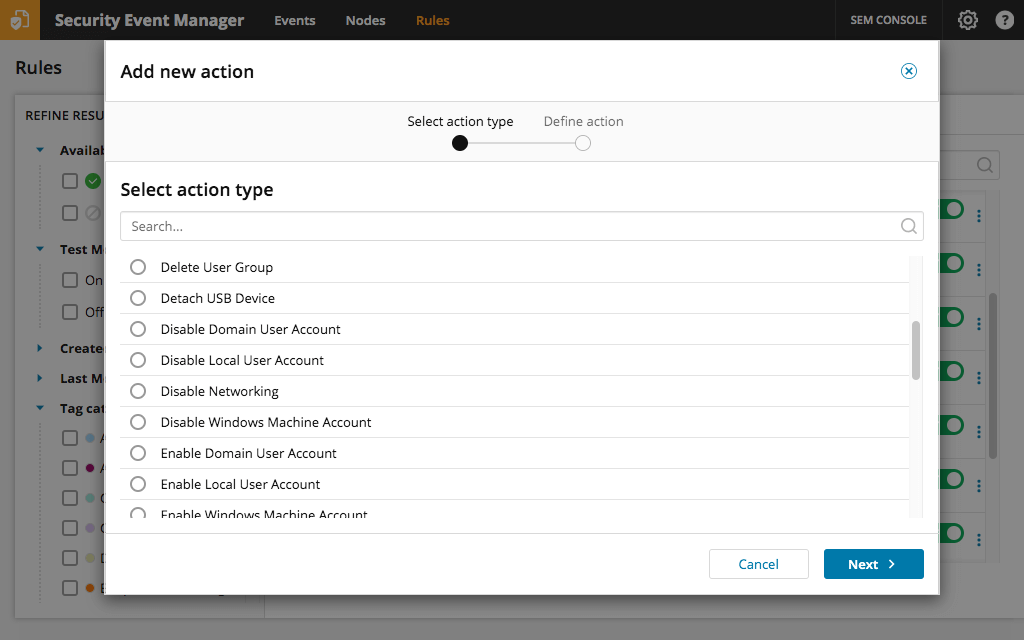   |