Devart Excel Add-ins vs. Tableau Desktop

Overview
ProductRatingMost Used ByProduct SummaryStarting Price
Devart Excel Add-ins
Score 9.4 out of 10
N/A
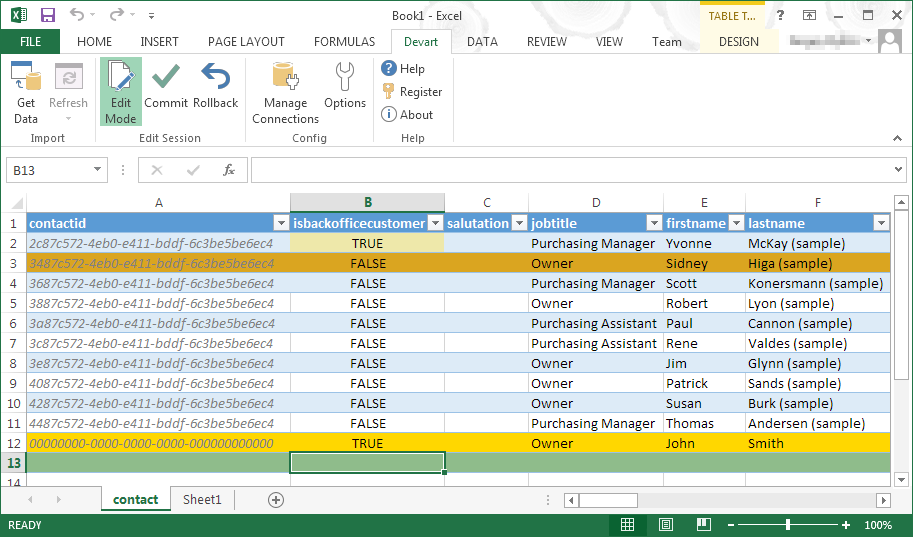
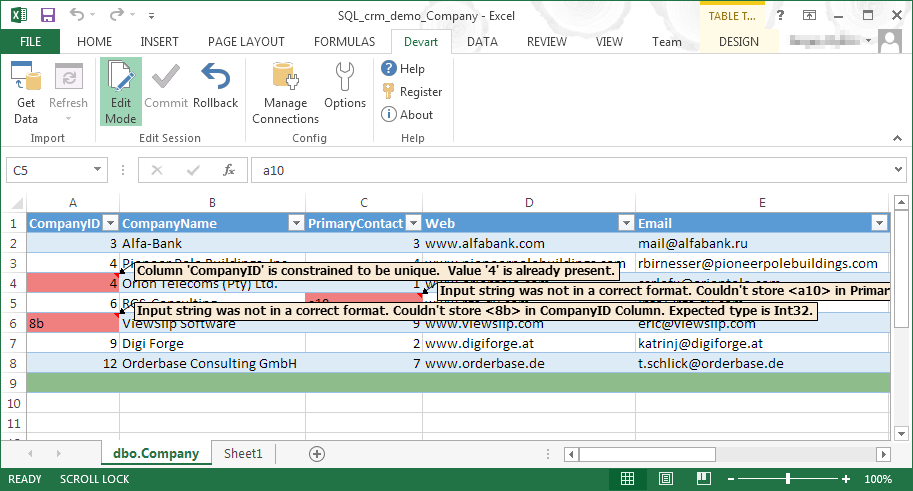
Devart Excel Add-ins allow you to use Excel capabilities to import, process, and analyze data from cloud applications and relational databases. The Excel Add-ins also allow users to make data changes and then save those changes back to the data source they were originally imported from.
$399.95
one-time fee
Tableau Desktop
Score 8.5 out of 10
N/A
Tableau Desktop is a data visualization product from Tableau. It connects to a variety of data sources for combining disparate data sources without coding. It provides tools for discovering patterns and insights, data calculations, forecasts, and statistical summaries and visual storytelling.
$1,380
per year (purchased via a Creator license)
Pricing
Devart Excel Add-insTableau Desktop
Editions & Modules
Excel Add-in Database Pack
$399.95
one-time fee
Excel Add-in Cloud Pack
$499.95
one-time fee
Excel Add-in Universal Pack
$599.95
one-time fee
Tableau Creator License
$115
per month (billed annually) per user
Offerings
Pricing Offerings
Devart Excel Add-insTableau Desktop
Free Trial
YesNo
Free/Freemium Version
NoYes
Premium Consulting/Integration Services
NoYes
Entry-level Setup FeeNo setup feeNo setup fee
Additional DetailsPurchases include a perpetual license and 1 year of subscription which includes the product updates and premium support.All pricing plans are billed annually. A Creator license includes Tableau Desktop, Tableau Prep Builder, and Tableau Pulse. Discounts sometimes available for volume.
More Pricing Information
Community Pulse
Devart Excel Add-insTableau Desktop
Features
Devart Excel Add-insTableau Desktop
Data Source Connection
Comparison of Data Source Connection features of Product A and Product B
Devart Excel Add-ins
8.5
1 Ratings
2% above category average
Tableau Desktop
-
Ratings
Connect to traditional data sources8.01 Ratings00 Ratings
Connecto to Big Data and NoSQL9.01 Ratings00 Ratings
Data Transformations
Comparison of Data Transformations features of Product A and Product B
Devart Excel Add-ins
7.0
1 Ratings
14% below category average
Tableau Desktop
-
Ratings
Simple transformations8.01 Ratings00 Ratings
Complex transformations6.01 Ratings00 Ratings
Data Modeling
Comparison of Data Modeling features of Product A and Product B
Devart Excel Add-ins
8.6
1 Ratings
9% above category average
Tableau Desktop
-
Ratings
Data model creation10.01 Ratings00 Ratings
Metadata management9.01 Ratings00 Ratings
Business rules and workflow8.01 Ratings00 Ratings
Collaboration9.01 Ratings00 Ratings
Testing and debugging7.01 Ratings00 Ratings
Data Governance
Comparison of Data Governance features of Product A and Product B
Devart Excel Add-ins
8.5
1 Ratings
6% above category average
Tableau Desktop
-
Ratings
Integration with data quality tools8.01 Ratings00 Ratings
Integration with MDM tools9.01 Ratings00 Ratings
BI Standard Reporting
Comparison of BI Standard Reporting features of Product A and Product B
Devart Excel Add-ins
-
Ratings
Tableau Desktop
8.4
175 Ratings
3% above category average
Pixel Perfect reports00 Ratings8.0145 Ratings
Customizable dashboards00 Ratings9.2174 Ratings
Report Formatting Templates00 Ratings8.1151 Ratings
Ad-hoc Reporting
Comparison of Ad-hoc Reporting features of Product A and Product B
Devart Excel Add-ins
-
Ratings
Tableau Desktop
8.4
172 Ratings
5% above category average
Drill-down analysis00 Ratings8.6167 Ratings
Formatting capabilities00 Ratings8.5170 Ratings
Integration with R or other statistical packages00 Ratings8.1126 Ratings
Report sharing and collaboration00 Ratings8.6165 Ratings
Report Output and Scheduling
Comparison of Report Output and Scheduling features of Product A and Product B
Devart Excel Add-ins
-
Ratings
Tableau Desktop
8.4
166 Ratings
2% above category average
Publish to Web00 Ratings8.1155 Ratings
Publish to PDF00 Ratings8.1154 Ratings
Report Versioning00 Ratings8.5120 Ratings
Report Delivery Scheduling00 Ratings8.6128 Ratings
Delivery to Remote Servers00 Ratings8.978 Ratings
Data Discovery and Visualization
Comparison of Data Discovery and Visualization features of Product A and Product B
Devart Excel Add-ins
-
Ratings
Tableau Desktop
8.4
164 Ratings
5% above category average
Pre-built visualization formats (heatmaps, scatter plots etc.)00 Ratings8.6162 Ratings
Location Analytics / Geographic Visualization00 Ratings8.6156 Ratings
Predictive Analytics00 Ratings8.7131 Ratings
Pattern Recognition and Data Mining00 Ratings7.77 Ratings
Access Control and Security
Comparison of Access Control and Security features of Product A and Product B
Devart Excel Add-ins
-
Ratings
Tableau Desktop
9.1
149 Ratings
7% above category average
Multi-User Support (named login)00 Ratings9.1145 Ratings
Role-Based Security Model00 Ratings9.1125 Ratings
Multiple Access Permission Levels (Create, Read, Delete)00 Ratings8.8136 Ratings
Report-Level Access Control00 Ratings9.110 Ratings
Single Sign-On (SSO)00 Ratings9.383 Ratings
Mobile Capabilities
Comparison of Mobile Capabilities features of Product A and Product B
Devart Excel Add-ins
-
Ratings
Tableau Desktop
7.9
141 Ratings
2% above category average
Responsive Design for Web Access00 Ratings8.6130 Ratings
Mobile Application00 Ratings7.5101 Ratings
Dashboard / Report / Visualization Interactivity on Mobile00 Ratings7.4122 Ratings
Application Program Interfaces (APIs) / Embedding
Comparison of Application Program Interfaces (APIs) / Embedding features of Product A and Product B
Devart Excel Add-ins
-
Ratings
Tableau Desktop
7.7
67 Ratings
1% below category average
REST API00 Ratings8.359 Ratings
Javascript API00 Ratings7.653 Ratings
iFrames00 Ratings6.751 Ratings
Java API00 Ratings8.148 Ratings
Themeable User Interface (UI)00 Ratings7.154 Ratings
Customizable Platform (Open Source)00 Ratings8.348 Ratings
Best Alternatives
Devart Excel Add-insTableau Desktop
Small Businesses
Skyvia
Skyvia
Score 10.0 out of 10
Yellowfin
Yellowfin
Score 8.6 out of 10
Medium-sized Companies
IBM InfoSphere Information Server
Score 8.0 out of 10
Reveal
Reveal
Score 10.0 out of 10
Enterprises
IBM InfoSphere Information Server
Score 8.0 out of 10
Kyvos Semantic Layer
Score 9.5 out of 10
All AlternativesView all alternativesView all alternatives
User Ratings
Devart Excel Add-insTableau Desktop
Likelihood to Recommend
9.0
(3 ratings)
9.0
(204 ratings)
Likelihood to Renew
-
(0 ratings)
7.5
(41 ratings)
Usability
9.0
(1 ratings)
8.4
(73 ratings)
Availability
-
(0 ratings)
10.0
(11 ratings)
Performance
-
(0 ratings)
8.0
(10 ratings)
Support Rating
-
(0 ratings)
1.0
(57 ratings)
In-Person Training
-
(0 ratings)
9.4
(4 ratings)
Online Training
-
(0 ratings)
8.0
(5 ratings)
Implementation Rating
-
(0 ratings)
8.0
(34 ratings)
Configurability
-
(0 ratings)
7.0
(3 ratings)
Ease of integration
-
(0 ratings)
10.0
(1 ratings)
Product Scalability
-
(0 ratings)
9.0
(4 ratings)
Vendor post-sale
-
(0 ratings)
10.0
(1 ratings)
Vendor pre-sale
-
(0 ratings)
10.0
(1 ratings)
User Testimonials
Devart Excel Add-insTableau Desktop
Likelihood to Recommend
Devart
For a mid size company it is a perfect tool like IT application companies but if companies having large Data like Banks it is less appropriate
Read full review
Tableau
The best scenario is definitely to collect data from several sources and create dedicated dashboards for specific recipients. However, I miss the possibility of explaining these reports in more detail. Sometimes, we order a report, and after half a year, we don't remember the meaning of some data (I know it's our fault as an organization, but the tool could force better practices).
Read full review
Pros
Devart
  • Source control
  • Unit testing
  • Schema comparisons
Read full review
Tableau
  • An excellent tool for data visualization, it presents information in an appealing visual format—an exceptional platform for storing and analyzing data in any size organization.
  • Through interactive parameters, it enables real-time interaction with the user and is easy to learn and get support from the community.
Read full review
Cons
Devart
  • It has room for improvement in terms of security and making it possible for large organizations like us to use it in a more secure way with integrating with our in-house security systems.
  • Pricing could be reduced further for it to be adopted world-wide.
  • it isn't foolproof. Excel has no means of checking for human error during data entry, which means that the wrong information can skew all the results - sometimes severe.
  • Users unfamiliar with Excel syntax may also find entering calculations and calling up other functions a bit frustrating until they get a solid understanding.
Read full review
Tableau
  • Pricing should be more user-friendly and usage-driven
  • Making edits to the production reports is fairly tough and has a vast scope of additional capabilities
  • Tableau Desktop should be able to differentiate itself from the Tableau server else there is no major meaning of two different products being offered
Read full review
Likelihood to Renew
Devart
No answers on this topic
Tableau
Our use of Tableau Desktop is still fairly low, and will continue over time. The only real concern is around cost of the licenses, and I have mentioned this to Tableau and fully expect the development of more sensible models for our industry. This will remove any impediment to expansion of our use.
Read full review
Usability
Devart
It automated the whole reporting and excel. Our team can generate pivot, dashboards and multiple other reports in various formats and update them with one click. My Sales team need to update more then 1500 leads status on daily basis. By using this tool now they can do this in few minutes.
Read full review
Tableau
Tableau Desktop has proven to be a lifesaver in many situations. Once we've completed the initial setup, it's simple to use. It has all of the features we need to quickly and efficiently synthesize our data. Tableau Desktop has advanced capabilities to improve our company's data structure and enable self-service for our employees.
Read full review
Reliability and Availability
Devart
No answers on this topic
Tableau
When used as a stand-alone tool, Tableau Desktop has unlimited uptime, which is always nice. When used in conjunction with Tableau Server, this tool has as much uptime as your server admins are willing to give it. All in all, I've never had an issue with Tableau's availability.
Read full review
Performance
Devart
No answers on this topic
Tableau
Tableau Desktop's performance is solid. You can really dig into a large dataset in the form of a spreadsheet, and it exhibits similarly good performance when accessing a moderately sized Oracle database. I noticed that with Tableau Desktop 9.3, the performance using a spreadsheet started to slow around 75K rows by about 60 columns. This was easily remedied by creating an extract and pushing it to Tableau Server, where performance went to lightning fast
Read full review
Support Rating
Devart
No answers on this topic
Tableau
Tableau support has been extremely responsive and willing to help with all of our requests. They have assisted with creating advanced analysis and many different types of custom icons, data formatting, formulas, and actions embedded into graphs. Tableau offers a weekly presentation of features and assists with internal company projects.
Read full review
In-Person Training
Devart
No answers on this topic
Tableau
It is admittedly hard to train a group of people with disparate levels of ability coming in, but the software is so easy to use that this is not a huge problem; anyone who can follow simple instructions can catch up pretty quickly.
Read full review
Online Training
Devart
No answers on this topic
Tableau
I think the training was good overall, but it was maybe stating the obvious things that a tech savvy young engineer would be able to pick up themselves too. However, the example work books were good and Tableau web community has helped me with many problems
Read full review
Implementation Rating
Devart
No answers on this topic
Tableau
Again, training is the key and the company provides a lot of example videos that will help users discover use cases that will greatly assist their creation of original visualizations. As with any new software tool, productivity will decline for a period. In the case of Tableau, the decline period is short and the later gains are well worth it.
Read full review
Alternatives Considered
Devart
Microsoft Excel is the most used tool in the software universe. As such, asking Microsoft Excel to be the tool used post data acquisition makes a ton of sense. Almost everyone we hire has some idea on how to use this tool, which decreases the time spend training new employees.
Read full review
Tableau
I have used Power BI as well, the pricing is better, and also training costs or certifications are not that high. Since there is python integration in Power BI where I can use data cleaning and visualizing libraries and also some machine learning models. I can import my python scripts and create a visualization on processed data.
Read full review
Scalability
Devart
No answers on this topic
Tableau
Tableau Desktop's scaleability is really limited to the scale of your back-end data systems. If you want to pull down an extract and work quickly in-memory, in my application it scaled to a few tens of millions of rows using the in-memory engine. But it's really only limited by your back-end data store if you have or are willing to invest in an optimized SQL store or purpose-built query engine like Veritca or Netezza or something similar.
Read full review
Return on Investment
Devart
  • It had a positive ROI as we used it on its strengths. We could save time and make some of our processes simpler.
  • It does help us up to a certain limit - but it acts as a part of our general IT infrastructure. It cannot solve our direct business objectives.
  • It cannot be expanded in all directions as we need a lot more native coding and IT infrastructure.
Read full review
Tableau
  • Tableau was acquired years ago, and has provided good value with the content created.
  • Ongoing maintenance costs for the platform, both to maintain desktop and server licensing has made the continuing value questionable when compared to other offerings in the marketplace.
  • Users have largely been satisfied with the content, but not with the overall performance. This is due to a combination of factors including the performance of the Tableau engines as well as development deficiencies.
Read full review
ScreenShots

Devart Excel Add-ins Screenshots

Screenshot of Screenshot of Screenshot of Screenshot of