Epicor Grow vs. IBM Cognos Analytics

Overview
ProductRatingMost Used ByProduct SummaryStarting Price
Epicor Grow
Score 6.4 out of 10
Small Businesses (1-50 employees)
Grow, from Epicor since the March 2022 acquisition, is a business intelligence software that is designed to empower businesses to become data-driven and accelerate growth by aligning team objectives and inspiring strategic decisions.N/A
IBM Cognos Analytics
Score 7.4 out of 10
N/A
IBM Cognos is a full-featured business intelligence suite by IBM, designed for larger deployments. It comprises Query Studio, Reporting Studio, Analysis Studio and Event Studio, and Cognos Administration along with tools for Microsoft Office integration, full-text search, and dashboards.
$11.25
per month per user
Pricing
Epicor GrowIBM Cognos Analytics
Editions & Modules
No answers on this topic
On Demand - Standard
USD 11.25
per month per user
On Demand - Premium
USD 44.90
per month per user
Offerings
Pricing Offerings
Epicor GrowIBM Cognos Analytics
Free Trial
YesYes
Free/Freemium Version
NoNo
Premium Consulting/Integration Services
NoNo
Entry-level Setup FeeRequiredOptional
Additional Details
More Pricing Information
Community Pulse
Epicor GrowIBM Cognos Analytics
Considered Both Products
Epicor Grow
Chose Epicor Grow
Grow is above and beyond using google sheets for data analysis. There really is no comparison to the ability to access, analyze and report on data in Grow versus in Google sheets. The metrics are also great, the graphs are easily created and understandable. They are also easily …
Chose Epicor Grow
Grow.com is a great product because it is usable and has tons of functionality and customization, but it is definitely very expensive compared to other options out there.
Chose Epicor Grow
Grow.com is a software that we picked because of the great positive reviews and because of the great customer service. Often times we need assistance within the software and the customer service reps are able to help.
Chose Epicor Grow
Grow.com is one of the best options because of the amount of functionality and customization is much better than other platforms.
Chose Epicor Grow
We like Grow.com and chose this platform because the customer support team was great and super helpful. We make this a priority so that when we run into issues, someone can assist.
Chose Epicor Grow
Grow.com is one of the best software out there simply because of how intuitive it is to use. It does not take much effort to get a team up and running using the software, but there are also a lot of other functions that can be expanded on as well.
Chose Epicor Grow
Grow doesn't have as many advanced analytics features and other capabilities as some other 'dashboard' platforms on the market. Simply, if you want a tool for internal use only that has high-level analytics capabilities (regressions, completely custom visualizations, modeling), …
Chose Epicor Grow
Tableau and Klipfolio are both great options and we considered others but ultimately Grow had the best combination of pricing, report customization, and support that we were looking for. At one point, when we were only using Grow with our Sales Team, we thought about moving …
Chose Epicor Grow
I've used all three products listed, and Salesforce really lacks even with their own reports. We started using Grow almost exclusively for displaying and visualizing Salesforce data. At a previous company, we used Geckoboard, which I would consider more of a direct competitor. …
Chose Epicor Grow
Google Analytics only shows one side of the story. With Grow.com we are able to look at data from many angles.
Chose Epicor Grow
Grow.com has the easiest to use UI/UX out of the other business intelligence tools that I have used. It is a little more intuitive and takes less knowledge of SQL to really get what you want. The pre-built metrics really help to get up and going right out of the box, where …
Chose Epicor Grow
Grow was a much better fit for our organization:
Simple deployment
Feature rich
Chose Epicor Grow
We needed a tool that had more connections than Don King. And that tool is Grow.
Chose Epicor Grow
I initially selected Grow because it was integrated with our CRM (ProsperWorks) and allowed me to use SQL to query that data. I've stuck with it because it supports many of the other data sources we are interested in pulling data from and gives us a lot of flexibility in doing …
Chose Epicor Grow
I think Grow stacks up really well, and to be honest, we have not done a deep dive into competitors.
Chose Epicor Grow
When I looked at other solutions I found that the setup costs would have been tens of thousands of dollars. With Grow I can do it myself.
Chose Epicor Grow
Geckoboard and hacking it together with Google Sheets. Neither let's you do as much and neither is as pretty.
Chose Epicor Grow
Blew the doors off in terms of simplicity and support when getting started.
Chose Epicor Grow
Grow is the first product of this type which I have utilized at any significant level.
Chose Epicor Grow
We've used several Google Docs as our own dashboarding platform. Integration was ok but not nearly as clean as grow. Implementation was slightly easier if you were familiar with Excel though.
Chose Epicor Grow
We chose Grow because of how economical it was in comparison. It was a great decision because we got what we needed and didn't have to pay even close to what we would have with other companies.
Chose Epicor Grow
We looked at quite a few different providers (I honestly cannot recall the names) but ended up utilizing Grow based upon initial conversations.
Chose Epicor Grow
Before Grow we chose iCharts and developed all charts in iCharts. But it is very difficult to develop charts in iCharts and also we cannot display those charts on TV monitors continuously. That is when we looked into Grow and we have been using Grow since then.
IBM Cognos Analytics
Chose IBM Cognos Analytics
i believe that CA is more powerful, has better modelling, and is not held back by a cumbersome method of re-using data models. The only thing that holds it back is the complexity of licensing.
Chose IBM Cognos Analytics
IBM Cognos Analytics is robust in terms of reporting, governance and scheduling while Power BI excels in use, interactivity and visuals. In nutshell, IBM Cognos Analytics has edge over Power BI for enterprise grade , structured reporting needs.
Chose IBM Cognos Analytics
We chose IBM Cognos Analytics because, in our experience, IBM Cognos Analytics was Better, had more feature functionality, and is easier to use
Chose IBM Cognos Analytics
have been using since it's creation
Chose IBM Cognos Analytics
Microsoft Power BI and MicroStrategy Analytics
Chose IBM Cognos Analytics
We chose IBM Cognos Analytics because, in our opinion, IBM Cognos Analytics has Better enterprise integration
Chose IBM Cognos Analytics
Much more powerful and complete
Chose IBM Cognos Analytics
Power BI is stronger for quick ad-hoc analysis and dashboards, but IBM Cognos Analytics is better when consistency, precision, and mass distribution matter. Tableau is best for interactive analysis, while IBM Cognos Analytics is better for standardized, repeatable enterprise …
Chose IBM Cognos Analytics
IBM Cognos Analytics was more matured enterprise modeling-based tool. Our power Bi struggled against large ERP data sets, which IBM didn't after few initial days.

IBM had much better scalability and security when comes to user reports distribution. The schedule feature worked …
Chose IBM Cognos Analytics
Compared to other tools like Power BI, Tableau, and Google studio, IBM Cognos Analytics is better for the companies who looks strong control on detailed reports. Power BI and Tableau are easy to use and good for quick presentation, but Cognos has more options for security, such …
Chose IBM Cognos Analytics
Tableau, Power BI, QlikView were the other options considered. Tableau lacked the following key components of business intelligence and analytics. Some other statistical functions that are available on the platform were not matched by Power BI. QlikView lacked robust …
Chose IBM Cognos Analytics
We selected IBM Cognos Analytics based on the following. The scalable and robust features for large organizations allowing it to grow as we do. The nest feature is the strong data governance and security features. It also supports a wide variety of data sources. Lastly, it …
Chose IBM Cognos Analytics
It was due to trust in IBM. Very good support provide by IBM. Response time is pretty good
Product is proven in past & well robust feature
Many good enterprises have used this product
Chose IBM Cognos Analytics
My company selected IBM Congos Analytics because of its advanced features and data representation for data analysis. Its row and column features are very effective for creating dashboards and reports to visualize data. It's chart representation and view format are very …
Chose IBM Cognos Analytics
Not to be compared. Completely different products.
Chose IBM Cognos Analytics
It does well however, we need more user friendly interfaces, integration options and visualizations.
Chose IBM Cognos Analytics
IBM Cognos Analytics is our legacy BI solution. It hadn't stacked up well against its modern contemporaries. We are thinking of replacing it with Microsoft BI.
Chose IBM Cognos Analytics
Cognos provides very advanced analytics functionalities, maybe even more advanced than the competition, and works great when used in collaboration with Watson. However, Tableau and other newer products are much better regarding overall usability.
Features
Epicor GrowIBM Cognos Analytics
BI Standard Reporting
Comparison of BI Standard Reporting features of Product A and Product B
Epicor Grow
8.0
Ratings
2% below category average
IBM Cognos Analytics
7.6
Ratings
7% below category average
Customizable dashboards9.00 Ratings7.70 Ratings
Report Formatting Templates7.00 Ratings7.60 Ratings
Pixel Perfect reports00 Ratings7.50 Ratings
Ad-hoc Reporting
Comparison of Ad-hoc Reporting features of Product A and Product B
Epicor Grow
7.7
Ratings
4% below category average
IBM Cognos Analytics
7.5
Ratings
7% below category average
Drill-down analysis7.00 Ratings6.80 Ratings
Formatting capabilities7.00 Ratings7.80 Ratings
Report sharing and collaboration9.00 Ratings8.20 Ratings
Integration with R or other statistical packages00 Ratings7.30 Ratings
Report Output and Scheduling
Comparison of Report Output and Scheduling features of Product A and Product B
Epicor Grow
6.7
Ratings
20% below category average
IBM Cognos Analytics
5.8
Ratings
34% below category average
Publish to Web7.00 Ratings6.40 Ratings
Publish to PDF7.00 Ratings7.80 Ratings
Report Delivery Scheduling6.00 Ratings8.40 Ratings
Report Versioning00 Ratings3.60 Ratings
Delivery to Remote Servers00 Ratings2.70 Ratings
Data Discovery and Visualization
Comparison of Data Discovery and Visualization features of Product A and Product B
Epicor Grow
7.0
Ratings
13% below category average
IBM Cognos Analytics
6.9
Ratings
15% below category average
Pre-built visualization formats (heatmaps, scatter plots etc.)7.00 Ratings7.70 Ratings
Location Analytics / Geographic Visualization7.00 Ratings7.50 Ratings
Predictive Analytics00 Ratings6.50 Ratings
Pattern Recognition and Data Mining00 Ratings6.10 Ratings
Access Control and Security
Comparison of Access Control and Security features of Product A and Product B
Epicor Grow
7.0
Ratings
19% below category average
IBM Cognos Analytics
7.4
Ratings
14% below category average
Multi-User Support (named login)7.00 Ratings7.00 Ratings
Role-Based Security Model7.00 Ratings7.10 Ratings
Multiple Access Permission Levels (Create, Read, Delete)7.00 Ratings6.60 Ratings
Report-Level Access Control7.00 Ratings7.90 Ratings
Single Sign-On (SSO)7.00 Ratings8.20 Ratings
Mobile Capabilities
Comparison of Mobile Capabilities features of Product A and Product B
Epicor Grow
7.7
Ratings
0% below category average
IBM Cognos Analytics
6.3
Ratings
20% below category average
Responsive Design for Web Access8.00 Ratings6.60 Ratings
Mobile Application7.50 Ratings6.50 Ratings
Dashboard / Report / Visualization Interactivity on Mobile8.00 Ratings6.50 Ratings
Application Program Interfaces (APIs) / Embedding
Comparison of Application Program Interfaces (APIs) / Embedding features of Product A and Product B
Epicor Grow
7.0
Ratings
10% below category average
IBM Cognos Analytics
7.4
Ratings
4% below category average
REST API7.00 Ratings7.10 Ratings
Javascript API00 Ratings7.30 Ratings
iFrames00 Ratings8.30 Ratings
Java API00 Ratings6.90 Ratings
Themeable User Interface (UI)00 Ratings7.10 Ratings
Customizable Platform (Open Source)00 Ratings7.80 Ratings
Best Alternatives
Epicor GrowIBM Cognos Analytics
Small Businesses
Yellowfin
Yellowfin
Score 8.6 out of 10
Yellowfin
Yellowfin
Score 8.6 out of 10
Medium-sized Companies
Reveal
Reveal
Score 10.0 out of 10
Reveal
Reveal
Score 10.0 out of 10
Enterprises
Kyvos Semantic Layer
Score 9.5 out of 10
Kyvos Semantic Layer
Score 9.5 out of 10
All AlternativesView all alternativesView all alternatives
User Ratings
Epicor GrowIBM Cognos Analytics
Likelihood to Recommend
8.0
(0 ratings)
7.7
(0 ratings)
Likelihood to Renew
-
(0 ratings)
8.1
(0 ratings)
Usability
7.1
(0 ratings)
7.3
(0 ratings)
Availability
-
(0 ratings)
8.6
(0 ratings)
Performance
-
(0 ratings)
9.0
(0 ratings)
Support Rating
9.4
(0 ratings)
1.0
(0 ratings)
In-Person Training
-
(0 ratings)
8.7
(0 ratings)
Online Training
-
(0 ratings)
8.0
(0 ratings)
Implementation Rating
-
(0 ratings)
7.0
(0 ratings)
Configurability
-
(0 ratings)
7.0
(0 ratings)
Ease of integration
-
(0 ratings)
5.7
(0 ratings)
Product Scalability
-
(0 ratings)
2.7
(0 ratings)
Vendor post-sale
-
(0 ratings)
7.0
(0 ratings)
Vendor pre-sale
-
(0 ratings)
7.0
(0 ratings)
User Testimonials
Epicor GrowIBM Cognos Analytics
Likelihood to Recommend
Grow.com is well suited if you have a lot of data or client data to manage. If you do not have tons of data, there are other options out there that are a bit more simple and easy to use and a better price.
Read full review
IBM Cognos Analytics has great scheduling capabilities. A single report can be parameterized (e.g., “Store Manager ID”) and burst to thousands of recipients with their slice of data.IBM Cognos Analytics is a good fit for highly complex, multi-level calculations which can be handled by Report Studio. For example Monthly balance sheet that requires multi step calculation
Read full review
Pros
  • I love the fact that you have a team of developers who can help me build metrics or fix metrics that I do not create properly. I had to learn SQL in order to really build the metrics that mattered, which was a lot of fun, but resulted in many broken metrics. The vendor's team was great in responding to me requests for help!
  • Really, really appreciate the fact that Grow has SQL formulas to reference when building metrics. Again, as a novice, this accelerated my ability to learn and not have to leave your site and resources and stay within the Grow web properties.
  • Great account managers who check in regularly and are willing to help out whenever needed.
Read full review
  • Data Visualization: Plenty of options exist for multiple use cases, and dashboards are easy to implement and customize.
  • Integration with IBM Watson: makes it easy to use Watson AI features (NLP etc.) on your data.
  • Its advanced analytics functionalities with powerful pattern detection/prediction models.
Read full review
Cons
  • There are basic labeling issues with some of the graph types. Wish there was more customizability here, especially on complex graphs.
  • Could help more with analysis of data and trends, but that's going into full-fledged BI territory.
  • The functionality of being able to snapshot data isn't quite there.
Read full review
  • IBM Cognos Analytics enables customer data segmentation, which is essential for marketing, improving and streamlining purchasing behavior and preferences. This helps companies create more targeted and effective marketing campaigns.
  • Our clients Through data analysis, we can identify and observe trends in the behavior of other clients, allowing us to anticipate needs and adjust strategies to avoid consequences.
Read full review
Likelihood to Renew
No answers on this topic
It took my BI team one year to become productive at developing useful content on the IBM Cognos platform. After this year, the reports being developed for a client were stale and no longer relative to the ever changing needs of the business client. Given the same opportunity, I would select a platform that allows the team to quickly produce BI content. Fail fast and recover quickly!
Read full review
Usability
This tool is definitely a little bit difficult to be able to figure out at first, but after some time of learning you can definitely pick it up. I do wish there were more resources online that would be able to help speed up the learning process
Read full review
We have a strong user base (3500 users) that are highly utilizing this tool. Basic users are able to consume content within the applied security model. We have a set of advanced users that really push the limits of Cognos with Report and Query Studio. These users have created a lot of personal content and stored it in 'My Reports'. Users enjoy this flexibility.
Read full review
Reliability and Availability
No answers on this topic
Reports can typically be viewed through any browser that can access the server, so the availability is ultimately up to what the company utilizing it is comfortable with allowing, though report development tends to be more picky about browsers and settings as mentioned above. It also has an optional iPad app and general mobile browsing support, but dashboards lack the mobile compatibility. What keeps it from getting a higher score is the desktop tools that are vital to the development process. The compatibility with only Windows when the server has a wide range of compatibility can be a real sore point for a company that outfits its employees exclusively with Mac or Linux machines. Of course, if they are planning on outsourcing the development anyways, it's a rather moot point
Read full review
Performance
No answers on this topic
Overall no major complaints but it doesn't handle DMR (Dimensionally Modeled for Relational) very well. DMR modelling is a capability that IBM Cognos Framework Manager provides allowing you to specify dimensional information for relational metadata and allows for OLAP-style queries. However, the capability is not very efficient and, for example, if I'm using only 2 columns on a 20-column model, the software is not smart enough to exclude 18 columns and the query side gets progressively larger and larger until it's effectively unusable.
Read full review
Support Rating
The support team is very helpful and in every situation we have needed help in, they have been able to assist. So I have had a good experience with them
Read full review
Why is their web application not working as fast as you think it should? They never know, and it is always a a bunch of shots in the dark to find out. Trying to download software from them is like trying to find a book at the library before computers were invented.
Read full review
In-Person Training
No answers on this topic
Onsite training provided by IBM Cognos was effective and as expected. They did not perform training with our data which was a bit difficult for our end-users.
Read full review
Online Training
No answers on this topic
The online courses they offer are thorough and presented in such a way that someone who isn't already familiar with the general design methodologies used in this field will be capable of making a good design. The training environments are provided as a fully self contained virtual machine with everything needed already to create the environments. We've had some persisting issues with the environments becoming unavailable, but support has been responsive when these issues arise and straightening them out for us
Read full review
Implementation Rating
No answers on this topic
The implementation was handled very well. The initial implementation exposed a lot of disagreement between our campuses and departments as to how we define data. This was not entirely unexpected, but I thought that we did a nice job as a team to work through some of these challenges.
Read full review
Alternatives Considered
Grow doesn't have as many advanced analytics features and other capabilities as some other 'dashboard' platforms on the market. Simply, if you want a tool for internal use only that has high-level analytics capabilities (regressions, completely custom visualizations, modeling), Grow probably isn't the platform for you. To put it another way, if you have a team of data engineers and scientists doing complex analysis, Grow might not make the most sense. However, if you understand the value of data/visualization/dashboards, but lack some of those skillsets in your company, Grow might be the perfect fit. Not only is it incredibly scalable and reasonably priced compared to other market solutions, but their transform capabilities really stand out. They have many native data transformations that mimic SQL coding of a dataset, without requiring any knowledge of SQL. They've converted these transformations to easy-to-use tools in the platform, which are perfect for the less-technical user.
Read full review
IBM Cognos Analytics is robust in terms of reporting, governance and scheduling while Power BI excels in use, interactivity and visuals. In nutshell, IBM Cognos Analytics has edge over Power BI for enterprise grade , structured reporting needs.
Read full review
Scalability
No answers on this topic
The Cognos architecture is well suited for scalability. However, the architecture must be designed with scalability in mind from day one of the implementation. We recently upgraded from 10.1 to 10.2.1 and took the opportunity to revamp our architecture. It is now poised for future growth and scalability.
Read full review
Return on Investment
  • Made it so much easier and faster to access data across tools
  • Lessened the time exporting and uploading data to excel/sheets for analysis
  • Made data and metrics more easily accessible to others in our orgs
Read full review
  • The platform can be pretty pricey.
  • Convoluted contracts and they fine you for any breach during audits.
  • Things are changed between releases without any warning and break.
  • It is second to none at being able to customize list and crosstab type reports.
  • You can easily set up a report to be emailed out every day and even have it export the report to a shared folder.
  • On-prem environments can be scaled up pretty much as much as you would like.
Read full review
ScreenShots

Epicor Grow Screenshots

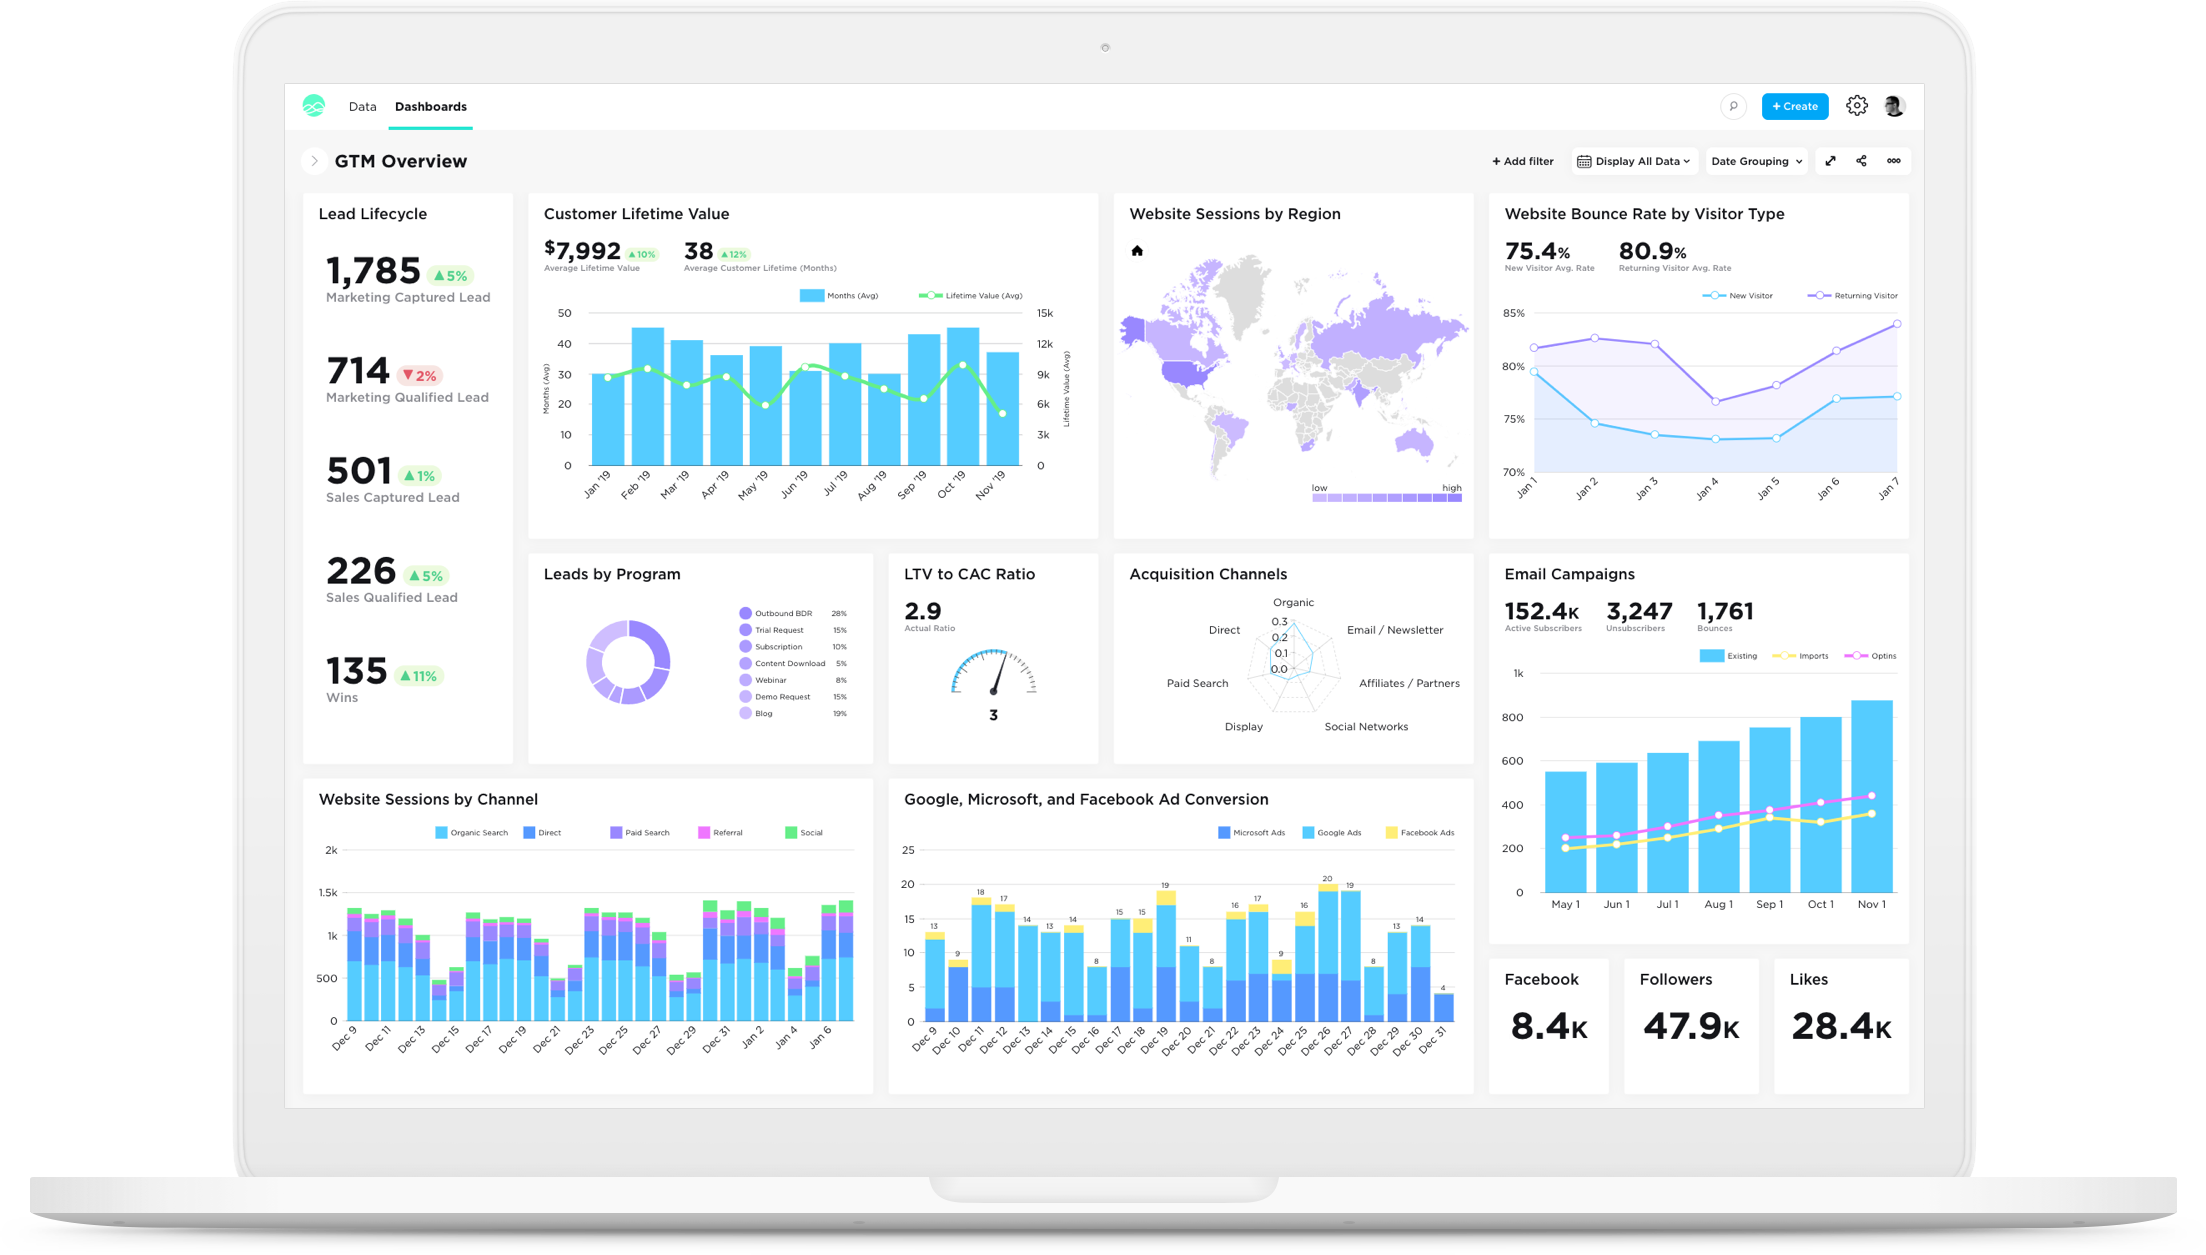
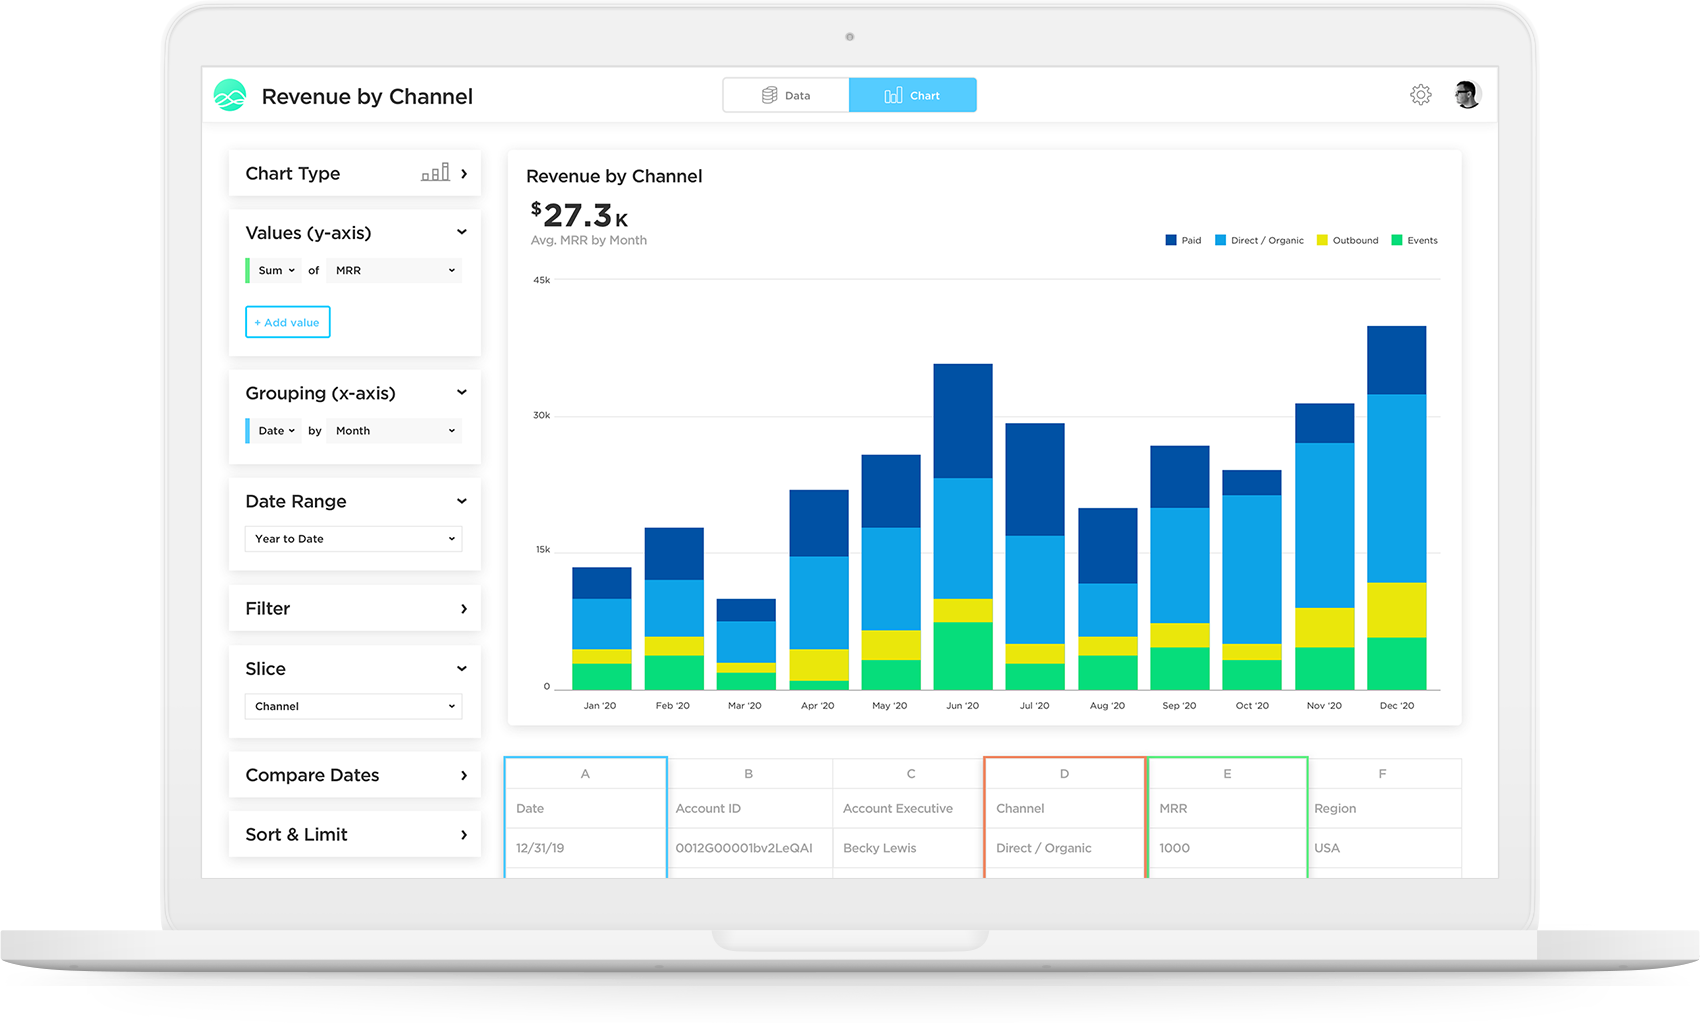
Screenshot of Marketing desktop dashboard in dark-mode.Screenshot of TV, desktop, and mobile dashboards.Screenshot of KPI desktop dashboard in light-mode.Screenshot of Chart builder and data visualization.

IBM Cognos Analytics Screenshots

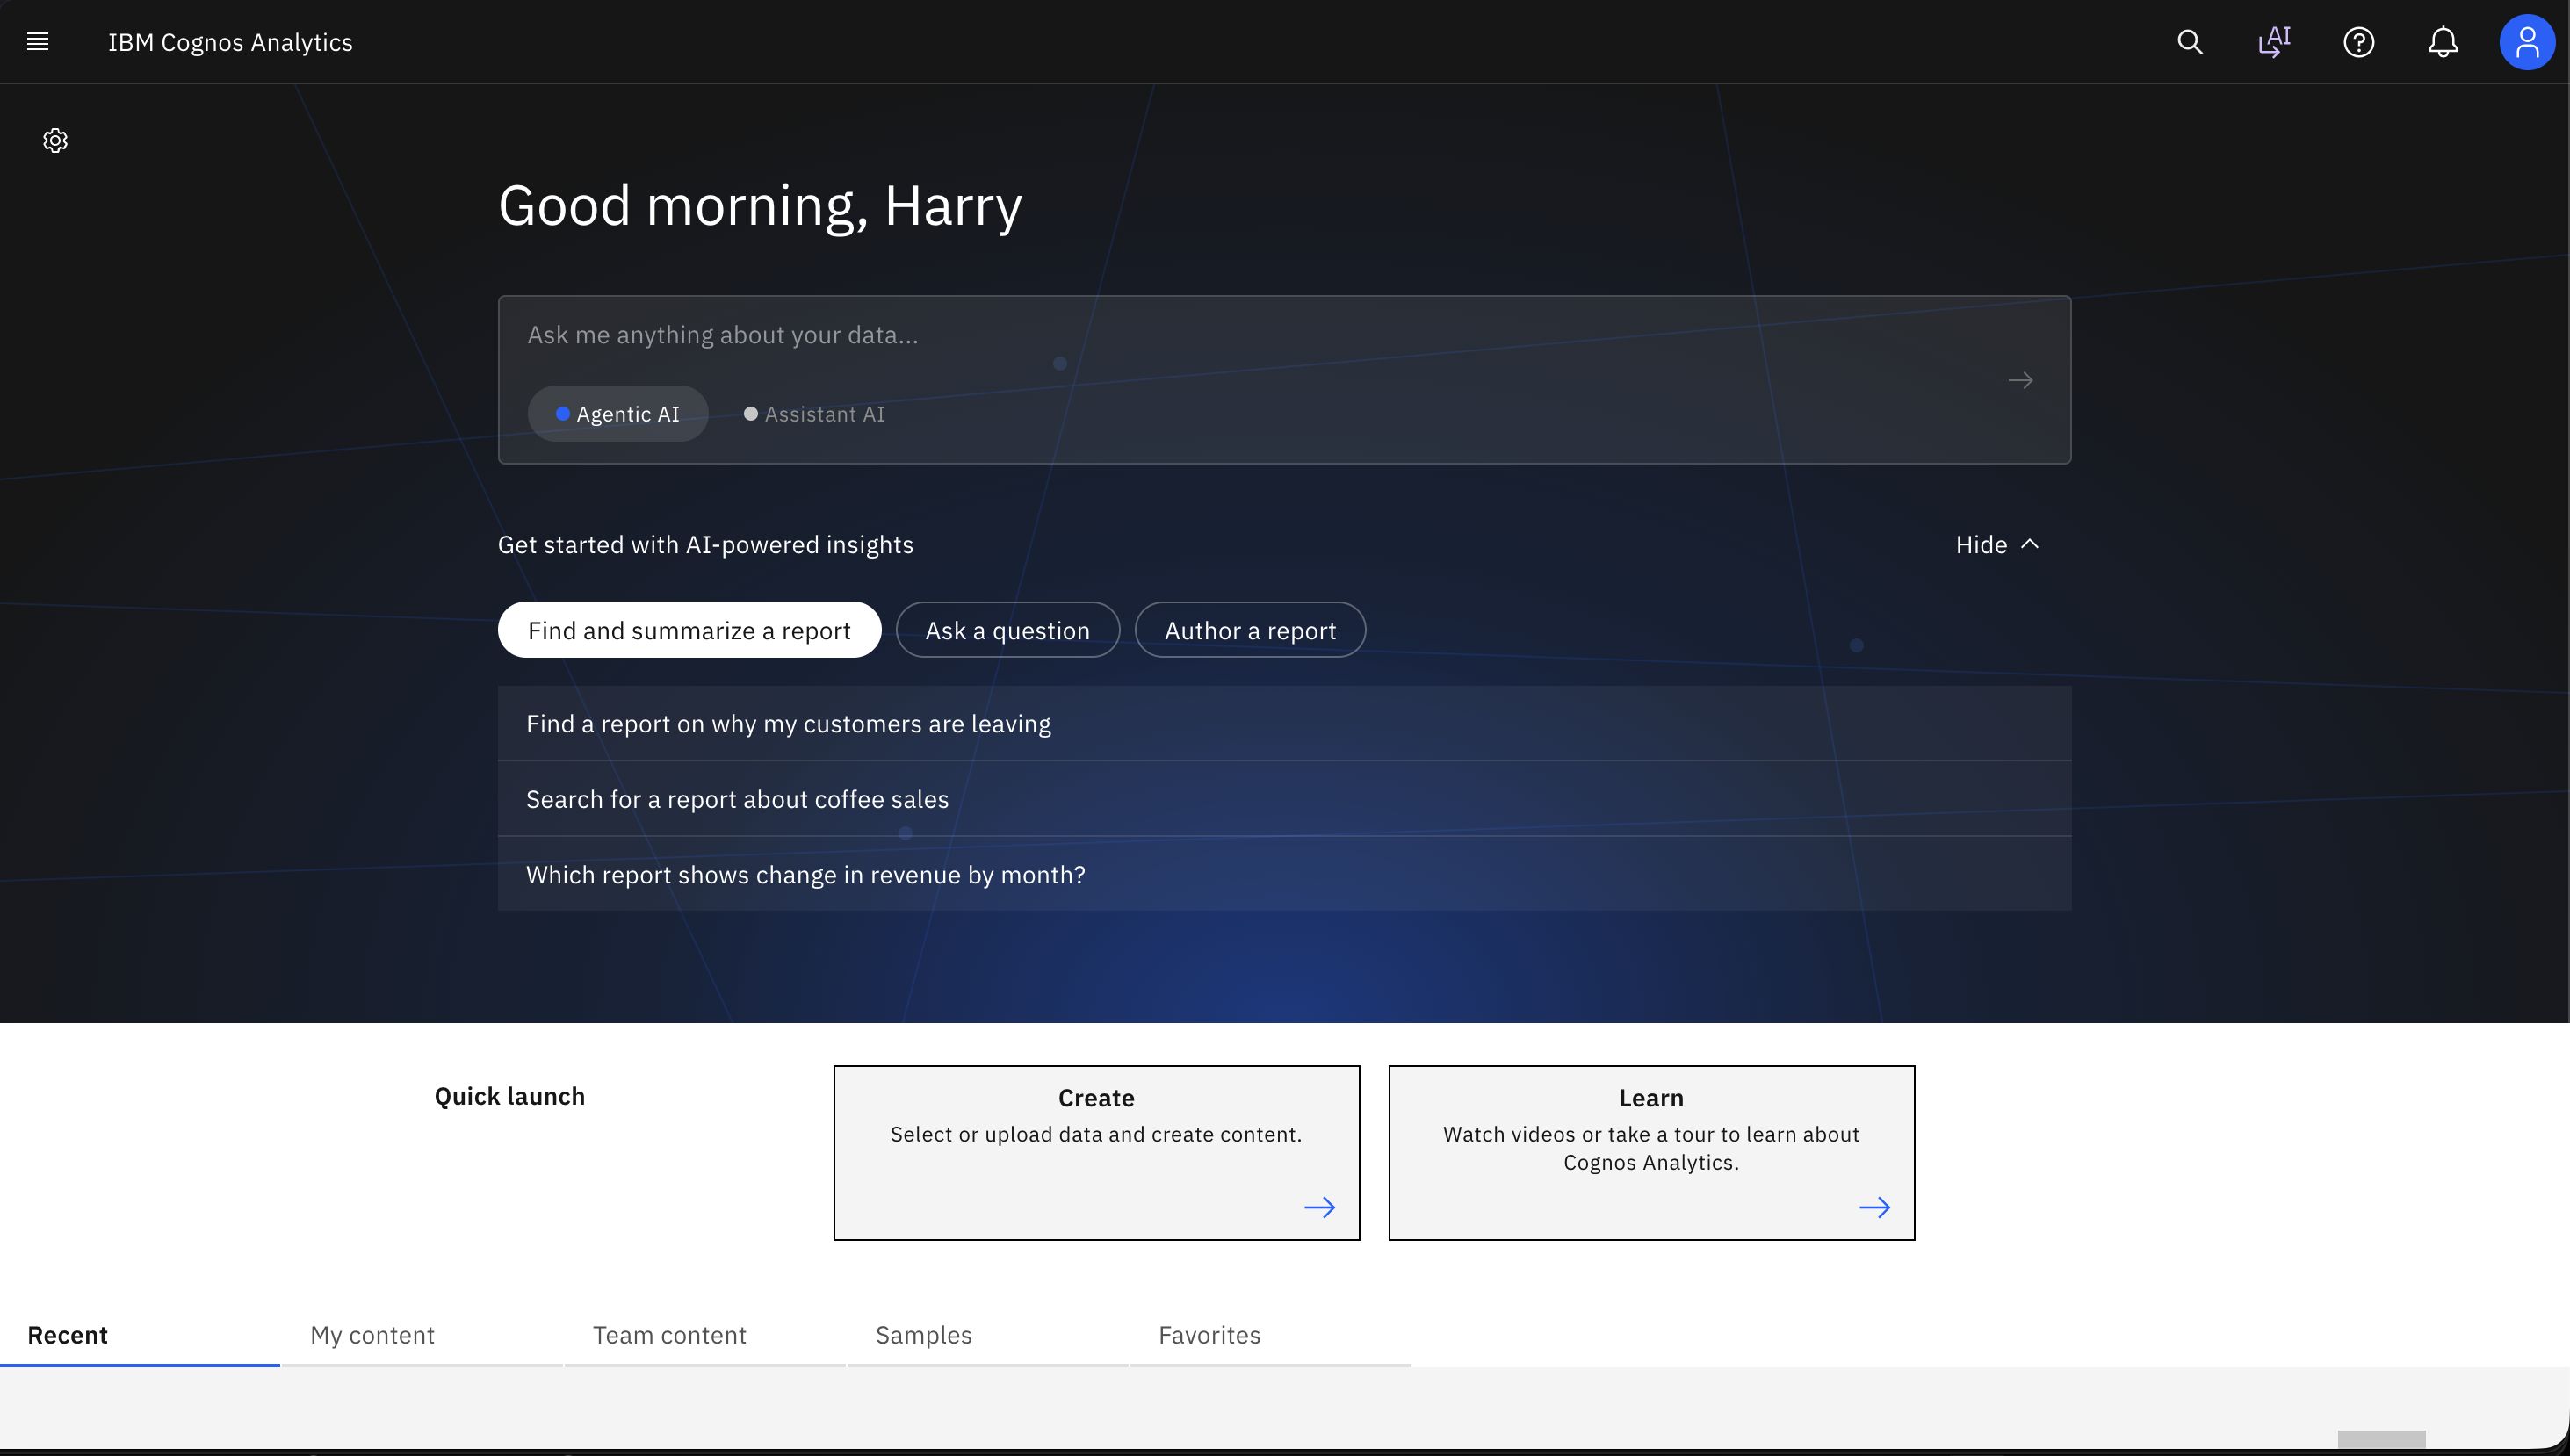
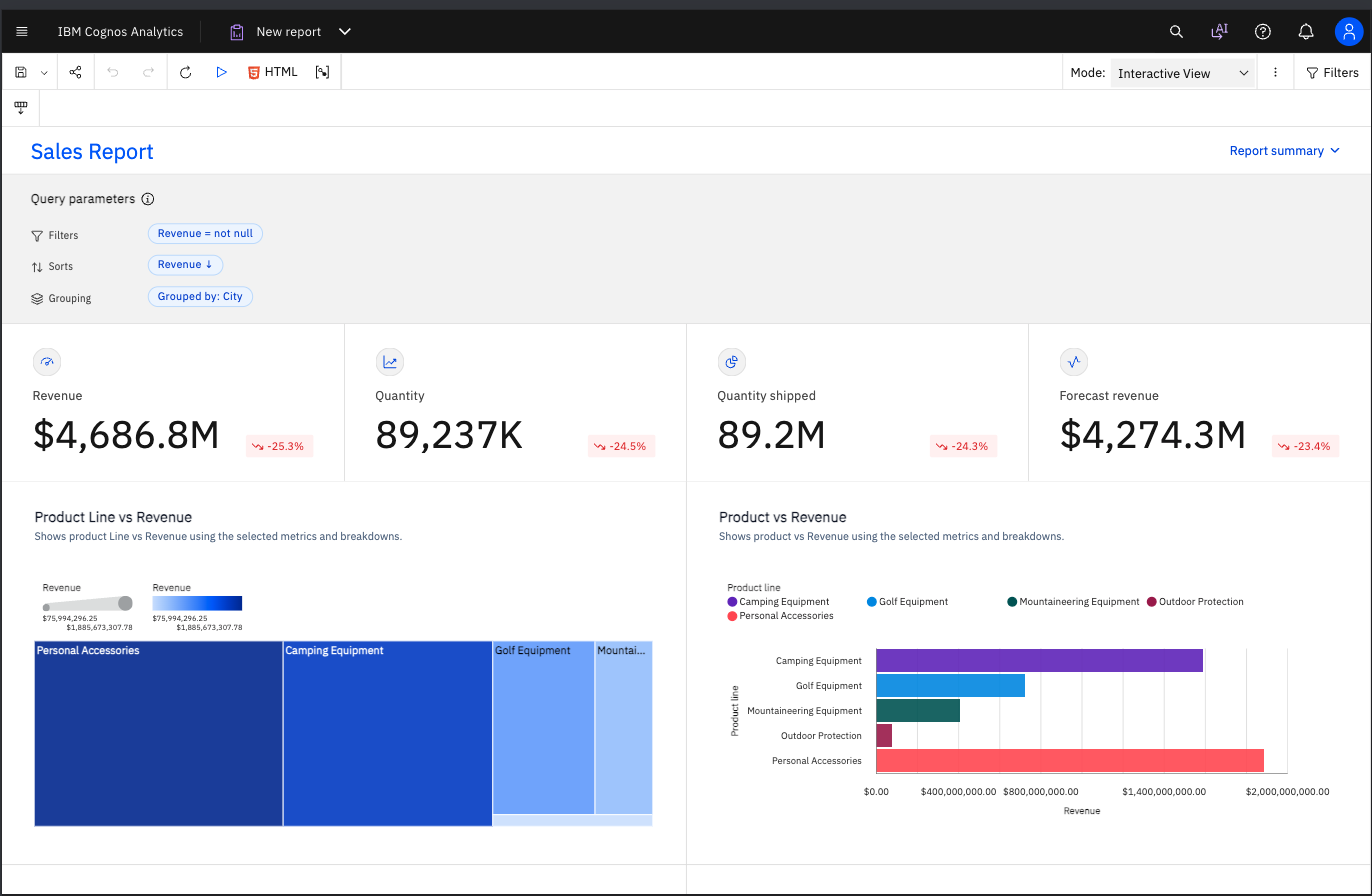
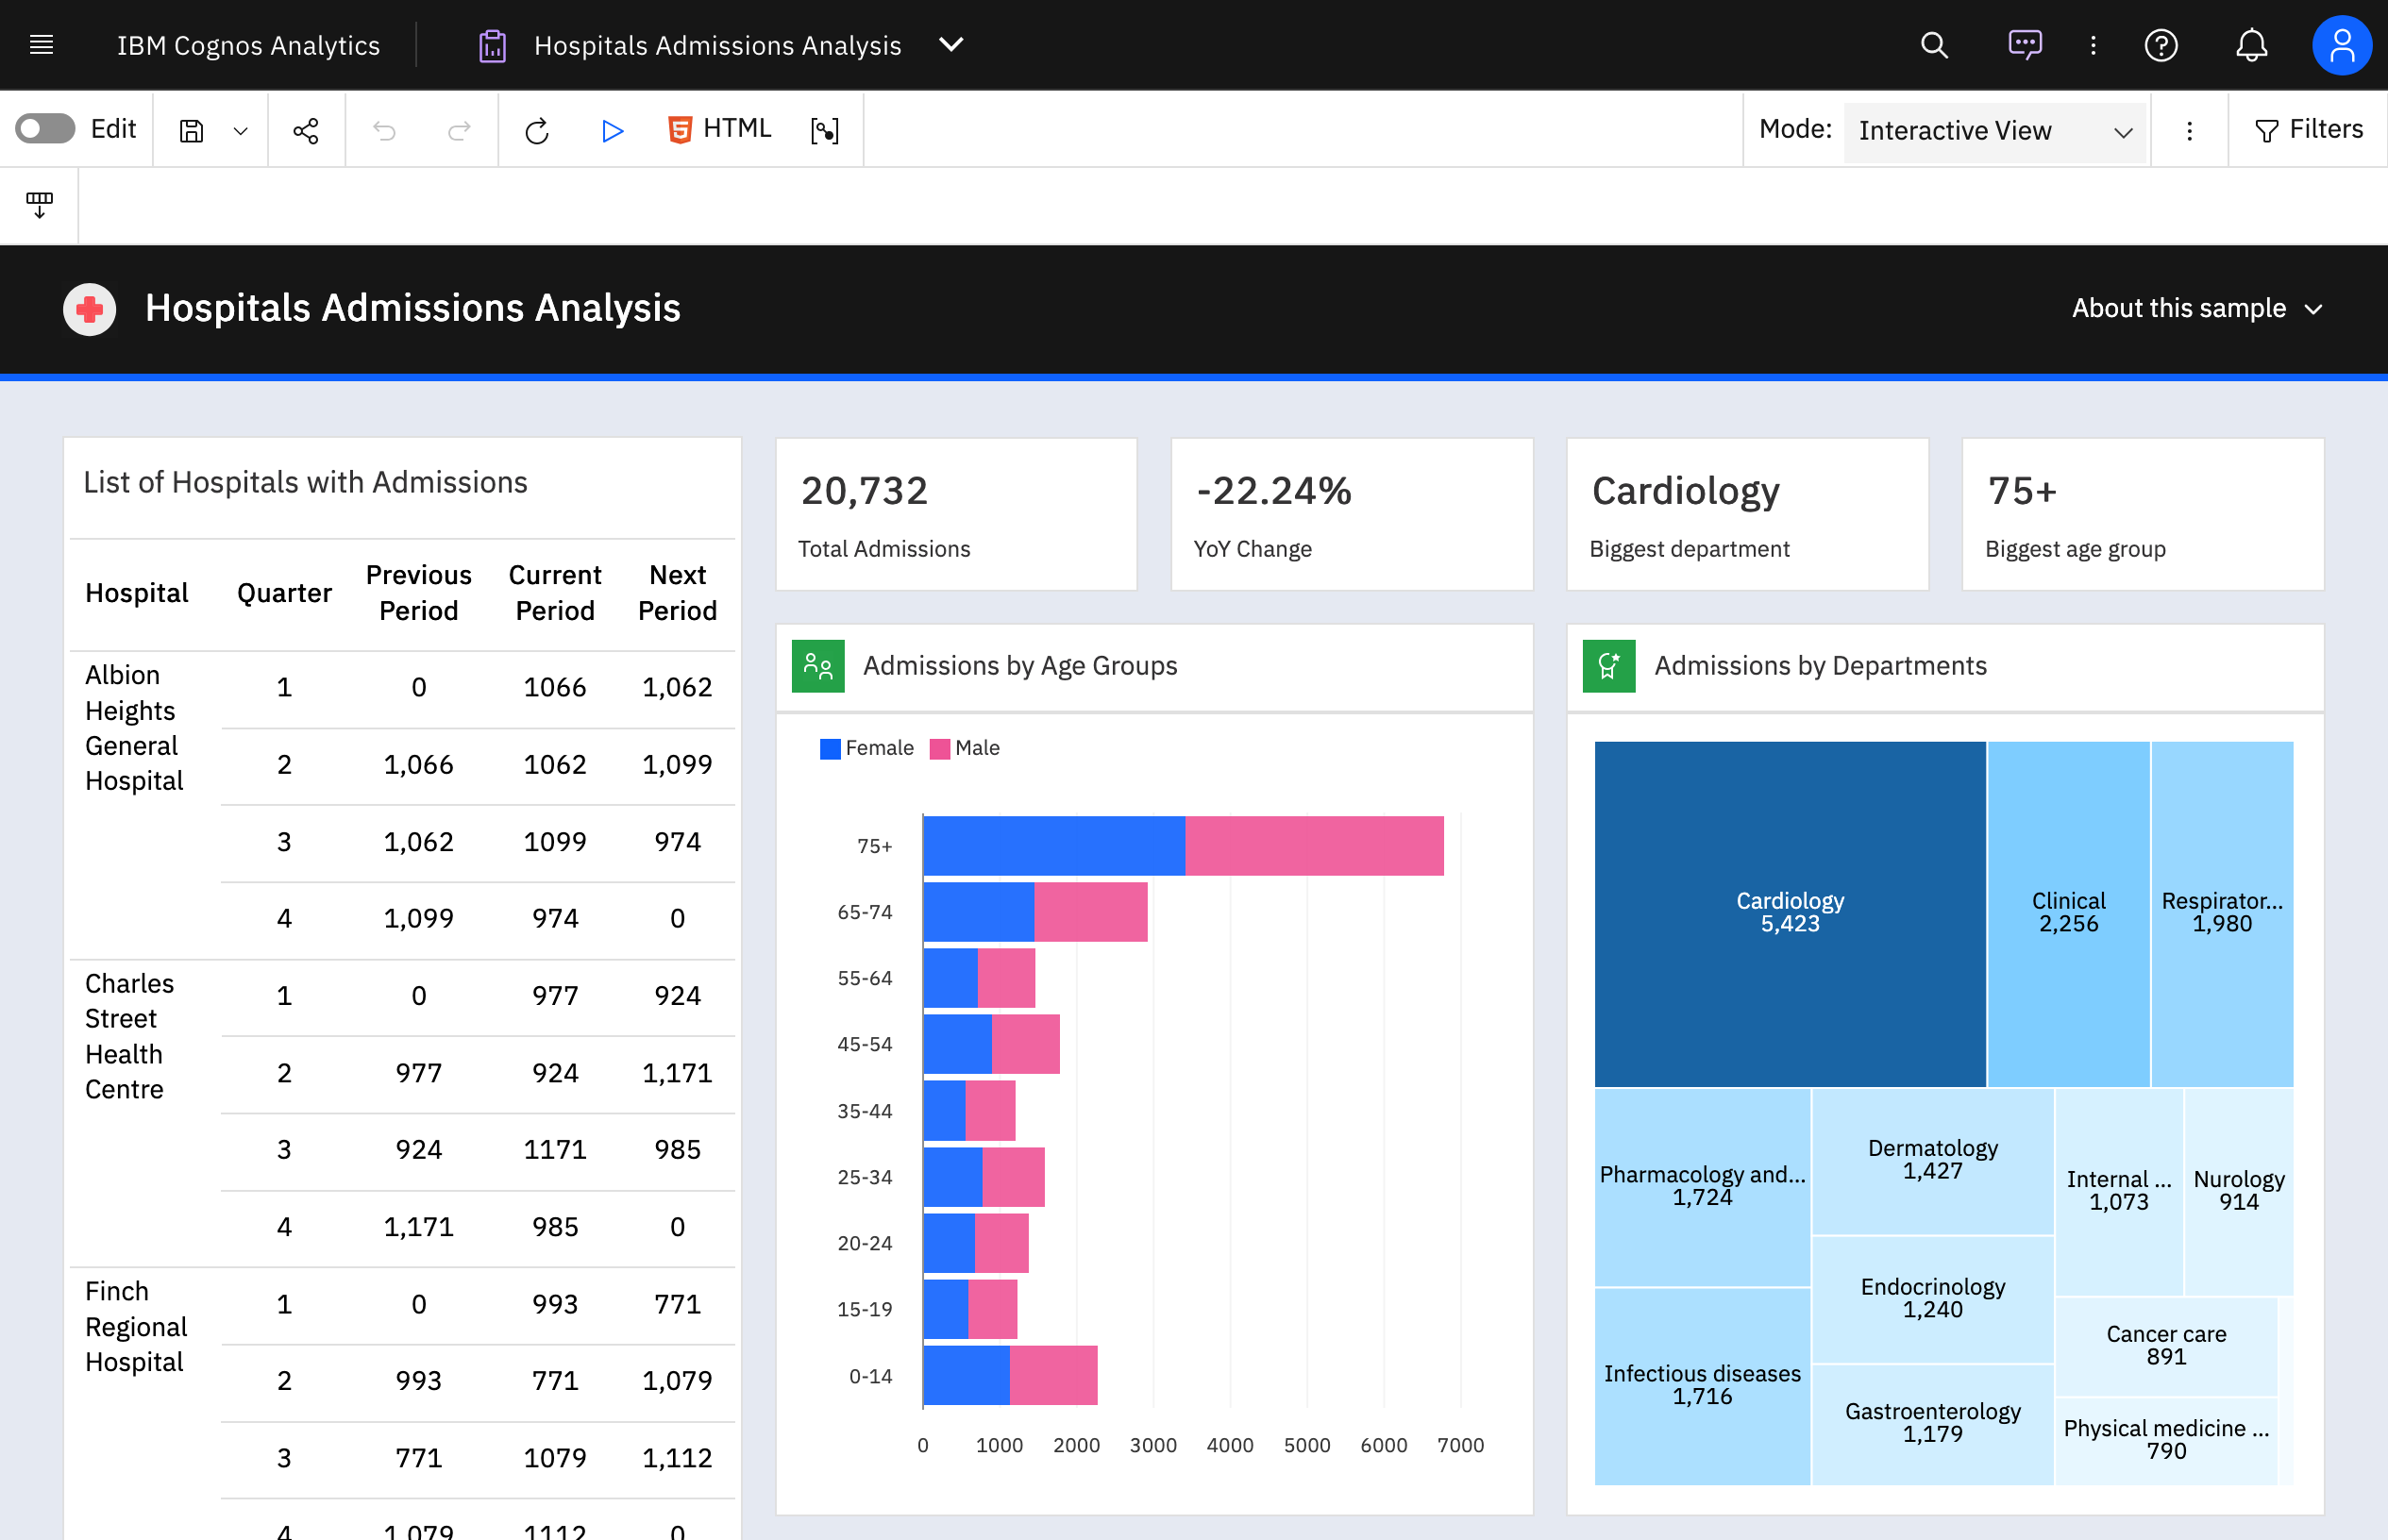
Screenshot of Screenshot of Screenshot of Screenshot of Screenshot of Screenshot of