Grow, from Epicor since the March 2022 acquisition, is a business intelligence software that is designed to empower businesses to become data-driven and accelerate growth by aligning team objectives and inspiring strategic decisions.
N/A
Panorama Necto
Score 8.0 out of 10
N/A
Panorama Necto is a business intelligence solution that provides enterprises with new ways to collaborate and create unique contextual connections. Some key features include: Workboards/Dashboards, Advanced Analytics, and Contextual Discovery.
N/A
Pricing
Epicor Grow
Panorama Necto
Editions & Modules
No answers on this topic
No answers on this topic
Offerings
Pricing Offerings
Epicor Grow
Panorama Necto
Free Trial
Yes
Yes
Free/Freemium Version
No
No
Premium Consulting/Integration Services
Yes
Yes
Entry-level Setup Fee
Required
No setup fee
Additional Details
—
—
More Pricing Information
Community Pulse
Epicor Grow
Panorama Necto
Features
Epicor Grow
Panorama Necto
BI Standard Reporting
Comparison of BI Standard Reporting features of Product A and Product B
Epicor Grow
8.0
32 Ratings
2% below category average
Panorama Necto
7.3
24 Ratings
11% below category average
Customizable dashboards
9.032 Ratings
8.024 Ratings
Report Formatting Templates
7.025 Ratings
8.024 Ratings
Pixel Perfect reports
00 Ratings
6.022 Ratings
Ad-hoc Reporting
Comparison of Ad-hoc Reporting features of Product A and Product B
Epicor Grow
7.7
31 Ratings
4% below category average
Panorama Necto
8.0
24 Ratings
0% below category average
Drill-down analysis
7.027 Ratings
9.023 Ratings
Formatting capabilities
7.028 Ratings
7.024 Ratings
Report sharing and collaboration
9.030 Ratings
8.022 Ratings
Integration with R or other statistical packages
00 Ratings
8.017 Ratings
Report Output and Scheduling
Comparison of Report Output and Scheduling features of Product A and Product B
Epicor Grow
6.7
29 Ratings
20% below category average
Panorama Necto
7.2
22 Ratings
13% below category average
Publish to Web
7.025 Ratings
7.821 Ratings
Publish to PDF
7.025 Ratings
6.722 Ratings
Report Delivery Scheduling
6.025 Ratings
7.021 Ratings
Report Versioning
00 Ratings
7.116 Ratings
Data Discovery and Visualization
Comparison of Data Discovery and Visualization features of Product A and Product B
Grow.com is well suited if you have a lot of data or client data to manage. If you do not have tons of data, there are other options out there that are a bit more simple and easy to use and a better price.
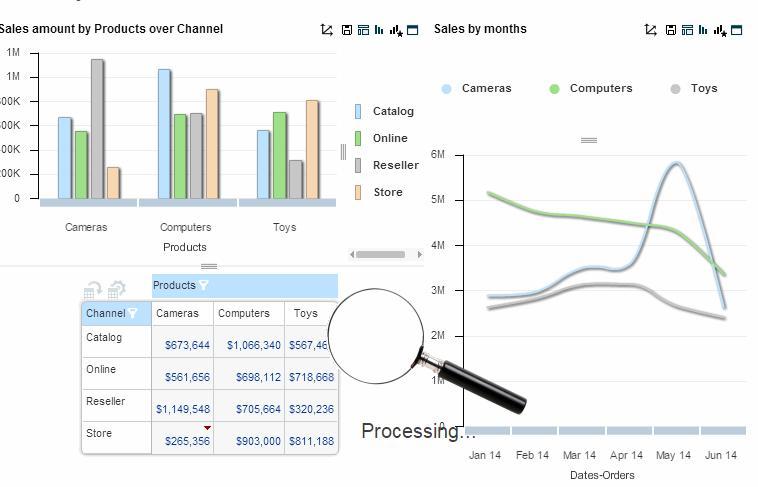
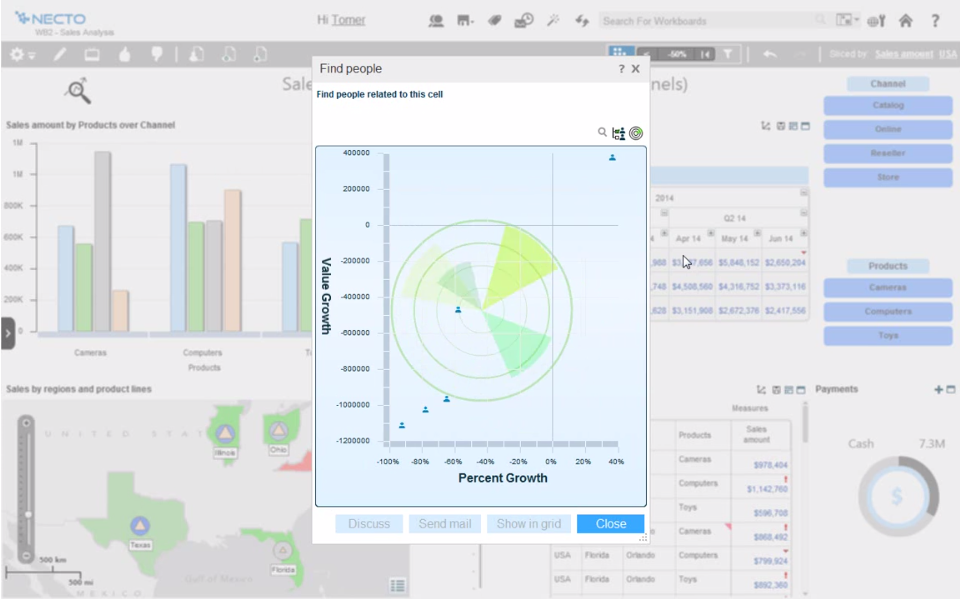
Panorama Necto 14 is well suited where BI is built to support social collaboration so that its analytics features can be shared to improve decision making by incorporating various organizational input. Additionally it supports an infographic display for information review which is unlike most of its competitors.
I love the fact that you have a team of developers who can help me build metrics or fix metrics that I do not create properly. I had to learn SQL in order to really build the metrics that mattered, which was a lot of fun, but resulted in many broken metrics. The vendor's team was great in responding to me requests for help!
Really, really appreciate the fact that Grow has SQL formulas to reference when building metrics. Again, as a novice, this accelerated my ability to learn and not have to leave your site and resources and stay within the Grow web properties.
Great account managers who check in regularly and are willing to help out whenever needed.
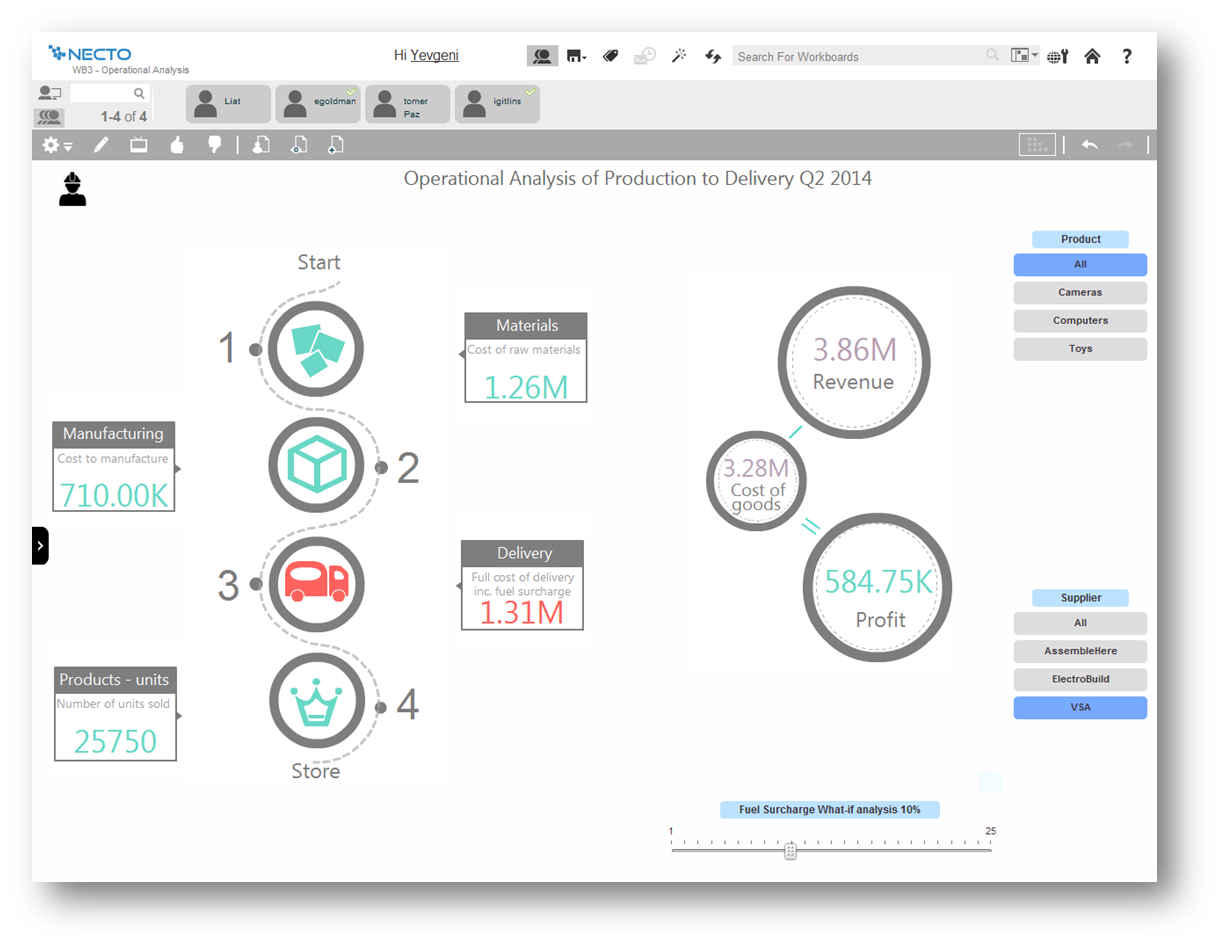
Comes with lot of option to modify and build the smart infographic. Uses innovative pictures and charts to create the dashboards
Helps you identify why you are succeeding and where you should shift your focus to.
The maps are amazing and they just don’t act as control points rather you can populate various measures on them making it really efficient to understand the business in geographical info graph
This tool is relatively new to the current competitive BI market. Many organizations or business analyst are not yet aware of it's eye catching features.
Need more enhancement for predictive analysis.
Publishing reports as email attachment and mail server configuration is a little complicated process.
Some features are very basic and sometimes you can't add your own SQL query for custom reports. For Macs and Blackberry users this application is not helpful. Non-languages are not supported in info-graphics. They need to improve their forecast analysis. Report sharing is limited among the portal users only
This tool is definitely a little bit difficult to be able to figure out at first, but after some time of learning you can definitely pick it up. I do wish there were more resources online that would be able to help speed up the learning process
It provides all the features that are required and some that are not the basic requirements, but they represent a great additional capabilities, not available within the similar products
The support team is very helpful and in every situation we have needed help in, they have been able to assist. So I have had a good experience with them
Grow doesn't have as many advanced analytics features and other capabilities as some other 'dashboard' platforms on the market. Simply, if you want a tool for internal use only that has high-level analytics capabilities (regressions, completely custom visualizations, modeling), Grow probably isn't the platform for you. To put it another way, if you have a team of data engineers and scientists doing complex analysis, Grow might not make the most sense. However, if you understand the value of data/visualization/dashboards, but lack some of those skillsets in your company, Grow might be the perfect fit. Not only is it incredibly scalable and reasonably priced compared to other market solutions, but their transform capabilities really stand out. They have many native data transformations that mimic SQL coding of a dataset, without requiring any knowledge of SQL. They've converted these transformations to easy-to-use tools in the platform, which are perfect for the less-technical user.
This is the next generation BI tool, which will be very helpful for small and medium businesses to kick start data exploration and visualization of their diverse databases, with less intervention from IT. This tool is more end user centric and gives way more power to the end user to perform data analysis