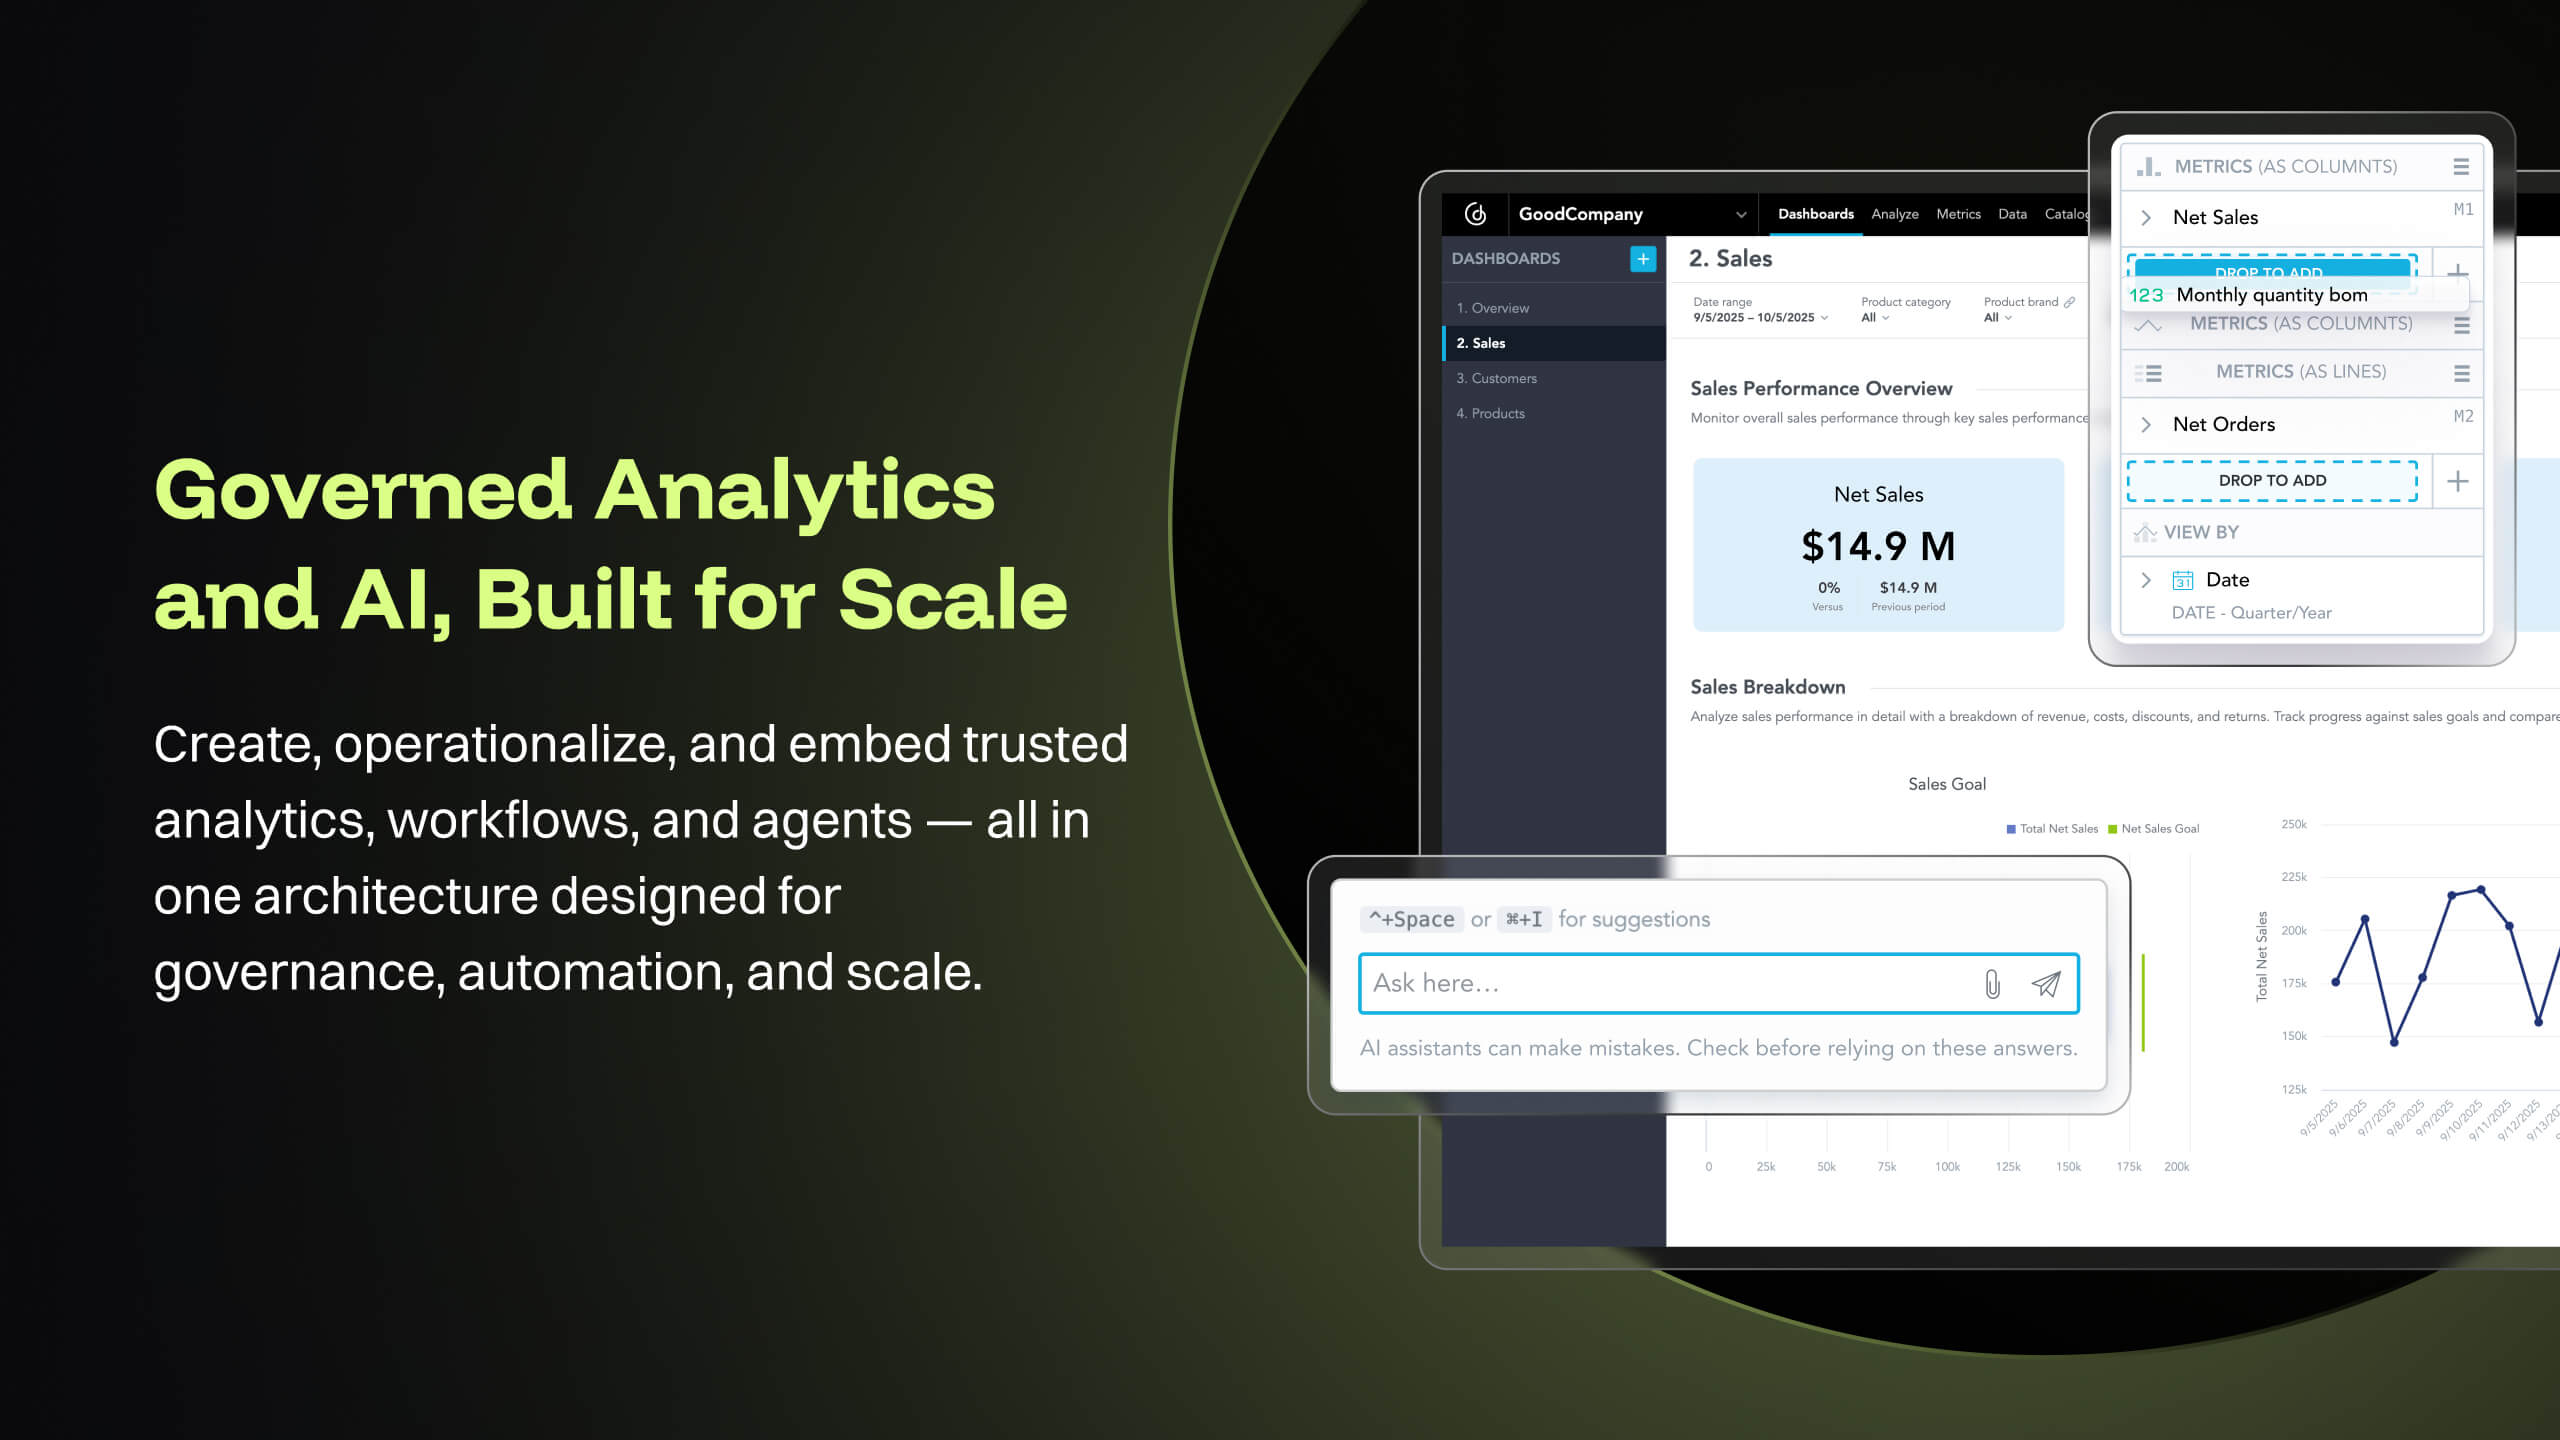
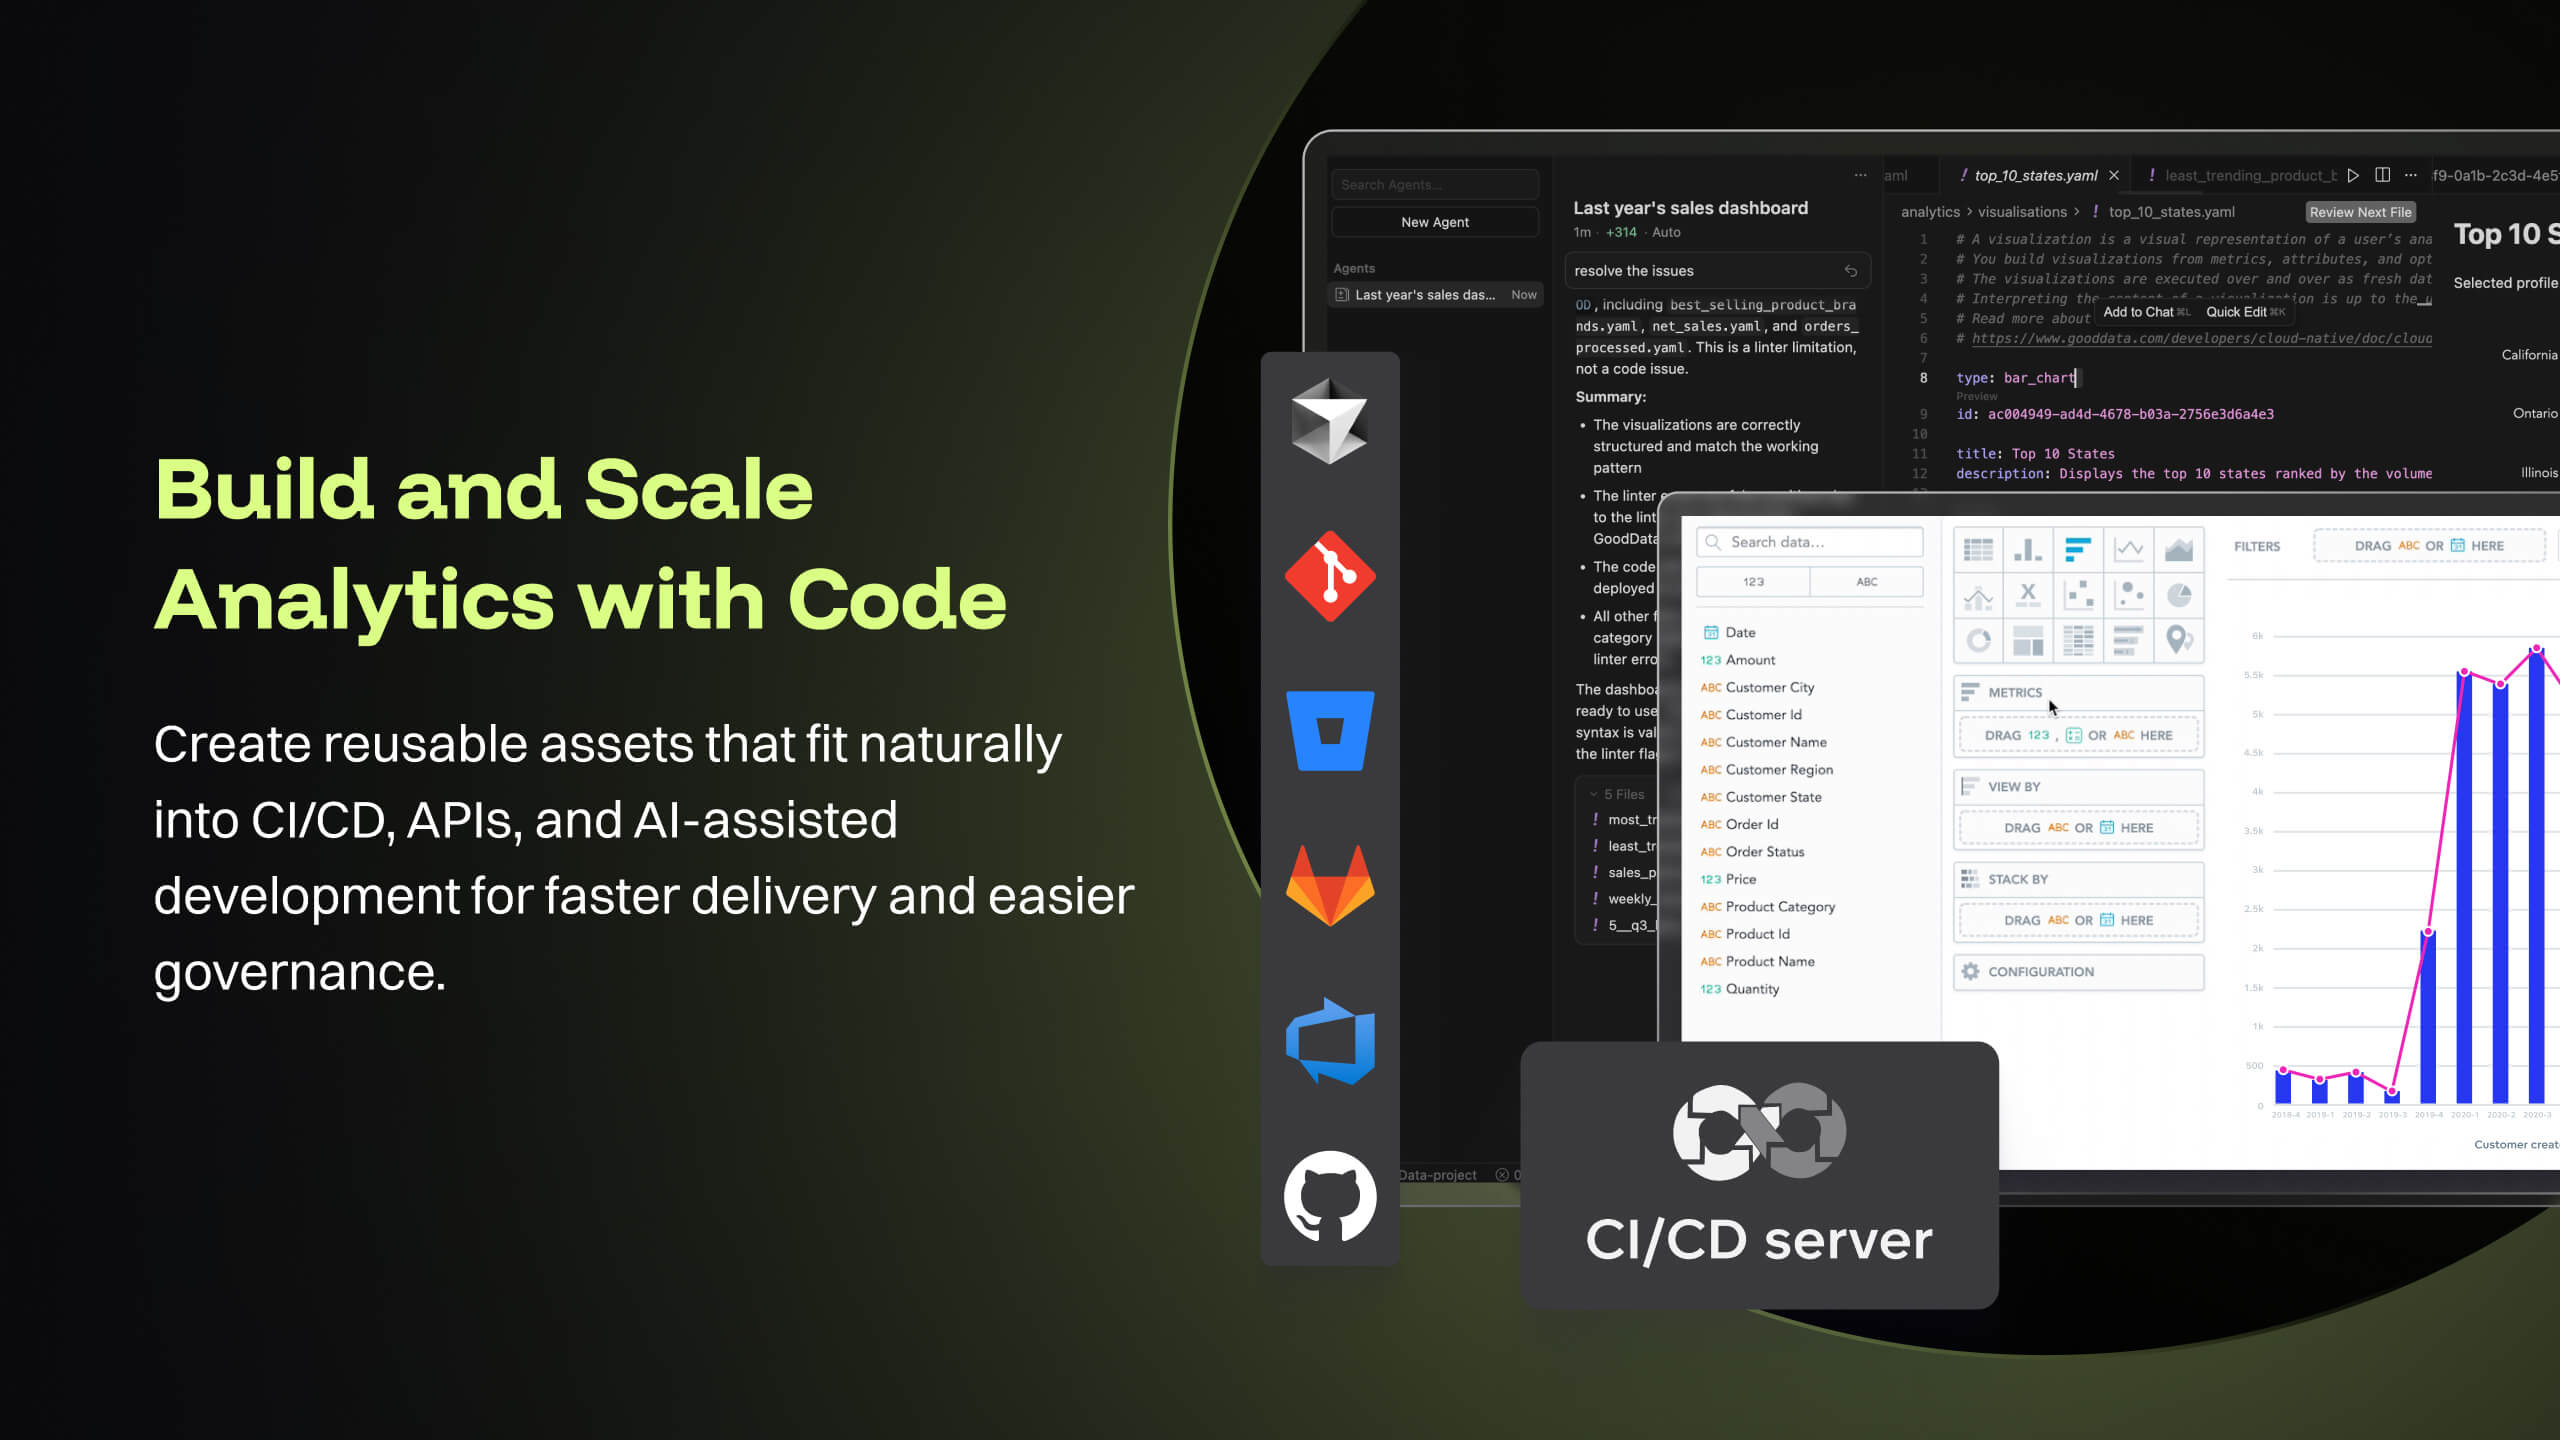
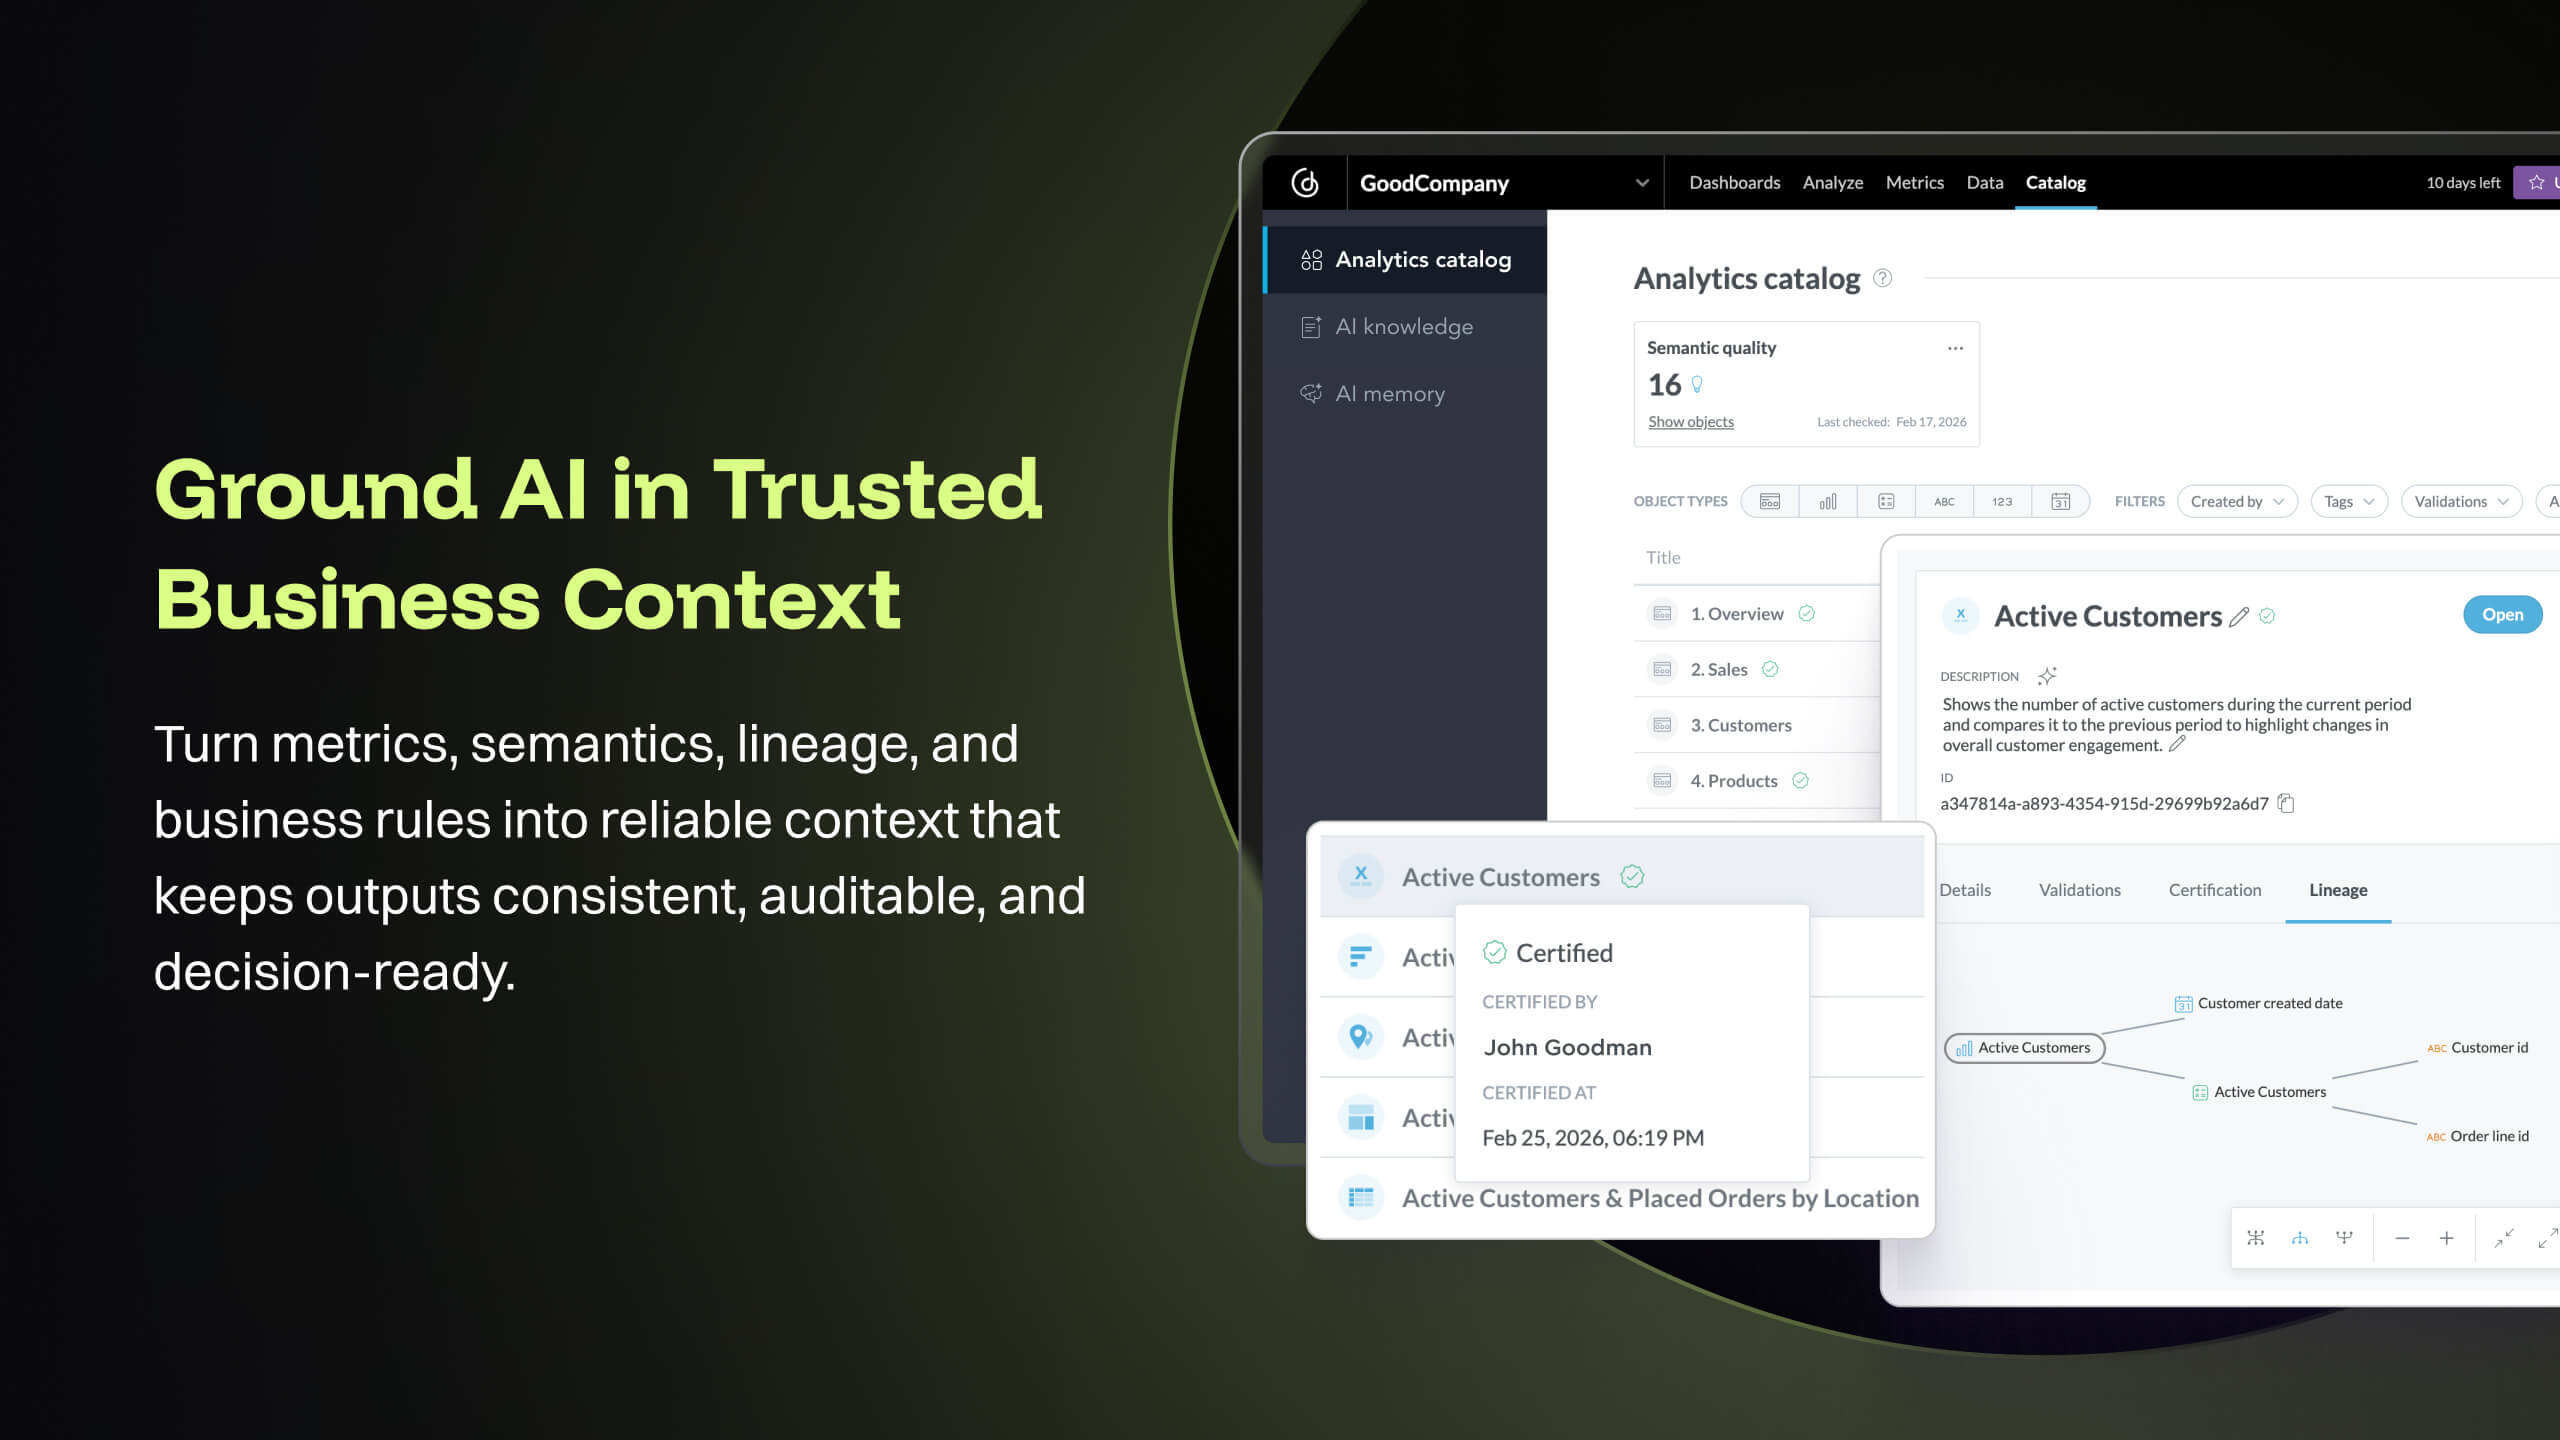
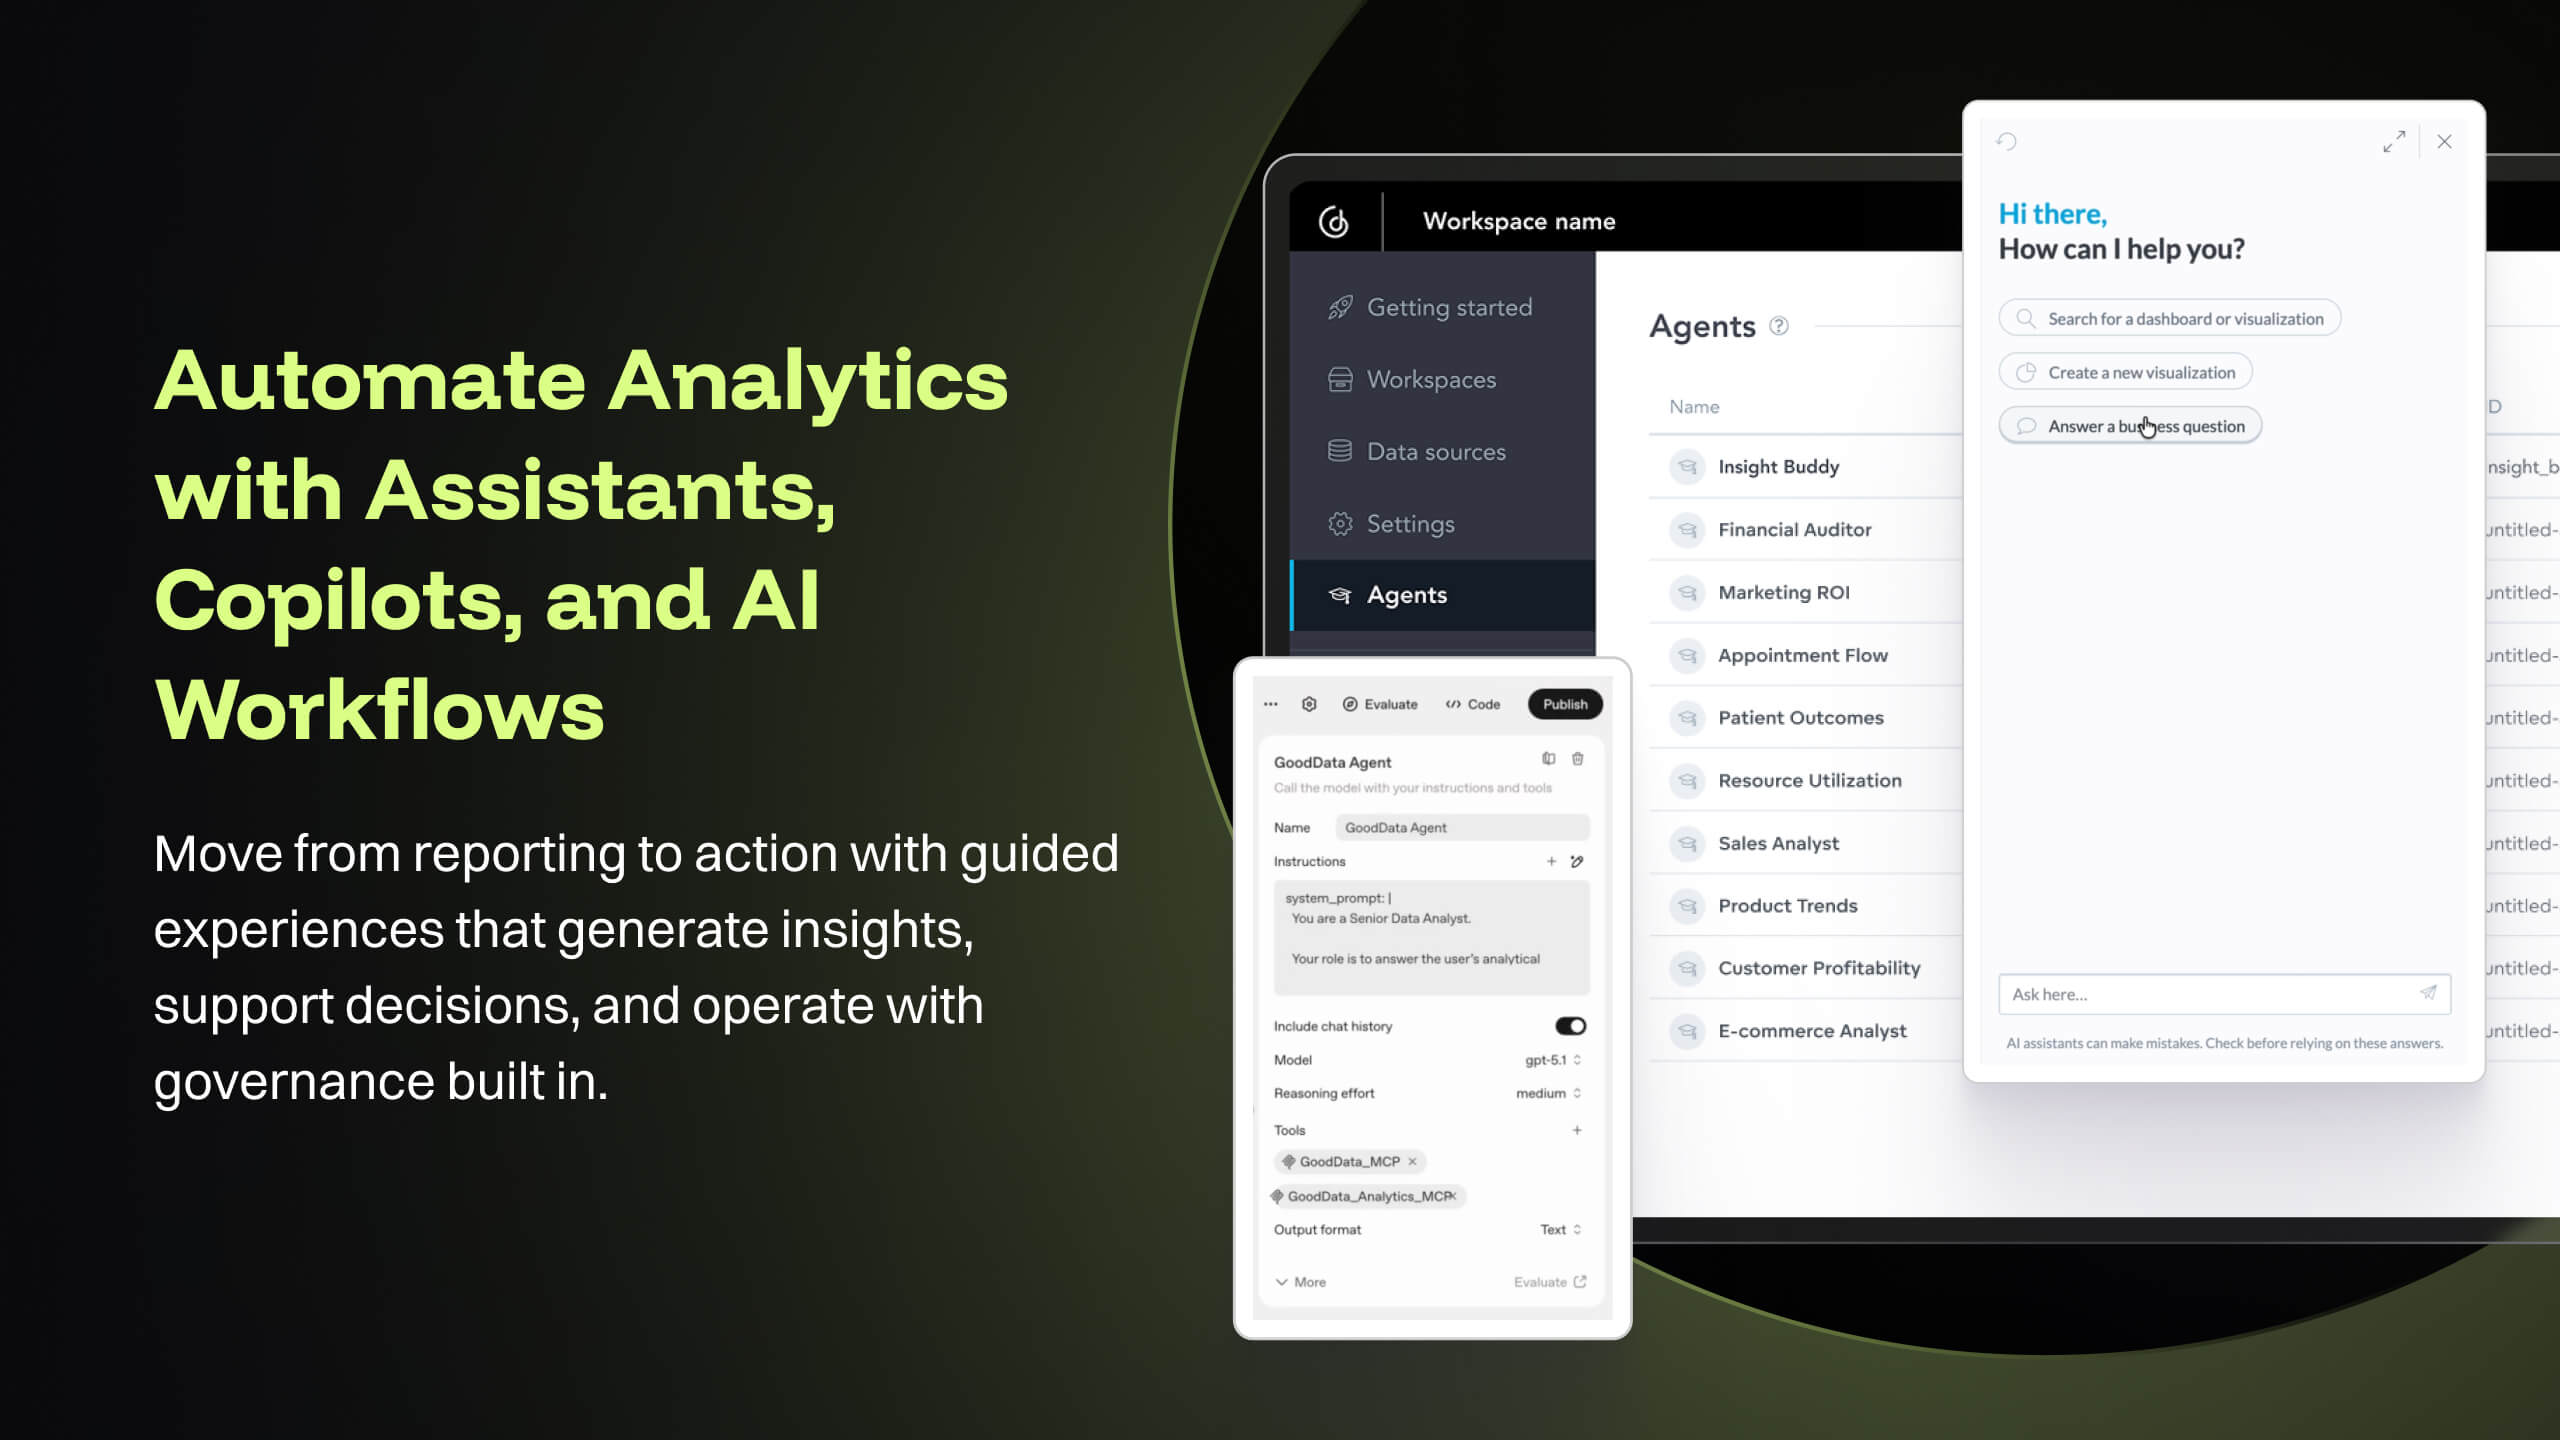
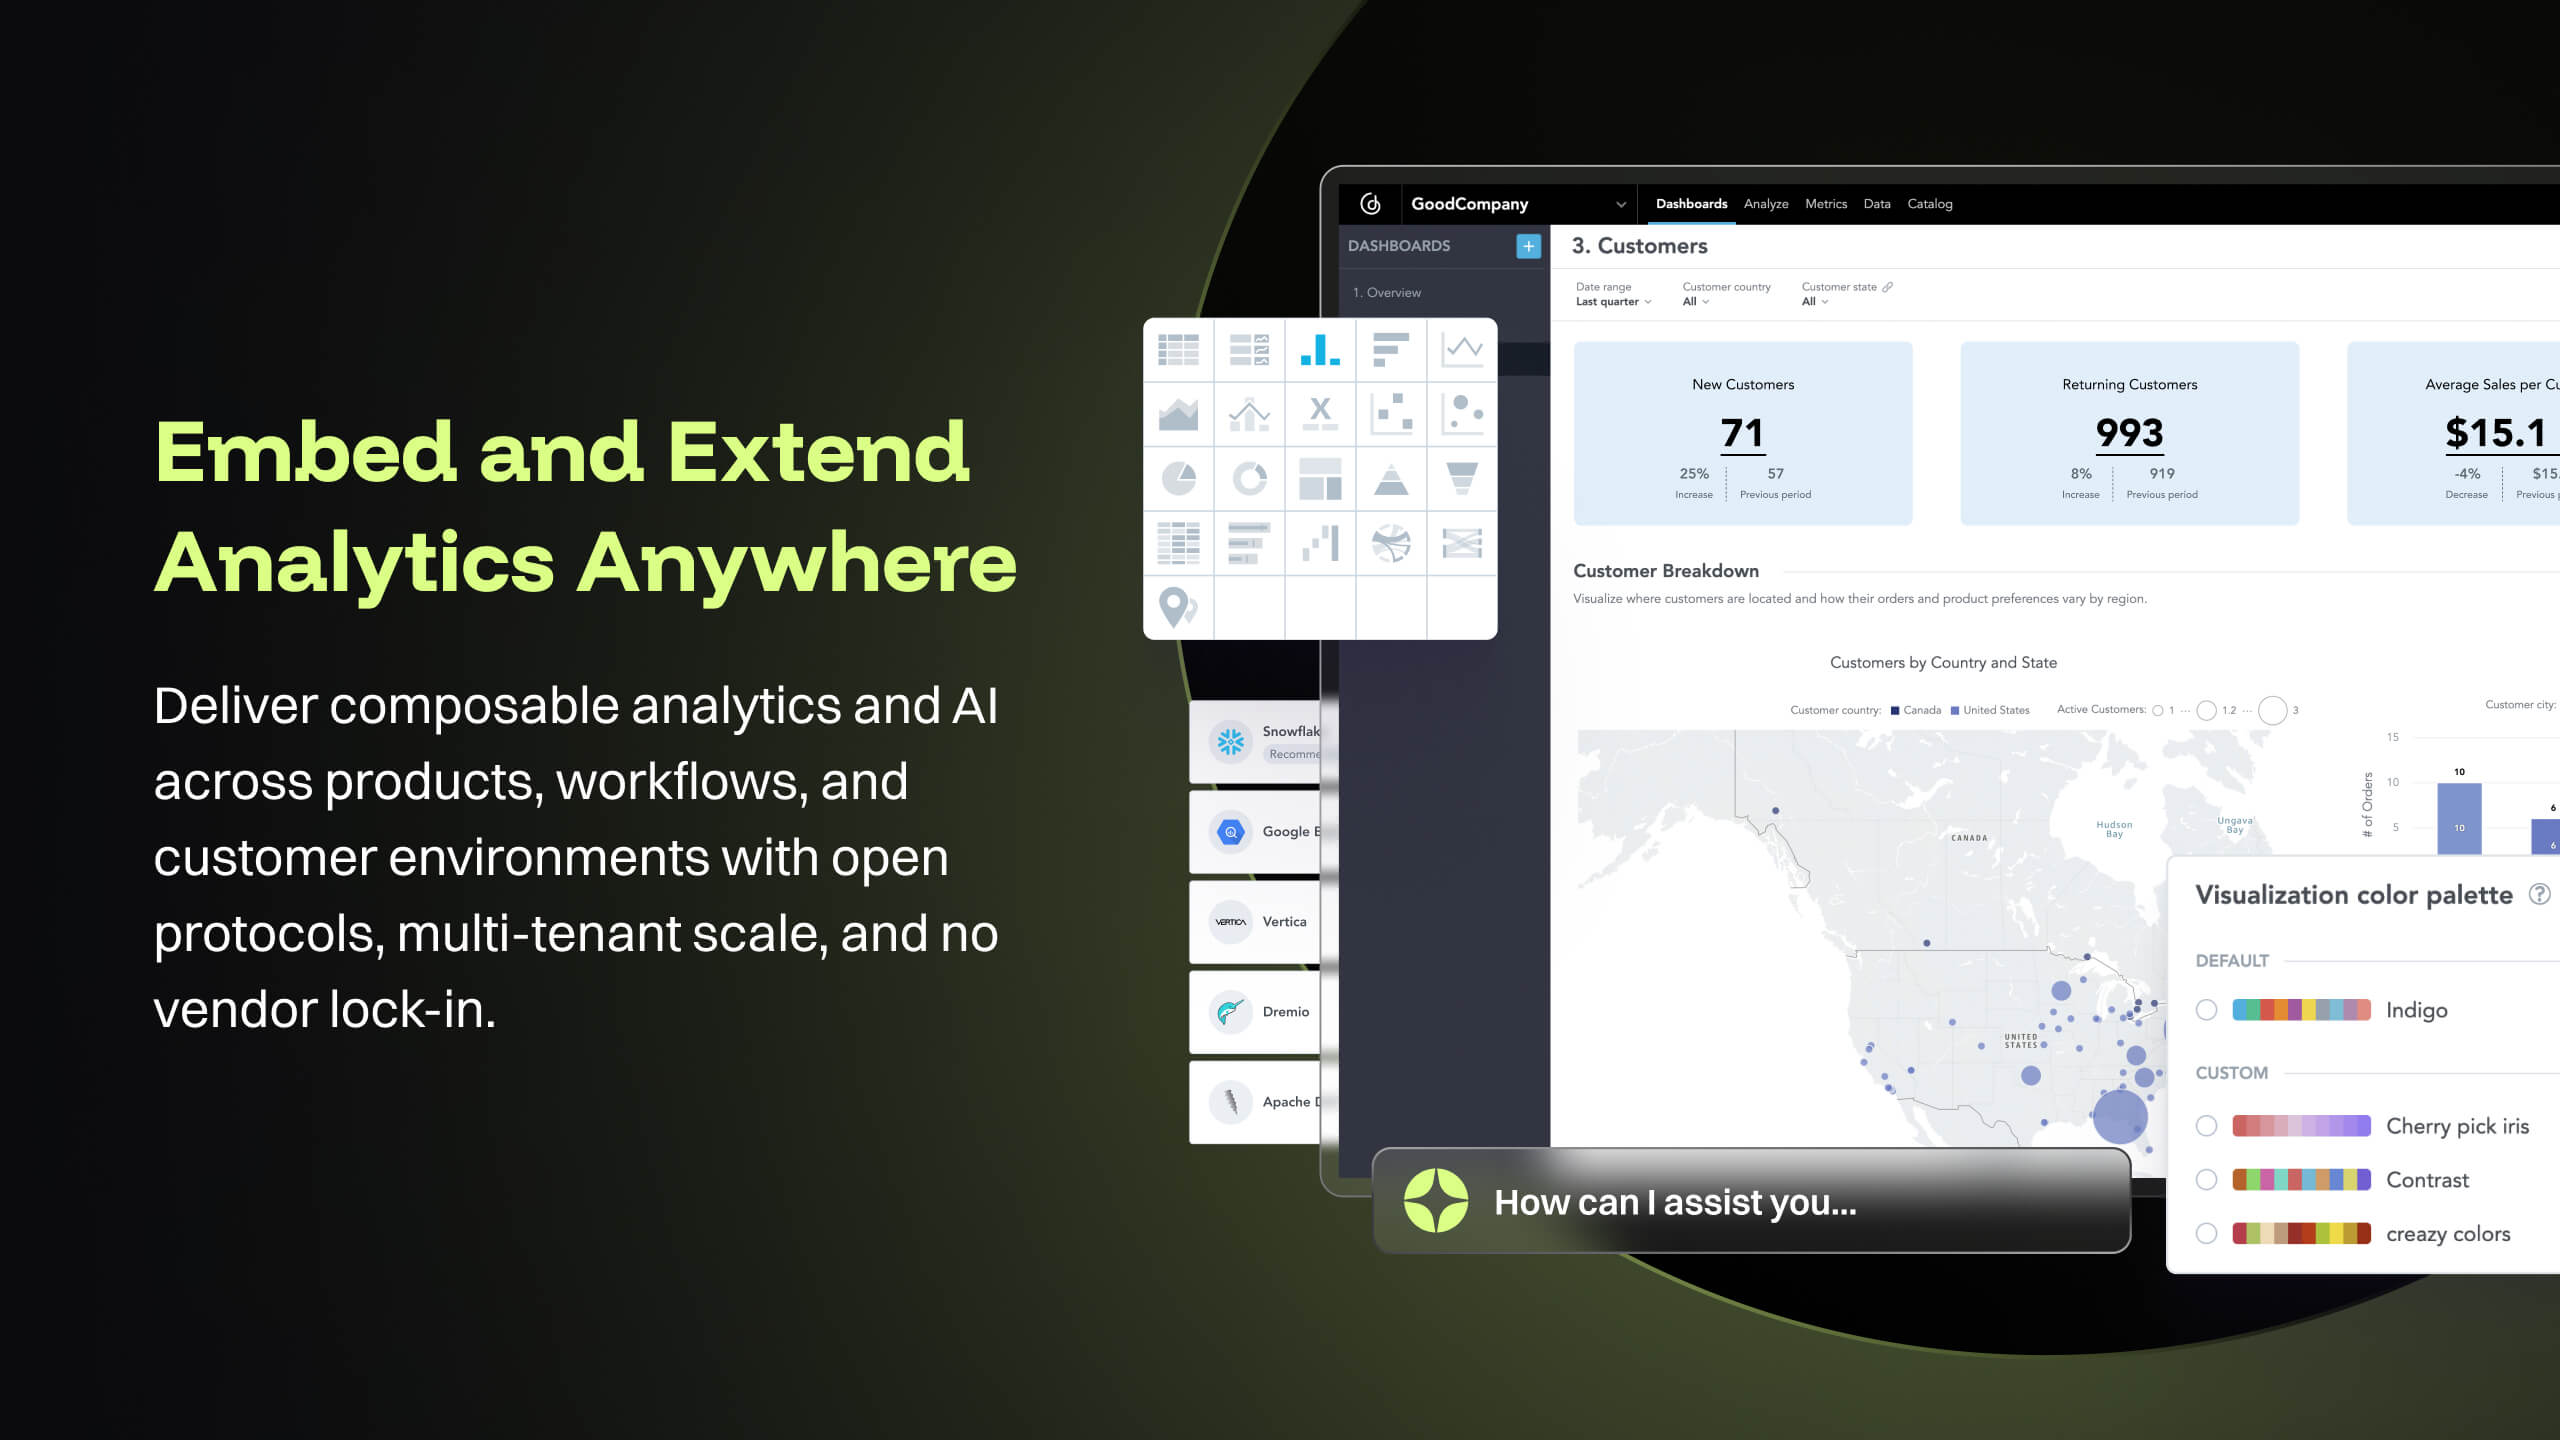
GoodData is an analytics platform used by organizations to deliver real-time, governed insights, embedded into products, customized for users, and integrated into any data environment.
N/A
Panorama Necto
Score 8.0 out of 10
N/A
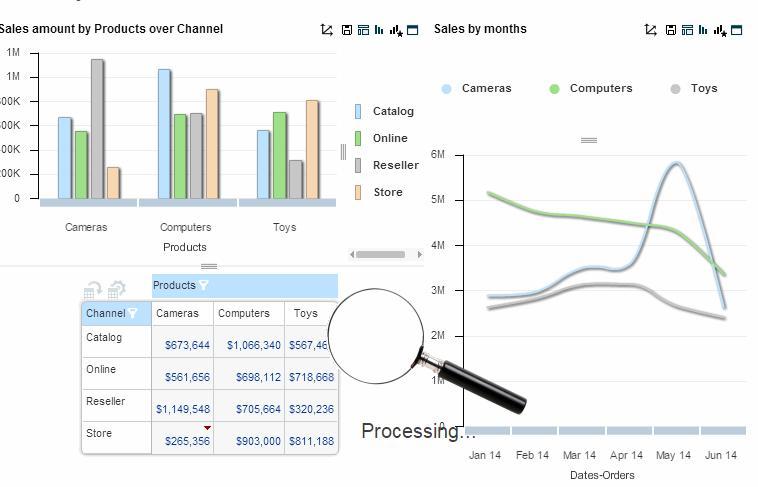
Panorama Necto is a business intelligence solution that provides enterprises with new ways to collaborate and create unique contextual connections. Some key features include: Workboards/Dashboards, Advanced Analytics, and Contextual Discovery.
We did our investigation years ago and I wasn't the one leading it but what I do remember was that GoodData had the best balance of price compared to infrastructure demand while not compromising on the power of available features around insight and dashboarding
GoodData is easier to understand and designed to detail critical data within a dashboard system. Visualization is essential, and the filters are quite varied. Metrics are also easy to use, so users only need to think a little more carefully about setting up the SQL required for …
Embedding flexibility was the main reason we chose GoodData. Interactivity, customization options, and programmatic ability were all very important to us and GoodData's embedding via React SDK offers exactly that. Implementation time was 50% shorter with GoodData than with …
GoodData seems less user friendly and doesn't provide that many visualization options so we are slowly moving to other solution in part of the company. There are still teams that plan to continue with GoodData and use React code in orther to supply missing functions.
I was not a part of the process to choose GoodData. From other teammates: the ability to really control the look of pixel perfect dashboards was important.
GoodData is much more customisable in our case so we choose this. Also when it comes to pricing part GoodData is the best economically as well and in terms of features and functionalities. As compared to others similar products I believe that GoodData is much more reliable with …
GoodData has been proven best for us as it has given the most accurate analytical insights on our data. I've used other tools too but no one has been this good in terms of reporting, handling data, decision making. Using GoodData for almost every organisational decision and …
GoodData comparing to other platform is very easy to use, customer support and on-boarding support. Set of features, speed of integration in our platform. Also great benefit for us was very competetive pricing.
All of the tools have their plusses and minuses. The one thing that stands out with Qlik is that it allows for two-way API integrations with Salesforce. This means that analytics reporting results can interact with the Salesforce application.
The primary reasons GoodData was selected was data modeling capability, ability to standardize complex metrics, quality of viaualization and multi-tenancy
GoodData cloud has been on an upward trend in terms of speed of improvements and new features. It is easier to maintain and mange than most other products in terms of the behind the scenes updates etc however the hosted nature of the dashboards does reduce the flexibility to …
GoodData provides the largest amount of OOB features that meet our end-user needs. It means a lot that we don't need to perform development on our own. At some point, it may make sense to take items in house, but its hte best current fit.
I have used all softwares in my past 10 years of experience. GoodData stands out with its seamless data integration, advanced predictive analytics, and collaborative features. Unlike Tableau and Power BI, GoodData offers scalable solutions with a user-friendly interface for …
Choosing between GoodData and other platforms was clear for me as the superiority of GoodData over others due to our needs. GoodData stands out for its awesome dashboards, robust predictive analytics, reports, and analysis. Data integration helps us for business intelligence …
Tableau is fantastic for visuals, and Zoho Analytics is user-friendly, but GoodData takes the cake with its seamless integration and powerful analytics. It stacks up well because it's not just about pretty graphs but it's about making data work for you. It's the perfect fit for …
GoodData is best among every other platform I used because it's a cloud based platform and way to easy to use. Its robust predictive analytics and unified data view set it way apart. While Power BI and Tableau excel in visualization, GoodData's focus on comprehensive business …
More visually enriched infographics and geo analytics and lower license cost means Panorama is a front runner in comparison to the tools mentioned above.
This is the next generation BI tool, which will be very helpful for small and medium businesses to kick start data exploration and visualization of their diverse databases, with less intervention from IT. This tool is more end user centric and gives way more power to the end …
Micro strategy and SAP business objects require building cubes. This requires lots of SQL language and a need to export them to a repository so they can be used to build ad hoc reports. They have to be scheduled to view or analyse the data in Excel or PowerPoint or PDF formats. …
One of the best tools in the market available today. I started getting attached to this tool recently and this never stops amazing me. I can connect to a variety of data sources and quickly analyze my data. The best part of this product is the built-in intelligence system which …
We can visualize the data right away in Necto. Where as we have to create reports in SAP Business Objects to present it to the business user. The reports have to be scheduled at particular time to get the presentation. We need to have additional SDK code for SAP Business …
We have evaluated few small vendor's BI tools for reporting purposes. Among other BI tools, we found Necto is quite easy to use and provides very good data visualization. Also it provides collaboration features which are least supported by other BI tools.
QA Lead & Test Analyst Disney Consumer Products for Satwic Inc
Chose Panorama Necto
In comparison with Pentaho Business Analytics, Panorama Necto 14 is providing similar features where it is distinguished through its provision of a suggestive analytics feature. This is fairly unique to the Panorama Necto 14 software where it analyzes information from various …
We are evaluating different data visualization tools and recently I tried Panorama Necto. I was really amazed with this product as it's a new age technology and powerful tool for visualizing data, creating reports. It comes with Infographics which is great and best unique …
All the above mentioned BI tools are complex from a maintenance perspective. They are not easy to learn. All those BI tools have limited cloud based reporting capability. Whereas Necto is a fully web based self service BI tool. It's collaborative capability makes it stack up …
It provides attractive info-graphics according to user's interest. Their visual materiels are modern and stylish. You can use the same dashboard everywhere. Necto always keeps you up-to-date through mobile devices. It gives you many automated analysis and recommendations …
Collaboration on data is super powerful in the case of Necto and wins all the medals compared to other BI tools. The real time analysis for decision making is extremely easy and just a click away, which is really not a smooth case for other BI tools.
If you have consistently formatted data, that you want regular reports on, plus flexibility to let end users build their own reports, GoodData is perfect. Especially if your end users are less technical. If you want to be able to embed your reporting into your app, GoodData excels, though the start up process can be involved. If your data structure varies, it could be more challenging to integrate. It may also not be worth the integration if you have people who can already run their own SQL queries.
How efficient is the tool for error handling capabilities? - In this case Panorama Necto has a unique feature of exceptional error handling capability and conditional error alerts that can be sent to stakeholders via email. An important question to ask while selecting any BI tool is, how good is the support? Panorama Necto has a group of highly knowledgeable and responsible support team members. The online video tutorials are very helpful and it's easy to learn this tool. This tool is very cost effective.
GoodData helps in simplifying complex data into easy-to-understand visuals. We can create personalized dashboards & tailor them as per requirements. This data can be used from an executive level employee to a team lead employee in the business
GoodData is a very user friendly platform. The collaborative features simplify sharing and discussing reports among team members which promotes a culture of data-driven decision-making.
GoodData connects with various data sources and consolidate information from multiple platforms. This flexibility proves invaluable for businesses dealing with data spread across different systems as they can access large amount of data on a single platform.
Comes with lot of option to modify and build the smart infographic. Uses innovative pictures and charts to create the dashboards
Helps you identify why you are succeeding and where you should shift your focus to.
The maps are amazing and they just don’t act as control points rather you can populate various measures on them making it really efficient to understand the business in geographical info graph
Because gooddata really helps us in processing data to make reports or dashboards. So we are very satisfied when we use it. What we like is the flexible use of charts. We change at will the use of charts to display in reports or dashboards. Thank you Gooddata for helping companies like us who need flexibility in usage
Some features are very basic and sometimes you can't add your own SQL query for custom reports. For Macs and Blackberry users this application is not helpful. Non-languages are not supported in info-graphics. They need to improve their forecast analysis. Report sharing is limited among the portal users only
From my experience, overall usability of GoodData platform is great very easy to use, but there is still few features as GoodData platform and interface continuosly evolves, which are not yet available within user interface, but only available via API. For regular users all main and key features and tools are perfect, well defined and very easy to use.
It provides all the features that are required and some that are not the basic requirements, but they represent a great additional capabilities, not available within the similar products
The fast and comprehensive responses we got from GoodData regarding the doubts we had experienced while starting to use the products and metrics were of great help in ensuring the metrics we were obtaining were accurate to what we wanted to know about our customers' experience and our product areas of opportunity.
Implementations are hard and we had limited technical resources. We relied too heavily on GD care team. When we found technical gaps, they weren't simple to overcome
We did our investigation years ago and I wasn't the one leading it but what I do remember was that GoodData had the best balance of price compared to infrastructure demand while not compromising on the power of available features around insight and dashboarding
In comparison with Pentaho Business Analytics, Panorama Necto 14 is providing similar features where it is distinguished through its provision of a suggestive analytics feature. This is fairly unique to the Panorama Necto 14 software where it analyzes information from various data sources and recommends solutions based on historical review