Google Charts provides a way to visualize data on your website - for free. From simple line charts to complex hierarchical tree maps, the chart gallery provides a large number of ready-to-use chart types. The most common way to use Google Charts is with simple JavaScript that you embed in your web page.
N/A
Maia by Matillion
Score8.5 out of 10
N/A
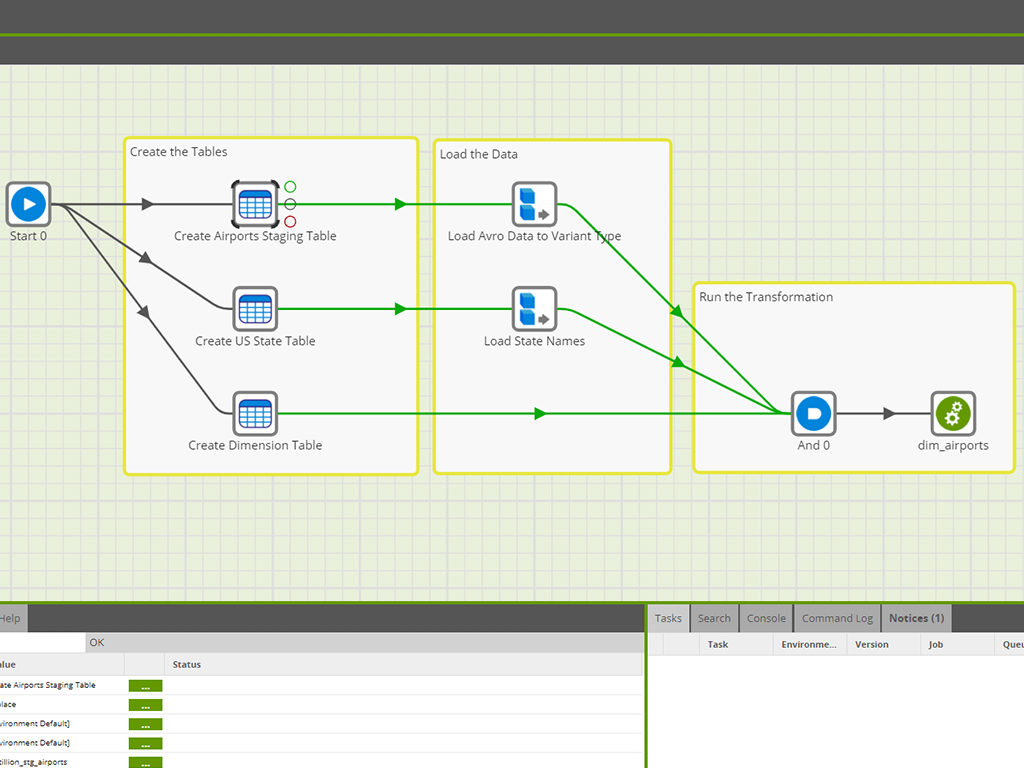
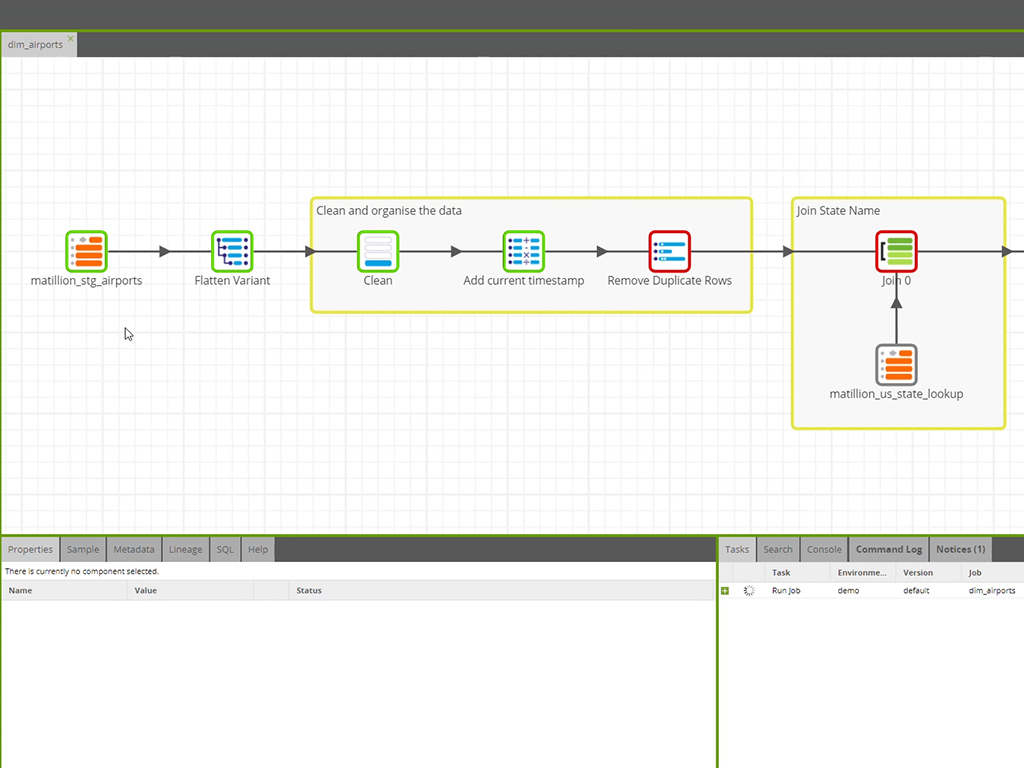
Maia by Matillion is an autonomous data engineering platform designed to automate the lifecycle of data pipelines through AI-driven orchestration. The solution functions as an enterprise "digital workforce" that translates natural language requirements into production-ready DataPipelines, leveraging a Pushdown Architecture to execute transformations natively within cloud data warehouses.
N/A
Pricing
Google Charts
Maia by Matillion
Editions & Modules
No answers on this topic
No answers on this topic
Offerings
Pricing Offerings
Google Charts
Maia by Matillion
Free Trial
No
Yes
Free/Freemium Version
Yes
No
Premium Consulting/Integration Services
No
Yes
Entry-level Setup Fee
No setup fee
No setup fee
Additional Details
—
Billed directly via cloud marketplace on an hourly basis, with annual subscriptions available depending on the customer's cloud data warehouse provider.
We can easily recommend Google Charts to any company that needs a way to visually represent their data. Another great thing about Google Charts is that it is free to use and does not require any membership fees. Although it requires a skilled used to be able to use the charts, the results are great and can be beneficial to any company who is looking to make better decisions.
Great: Need to query simpler APIs, or utilize well known services such as GSheets etc.? Matillion has got some of the best and easiest to use connectors out there. Not so great: Do you need have a competent CI/CD flow that you will be able to update / compare from Matillion as well as other sources at the same time? Good luck, you will need to be extra careful, as you might have to have a deeper dive into your servers Terminal each time you have a git conflict.
A de minimis incentive was given to thank the reviewer for their time. The incentive was not used to bias or drive a particular response, nor was the incentive contingent on a positive endorsement. TR verified that a representative sample of customers was invited. More Info
they're free with Google suite and they have backing in terms of powerful Google apps which can be plugged in to perform multiple actions like using Google sheets to import raw data into Google Charts
they're the most simple app to use when it comes to creating charts and visual dashboards
ease of customization
ease of using custom APIs from developers side to help make any types of charts and dashboards you want
A de minimis incentive was given to thank the reviewer for their time. The incentive was not used to bias or drive a particular response, nor was the incentive contingent on a positive endorsement. More Info
A de minimis incentive was given to thank the reviewer for their time. The incentive was not used to bias or drive a particular response, nor was the incentive contingent on a positive endorsement. TR verified that a representative sample of customers was invited. More Info
I would like a couple more introductory videos or a live chat option for when you run into an issue. I think this is a Google-wide problem, not only linked to Google Charts.
I have run into some issues with the Dynamic Data but also admittedly could potentially dive in deeper and investigate.
It would be great if Google Charts made it possible to integrate Google Chat into the platform.
A de minimis incentive was given to thank the reviewer for their time. The incentive was not used to bias or drive a particular response, nor was the incentive contingent on a positive endorsement. More Info
Matillion is brilliant at importing data -- it would be amazing to have more ways to export data, from emailed exports to API pushes.
Any Python that takes more than a few lines of code requires an external server to run it. It would be great to have more integration (perhaps in a connected virtual environment) to easily integrate customized code.
Troubleshooting server logs requires quite a bit of technical expertise. More human readable detailed error handling would be greatly appreciated.
A de minimis incentive was given to thank the reviewer for their time. The incentive was not used to bias or drive a particular response, nor was the incentive contingent on a positive endorsement. TR verified that a representative sample of customers was invited. More Info
Google Charts is a good product. It's widely supported with deep documentation and a large community. But for me, it wasn't customizable enough. When we started with simple charts, it was great, but as we got deeper and more complex, our needs outgrew the library. If I was going forward, I would choose a more barebones library with more freedom and extensibility.
A de minimis incentive was given to thank the reviewer for their time. The incentive was not used to bias or drive a particular response, nor was the incentive contingent on a positive endorsement. More Info
With the current experience of Matillion, we are likely to renew with the current feature option but will also look for improvement in various areas including scalability and dependability. 1. Connectors: It offers various connectors option but isn't full proof which we will be looking forward as we grow. 2. Scalability: As usage increase, we want Matillion system to be more stable.
A de minimis incentive was given to thank the reviewer for their time. The incentive was not used to bias or drive a particular response, nor was the incentive contingent on a positive endorsement. More Info
Google Charts is about as easy to use as the rest of their applications. The UI is very well thought out, allowing you to add what you need, and customize it to your exact liking. The default theme is actually really nice, which helps as most of the time, customizing is not needed.
A de minimis incentive was given to thank the reviewer for their time. The incentive was not used to bias or drive a particular response, nor was the incentive contingent on a positive endorsement. More Info
We are able to bring on new resources and teach them how to use Matillion without having to invest a significant amount of time. We prefer looking for resources with any type of ETL skill-set and feel that they can learn Matillion without problem. In addition, the prebuilt objects cover more than 95% of our use cases and we do not have to build much from scratch.
As a free tool with massively powerful, infinitely customisable charts that can be dynamically updated - Google Charts is my favourite data visualisation tool. However, my hatred of JavaScript does jade my view on it. This is the price of the tool though, and I'm glad it's available for me.
A de minimis incentive was given to thank the reviewer for their time. The incentive was not used to bias or drive a particular response, nor was the incentive contingent on a positive endorsement. More Info
Overall, I've found Matillion to be responsive and considerate. I feel like they value us as a customer even when I know they have customers who spend more on the product than we do. That speaks to a motive higher than money. They want to make a good product and a good experience for their customers. If I have any complaint, it's that support sometimes feels community-oriented. It isn't always immediately clear to me that my support requests are going to a support engineer and not to the community at large. Usually, though, after a bit of conversation, it's clear that Matillion is watching and responding. And responses are generally quick in coming.
A de minimis incentive was given to thank the reviewer for their time. The incentive was not used to bias or drive a particular response, nor was the incentive contingent on a positive endorsement. More Info
A de minimis incentive was given to thank the reviewer for their time. The incentive was not used to bias or drive a particular response, nor was the incentive contingent on a positive endorsement. More Info
Google Charts stacks up better since it is free and does not have the constant pressure for cost overruns, add-ons, annual maintenance and implementation services. The speed of using Google Charts is quick, saving users potentially weeks in getting up and going. For the readers of websites with limited resources, the application shows up nicely is look and feel with charts. Great way of showing data visually.
A de minimis incentive was given to thank the reviewer for their time. The incentive was not used to bias or drive a particular response, nor was the incentive contingent on a positive endorsement. More Info
Fivetran offers a managed service and pre-configured schemas/models for data loading, which means much less administrative work for initial setup and ongoing maintenance. But it comes at a much higher price tag. So, knowing where your sweet spot is in the build vs. buy spectrum is essential to deciding which tool fits better. For the transformation part, dbt is purely (SQL-) code-based. So, it is mainly whether your developers prefer a GUI or code-based approach.
A de minimis incentive was given to thank the reviewer for their time. The incentive was not used to bias or drive a particular response, nor was the incentive contingent on a positive endorsement. TR verified that a representative sample of customers was invited. More Info
We're using Matillion on EC2 instances, and we have about 20 projects for our clients in the same instance. Sometimes, we're struggling to manage schedules for all projects because thread management is not visible, and we can't see the process at the instance level.
A de minimis incentive was given to thank the reviewer for their time. The incentive was not used to bias or drive a particular response, nor was the incentive contingent on a positive endorsement. More Info
A de minimis incentive was given to thank the reviewer for their time. The incentive was not used to bias or drive a particular response, nor was the incentive contingent on a positive endorsement. More Info
A de minimis incentive was given to thank the reviewer for their time. The incentive was not used to bias or drive a particular response, nor was the incentive contingent on a positive endorsement. TR verified that a representative sample of customers was invited. More Info