Grafana vs. ThoughtSpot
Grafana vs. ThoughtSpot
| Product | Rating | Most Used By | Product Summary | Starting Price |
|---|---|---|---|---|
 Grafana | N/A | Grafana is a data visualization tool developed by Grafana Labs in New York. It is available open source, managed (Grafana Cloud), or via an enterprise edition with enhanced features. Grafana has pluggable data source model and comes bundled with support for popular time series databases like Graphite. It also has built-in support for cloud monitoring vendors like Amazon Cloudwatch, Microsoft Azure and SQL databases like MySQL. Grafana can combine data from many places into a single dashboard. | $0 | |
 ThoughtSpot | N/A | ThoughtSpot is an Agentic Analytics Platform for enterprises where users ask data questions using natural language and get answers with AI. Code-first for data teams and code-free for business users, ThoughtSpot can handle large, complex cloud data at scale. | $1,500 per year (5 users) |
| Grafana | ThoughtSpot | |||||||||||||||
|---|---|---|---|---|---|---|---|---|---|---|---|---|---|---|---|---|
| Editions & Modules |
|
| ||||||||||||||
| Offerings |
| |||||||||||||||
| Entry-level Setup Fee | No setup fee | Optional | ||||||||||||||
| Additional Details | — | — | ||||||||||||||
| More Pricing Information | ||||||||||||||||
| Grafana | ThoughtSpot |
|---|
| Grafana | ThoughtSpot | |||||||||||||||||||||
|---|---|---|---|---|---|---|---|---|---|---|---|---|---|---|---|---|---|---|---|---|---|---|
| BI Standard Reporting |
| |||||||||||||||||||||
| Ad-hoc Reporting |
| |||||||||||||||||||||
| Report Output and Scheduling |
| |||||||||||||||||||||
| Data Discovery and Visualization |
| |||||||||||||||||||||
| Access Control and Security |
| |||||||||||||||||||||
| Mobile Capabilities |
| |||||||||||||||||||||
| Application Program Interfaces (APIs) / Embedding |
|
| Grafana | ThoughtSpot | |
|---|---|---|
| Small Businesses |  Supermetrics Score 9.7 out of 10 |  Yellowfin Score 8.7 out of 10 |
| Medium-sized Companies | Supermetrics Score 9.7 out of 10 |  Reveal Score 10.0 out of 10 |
| Enterprises |  IBM Analytics Engine Score 7.2 out of 10 |  Kyvos Semantic Layer Score 9.5 out of 10 |
| All Alternatives | View all alternatives | View all alternatives |
| Grafana | ThoughtSpot | |
|---|---|---|
| Likelihood to Recommend | 9.4 (7 ratings) | 8.6 (91 ratings) |
| Likelihood to Renew | - (0 ratings) | 10.0 (6 ratings) |
| Usability | 9.6 (3 ratings) | 8.3 (85 ratings) |
| Availability | - (0 ratings) | 9.0 (3 ratings) |
| Performance | - (0 ratings) | 8.0 (3 ratings) |
| Support Rating | - (0 ratings) | 8.0 (4 ratings) |
| In-Person Training | - (0 ratings) | 5.0 (1 ratings) |
| Online Training | - (0 ratings) | 4.0 (1 ratings) |
| Implementation Rating | - (0 ratings) | 7.0 (2 ratings) |
| Configurability | - (0 ratings) | 8.0 (1 ratings) |
| Ease of integration | - (0 ratings) | 9.0 (1 ratings) |
| Product Scalability | - (0 ratings) | 8.0 (3 ratings) |
| Vendor post-sale | - (0 ratings) | 8.0 (1 ratings) |
| Vendor pre-sale | - (0 ratings) | 9.0 (1 ratings) |
| Grafana | ThoughtSpot | |
|---|---|---|
| Likelihood to Recommend | Grafana Labs
| ThoughtSpot
|
| Pros | Grafana Labs
| ThoughtSpot
|
| Cons | Grafana Labs
 ANurag Tamrakar Software Engineer - DevOps | ThoughtSpot
|
| Likelihood to Renew | Grafana Labs No answers on this topic | ThoughtSpot
|
| Usability | Grafana Labs
| ThoughtSpot
|
| Reliability and Availability | Grafana Labs No answers on this topic | ThoughtSpot
|
| Performance | Grafana Labs No answers on this topic | ThoughtSpot
|
| Support Rating | Grafana Labs No answers on this topic | ThoughtSpot
|
| In-Person Training | Grafana Labs No answers on this topic | ThoughtSpot
|
| Online Training | Grafana Labs No answers on this topic | ThoughtSpot
|
| Implementation Rating | Grafana Labs No answers on this topic | ThoughtSpot
 Surya Ravi BI Solutions Engineer |
| Alternatives Considered | Grafana Labs
| ThoughtSpot
 Torsten Wiegel Augmented Analytics Consultant |
| Scalability | Grafana Labs No answers on this topic | ThoughtSpot
|
| Return on Investment | Grafana Labs
| ThoughtSpot
 Chris Mann VP Product Strategy |
| ScreenShots | ThoughtSpot Screenshots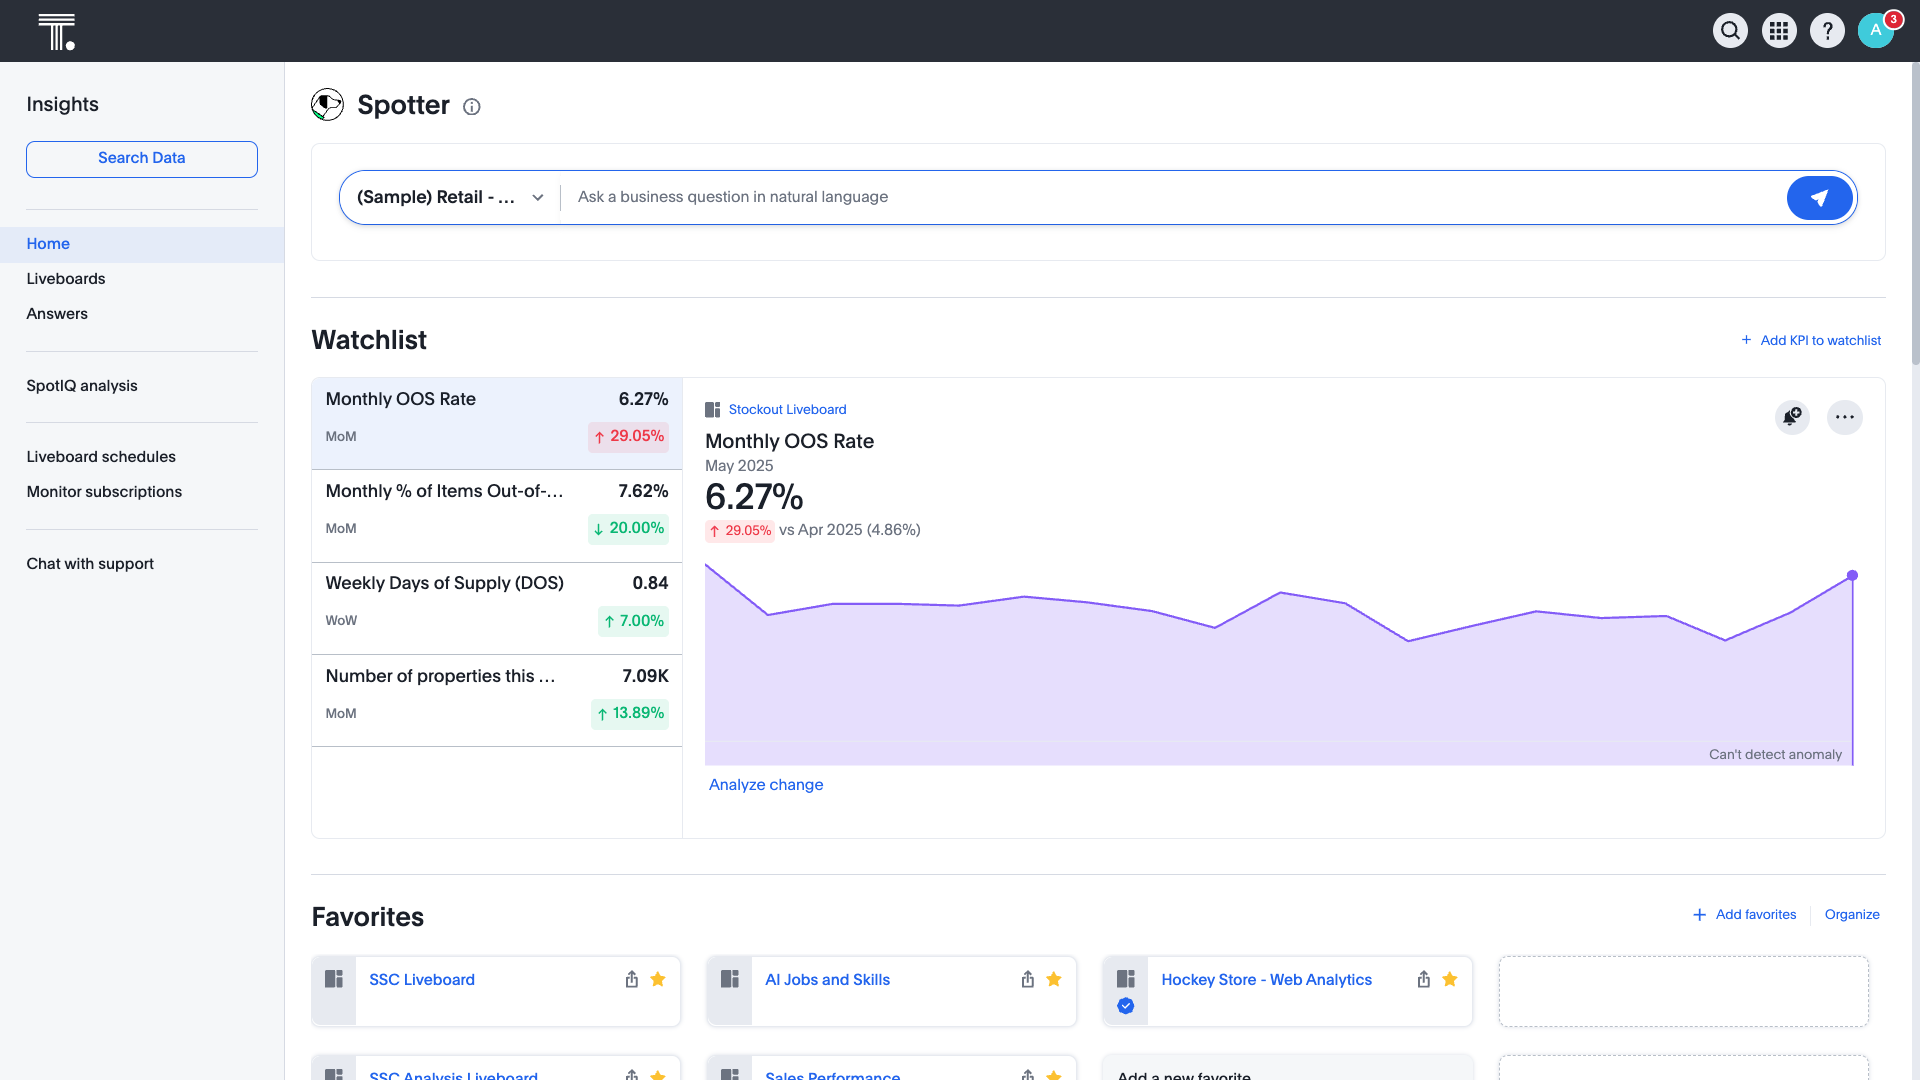  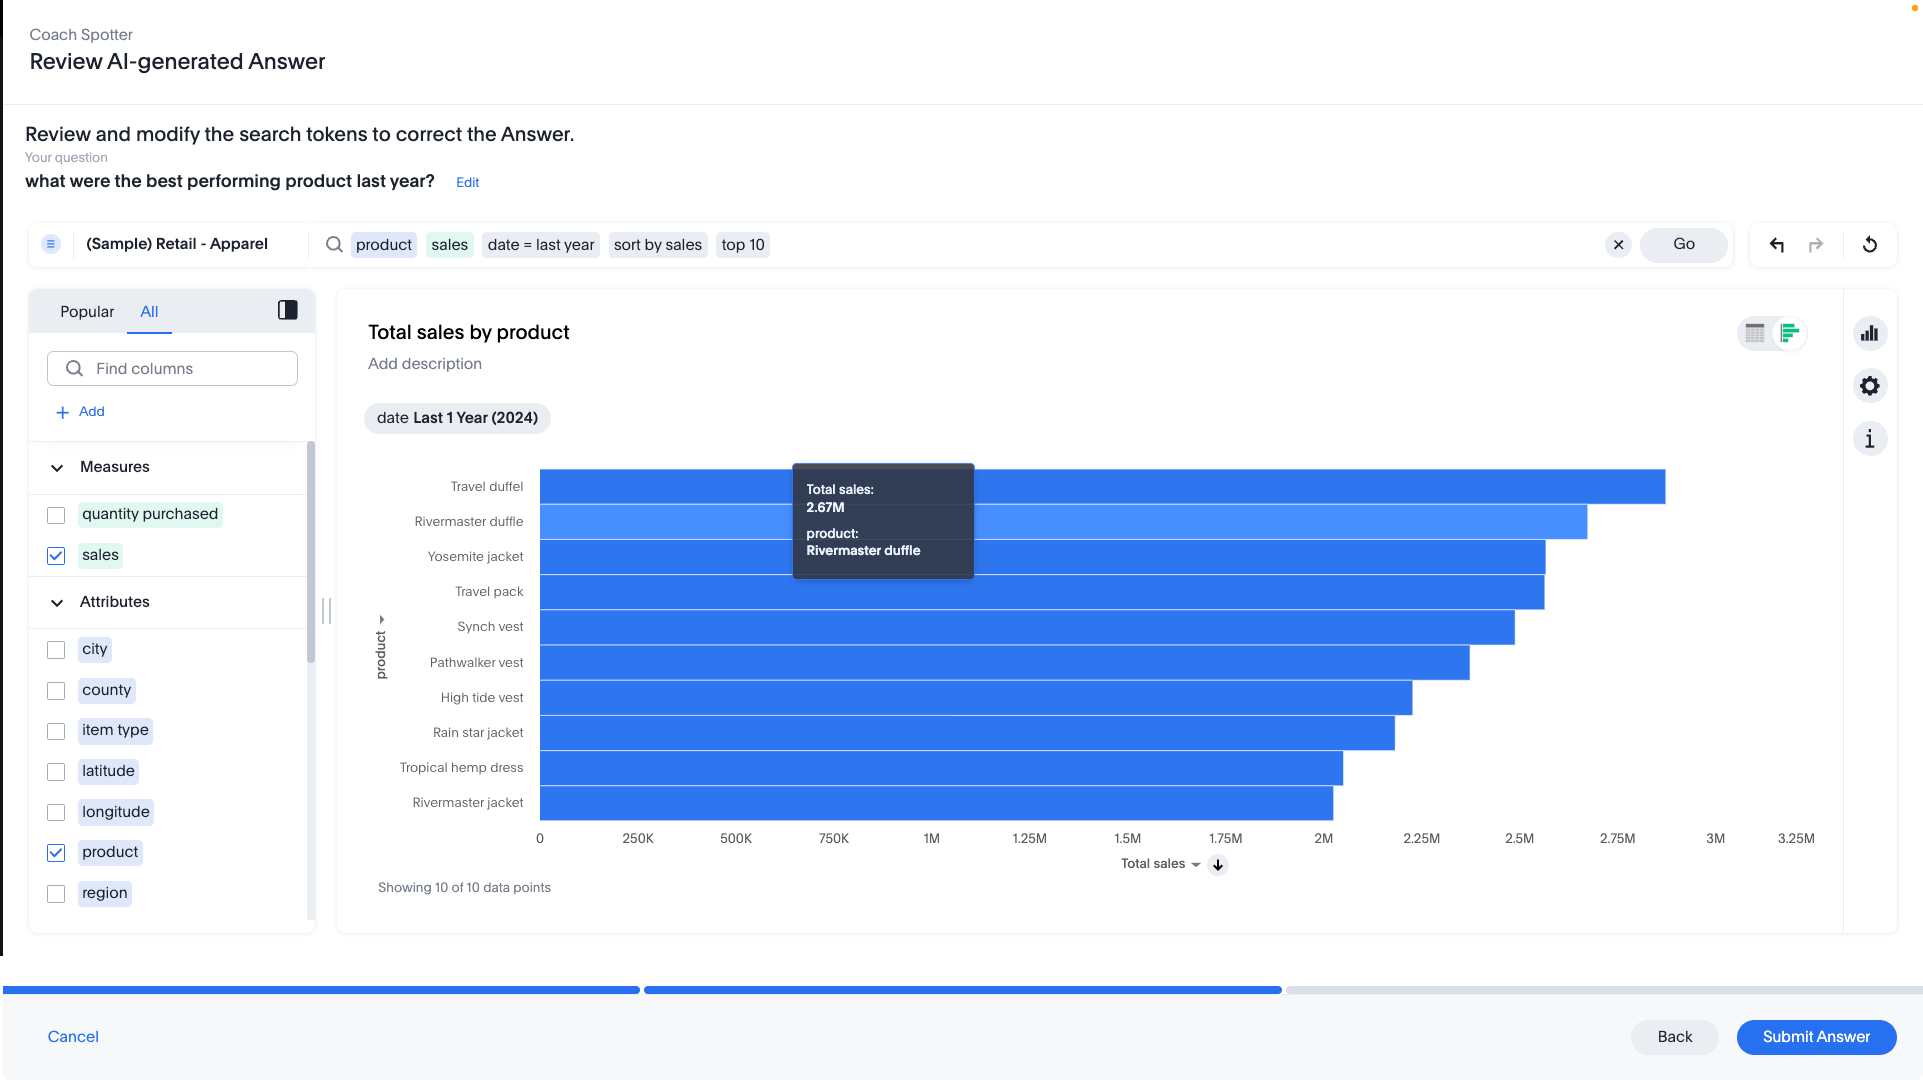 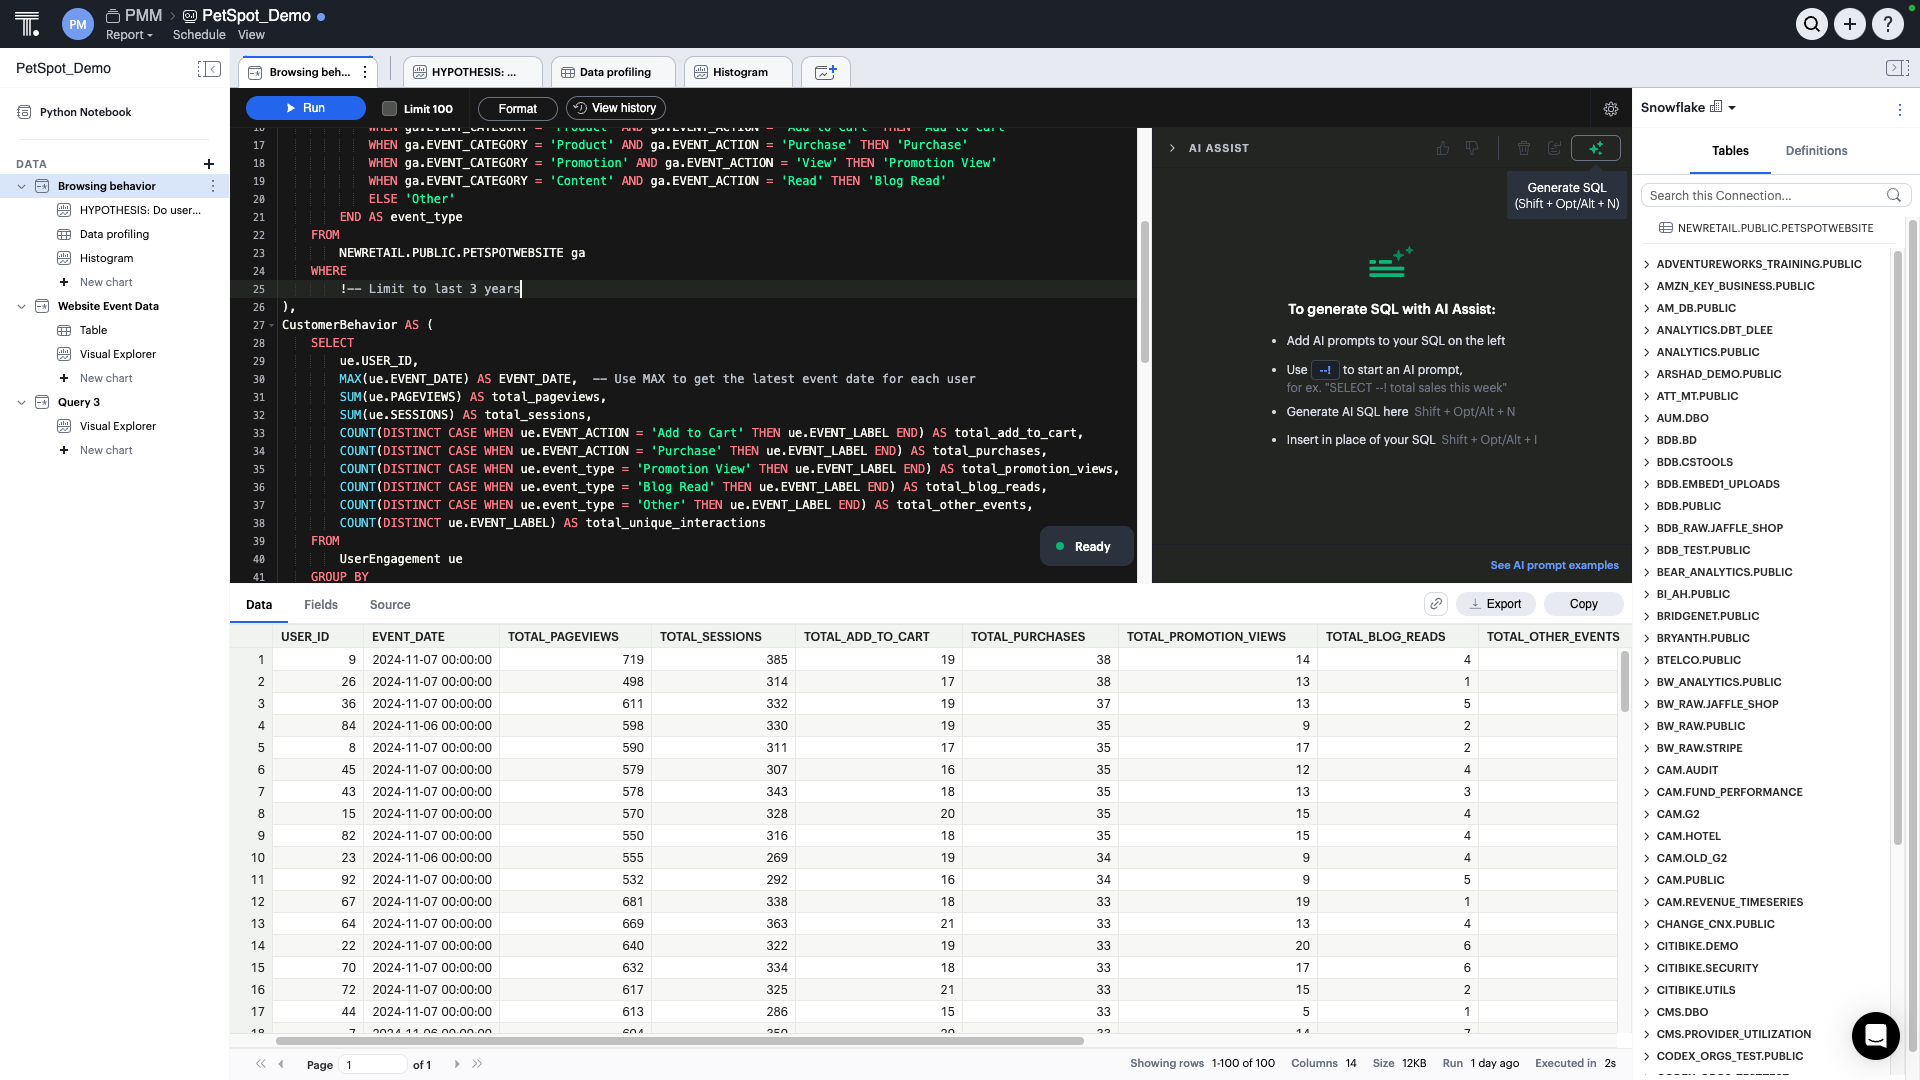  |