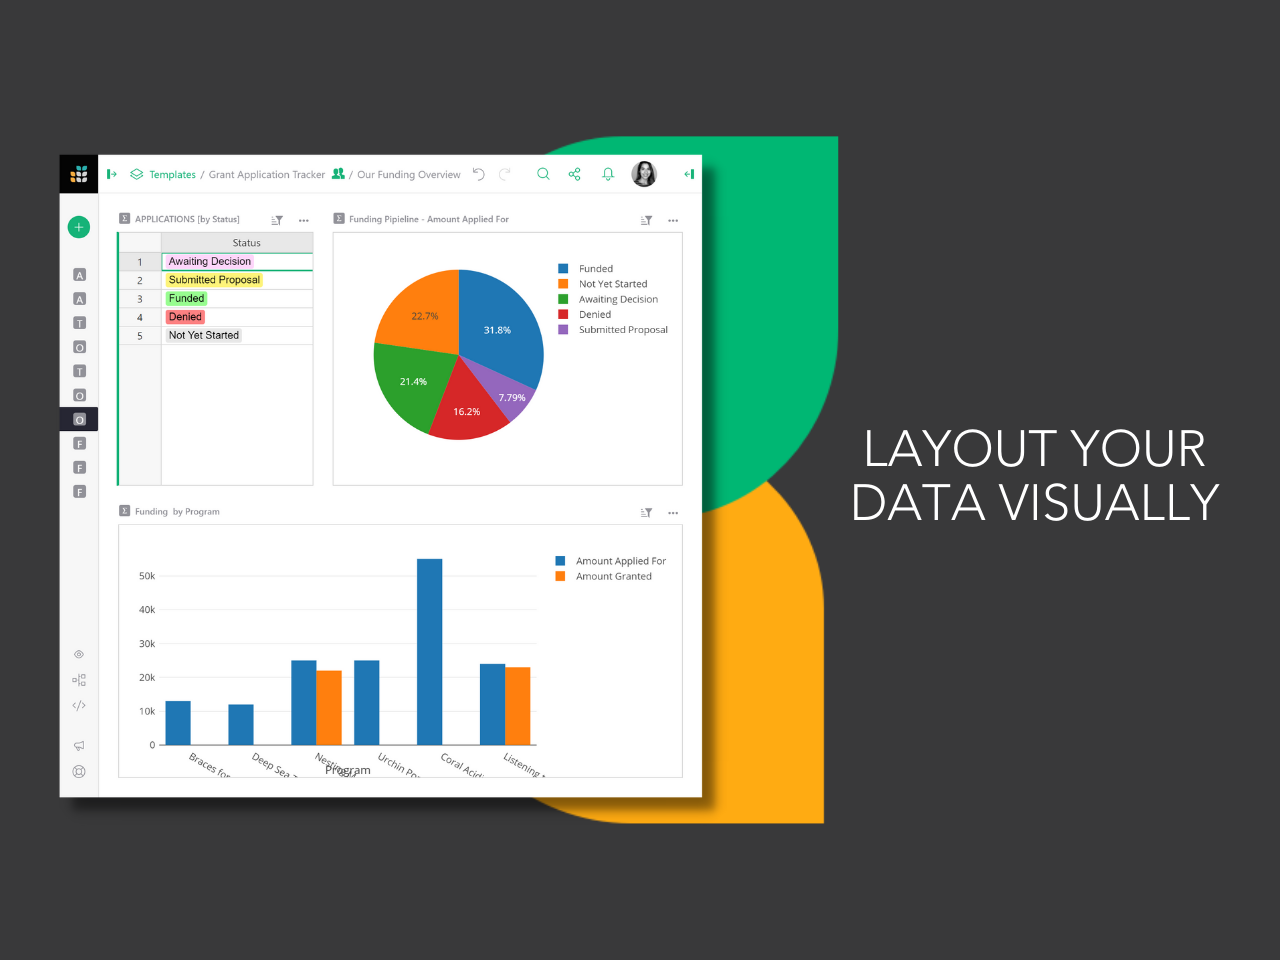
Grist combines the capabilities of spreadsheets, databases and app builders. Using a familiar spreadsheet interface, information can be organized as a relational database, and dashboards built using drag-and-drop. Solving spreadsheet problems Ensures data is well-structured and stored in one place with no duplication, no spreadsheet-wrangling, no merging documents. Collaboration on sensitive data Data is protected…
$8
per month per user
Looker Studio
Score 8.1 out of 10
N/A
Looker Studio is a data visualization platform that transforms data into meaningful presentations and dashboards with customized reporting tools.
$9
per month per user per project
Pricing
Grist
Looker Studio
Editions & Modules
Pro
$8
per month per user
Enterprise
Contact Sales
Looker Studio Pro
$9
per month per user per project
Looker Studio
No charge
Offerings
Pricing Offerings
Grist
Looker Studio
Free Trial
Yes
No
Free/Freemium Version
Yes
Yes
Premium Consulting/Integration Services
No
No
Entry-level Setup Fee
No setup fee
No setup fee
Additional Details
—
—
More Pricing Information
Community Pulse
Grist
Looker Studio
Features
Grist
Looker Studio
BI Standard Reporting
Comparison of BI Standard Reporting features of Product A and Product B
Grist
-
Ratings
Looker Studio
7.1
62 Ratings
13% below category average
Pixel Perfect reports
00 Ratings
6.743 Ratings
Customizable dashboards
00 Ratings
7.461 Ratings
Report Formatting Templates
00 Ratings
7.359 Ratings
Ad-hoc Reporting
Comparison of Ad-hoc Reporting features of Product A and Product B
Grist
-
Ratings
Looker Studio
7.7
61 Ratings
1% below category average
Drill-down analysis
00 Ratings
7.151 Ratings
Formatting capabilities
00 Ratings
7.257 Ratings
Integration with R or other statistical packages
00 Ratings
6.929 Ratings
Report sharing and collaboration
00 Ratings
9.759 Ratings
Report Output and Scheduling
Comparison of Report Output and Scheduling features of Product A and Product B
Grist
-
Ratings
Looker Studio
8.2
60 Ratings
0% above category average
Publish to Web
00 Ratings
8.353 Ratings
Publish to PDF
00 Ratings
8.853 Ratings
Report Versioning
00 Ratings
8.139 Ratings
Report Delivery Scheduling
00 Ratings
7.942 Ratings
Delivery to Remote Servers
00 Ratings
7.624 Ratings
Data Discovery and Visualization
Comparison of Data Discovery and Visualization features of Product A and Product B
This is well suited to someone (or a team) who are technically minded and have a dataset that they need to be able to use in many ways. It's less appropriate for a team who isn't technically minded and/or don't have the data they need to manipulate. It would be useful for things that you could use a database or spreadsheet for such as CRM, Advertising database, Business tracking, Health tracking etc.
Visualizing cross-channel campaign performance can blend data from a few different sources to compare performance metrics like spend, clicks, and conversions side-by-side in a single view, which helps in quick budget reallocation decisions. When dealing with massive volumes of data (millions of rows) or highly complex queries, Looker Studio dashboards can become slow, laggy, or even crash. Performance issues are a frequent complaint when working with large datasets, making it unsuitable for enterprise-level companies
Breath of data - the number of ways to interrogate the data is endless, and the options to view metrics alongside each other make for comprehensive datasets.
Data visualisation and customisation - the options for presenting data and separating out across pages allow for clean visuals and segmented information.
Easy shareability/usability - a quick and simple tool to introduce colleagues to, and easy to grant access for them to be able to view the data, without having to understand the setup itself.
It needs better handling of complex logic. We often need workarounds to perform complex custom calculations, and it can be really unpleasant at times.
Felt it got slow with a larger data set, and in one minor report, we had to set up time filters so that calculations during spikes could be traced more quickly.
Compare to competition they need to improve with notification things.
It is the simplest and least expensive way for us to automate our reporting at this time. I like the ability to customize literally everything about each report, and the ability to send out reports automatically in emails. The only issue we have been having recently is a technical glitch in the automatic email report. Sadly, there is almost no support for this tool from Google, but is also free, so that is important to take into consideration
Looker Studio is easy to use, and it offers a sufficient variety of predefined visualizations to choose from. It's easy for us, and anyone can set up basic reporting without extensive data visualization skills. The interface layout is easy to understand, and it doesn't take long to get used to.
I give it a lower support rating because it seems like our Dev team hasn't gotten the support they need to set up our database to connect. Seems like we hit a roadblock and the project got put on pause for dev. That sucks for me because it is harder to get the dev team to focus on it if they don't get the help they need to set it up.
Looker Studio is far easier to implement, stand up, and learn. The interface is simpler and user-friendly for various levels of data visualization/analysis knowledge and experience. The biggest benefit of Looker Studio, however, is its ease of connection to GA data and speed. Furthermore, since it is an online program/tool, it requires less CPU/battery/storage on the user's device.
It's saved a lot of time in both creating an advertising database and managing it week to week effectively. I had previously created in others that haven't worked, and this does, saving me a good 1 hour weekly, and 5 hours or more each time I had problems with the last ones
Being able to stay on track with this has meant I'm following up at the right time (advertisers) and keeping a professional manner and not losing business due to missed communication
Saving me $ from buying a program like Access (or Airtable monthly) and then the learning curve that that has. This has a much easier learning curve to say the least.