Chose IBM Cognos Analytics
i believe that CA is more powerful, has better modelling, and is not held back by a cumbersome method of re-using data models. The only thing that holds it back is the complexity of licensing.

| Product | Rating | Most Used By | Product Summary | Starting Price |
|---|---|---|---|---|
 IBM Cognos Analytics | N/A | IBM Cognos is a full-featured business intelligence suite by IBM, designed for larger deployments. It comprises Query Studio, Reporting Studio, Analysis Studio and Event Studio, and Cognos Administration along with tools for Microsoft Office integration, full-text search, and dashboards. | $11.25 per month per user | |
 IBM Cognos Controller | N/A | IBM Cognos Controller is a cloud-based financial close management software designed to provide automated and assisted reporting to the reconciliation process, rule and process defining, with automated intercompany eliminations, allocations, currency conversion, and support for extended financial close. | N/A | |
 Microsoft BI (MSBI) | N/A | Microsoft BI is a business intelligence product used for data analysis and generating reports on server-based data. It features unlimited data analysis capacity with its reporting engine, SQL Server Reporting Services alongside ETL, master data management, and data cleansing. | $14 per month per user |
| IBM Cognos Analytics | IBM Cognos Controller | Microsoft BI (MSBI) | ||||||||||||||||||||||
|---|---|---|---|---|---|---|---|---|---|---|---|---|---|---|---|---|---|---|---|---|---|---|---|---|
| Editions & Modules |
| No answers on this topic |
| |||||||||||||||||||||
| Offerings |
| |||||||||||||||||||||||
| Entry-level Setup Fee | Optional | No setup fee | No setup fee | |||||||||||||||||||||
| Additional Details | — | — | — | |||||||||||||||||||||
| More Pricing Information | ||||||||||||||||||||||||
| IBM Cognos Analytics | IBM Cognos Controller | Microsoft BI (MSBI) | |
|---|---|---|---|
| Considered Multiple Products |  IBM Cognos Analytics  Nishant Thakkar Senior Analyst Chose IBM Cognos Analytics IBM Cognos Analytics is robust in terms of reporting, governance and scheduling while Power BI excels in use, interactivity and visuals. In nutshell, IBM Cognos Analytics has edge over Power BI for enterprise grade , structured reporting needs.  Ranjit R Puthenpuramodyil Principal Chose IBM Cognos Analytics I think IBM Cognos Analytics is better than others I have used.  Bernd Oerthle Head of analytic infrastructure Chose IBM Cognos Analytics IBM Planning Analytics  Dion Paul Business Intelligence Administrator Chose IBM Cognos Analytics We chose IBM Cognos Analytics because, in our experience, IBM Cognos Analytics was Better, had more feature functionality, and is easier to use  Eric Pleiss Business Development Chose IBM Cognos Analytics Microsoft Power BI Embedded  Astrid Ortega Data Analyst and Risk Assessor Chose IBM Cognos Analytics Tableau, Power BI, QlikView were the other options considered. Tableau lacked the following key components of business intelligence and analytics. Some other statistical functions that are available on the platform were not matched by Power BI. QlikView lacked robust …  Vinit Mahiwal BI Developer Chose IBM Cognos Analytics It was due to trust in IBM. Very good support provide by IBM. Response time is pretty good Product is proven in past & well robust feature Many good enterprises have used this product  Cristian Racu Deputy CEO Chose IBM Cognos Analytics It is a tool that delivers good performance at a good price. | IBM Cognos Controller No answer on this topic | Microsoft BI (MSBI)  Jessé Paixão Analista de operações de TI Chose Microsoft BI (MSBI) Microsoft BI (MSBI) is the first data mining and processing tool I've used.  Adam Montgomery Partnership Manager Chose Microsoft BI (MSBI) We use Microsoft BI because our organization has all of its software in the Microsoft ecosystem. It just made sense to utilize Microsoft BI because it can so seamlessly connect to all of the other Microsoft tools and data sources that we were using before. We often find that …  Al Mubassir Muin Software Engineer Chose Microsoft BI (MSBI) Better integration with Microsoft products is one of the advantages of using Business Intelligence (BI). It's simple to understand, and plenty of resources are available to outsource it. Many of our existing clients have Microsoft licensing agreements. It's an obvious path when …  Aononna Tazin Customer Relationship Management Specialist Chose Microsoft BI (MSBI) Outsourcing work is easy to understand, and there are plenty of resources available in the marketplace. It is expensive, but it is still significantly less costly than the alternatives. Results from Microsoft BI (MSBI) are dependable; therefore, there is no problem with trust. …  Nilufa Hossain IT Specialist Chose Microsoft BI (MSBI) MSBI is great for data collection and reporting, but it lacks the visual appeal and features of Power BI. Even though it's still useful, it falls short of Power BI in terms of features. There's no reason to doubt MSBI's findings. MSBI has a proactive customer service team that …  Hrishikesh Kardile Logistics Analyst Chose Microsoft BI (MSBI) Microsoft BI is much cheaper.  Shelby Bowden Graduate Research Assistant Chose Microsoft BI (MSBI) Specific data displays are some of the strongest aspects of Microsoft BI when compared to alternate programs. It also does a superior job in compatibility with many programs, especially those from Microsoft. Since my company primarily uses Office 365 and other Microsoft …  Michael Timms Information Technology Supervisor Chose Microsoft BI (MSBI) To be honest, I have never used anything similar to PowerBI. I have seen reports that come from Whatagraph, but I have never used it myself, so that is the only application that I can sort of compare it too. Just looking at the visuals from both, PowerBI reports are better … |
| IBM Cognos Analytics | IBM Cognos Controller | Microsoft BI (MSBI) | |||||||||||||||||||||||||||
|---|---|---|---|---|---|---|---|---|---|---|---|---|---|---|---|---|---|---|---|---|---|---|---|---|---|---|---|---|---|
| BI Standard Reporting |
| ||||||||||||||||||||||||||||
| Ad-hoc Reporting |
| ||||||||||||||||||||||||||||
| Report Output and Scheduling |
| ||||||||||||||||||||||||||||
| Data Discovery and Visualization |
| ||||||||||||||||||||||||||||
| Access Control and Security |
| ||||||||||||||||||||||||||||
| Mobile Capabilities |
| ||||||||||||||||||||||||||||
| Application Program Interfaces (APIs) / Embedding |
|
| IBM Cognos Analytics | IBM Cognos Controller | Microsoft BI (MSBI) | |
|---|---|---|---|
| Small Businesses |  Yellowfin Score 8.6 out of 10 |  Tipalti Score 7.5 out of 10 | Yellowfin Score 8.6 out of 10 |
| Medium-sized Companies |  Reveal Score 10.0 out of 10 |  FloQast Score 8.8 out of 10 | Reveal Score 10.0 out of 10 |
| Enterprises |  Kyvos Semantic Layer Score 9.5 out of 10 | FloQast Score 8.8 out of 10 | Kyvos Semantic Layer Score 9.5 out of 10 |
| All Alternatives | View all alternatives | View all alternatives | View all alternatives |
| IBM Cognos Analytics | IBM Cognos Controller | Microsoft BI (MSBI) | |
|---|---|---|---|
| Likelihood to Recommend | 7.7 (0 ratings) | - (0 ratings) | 8.9 (0 ratings) |
| Likelihood to Renew | 8.1 (0 ratings) | - (0 ratings) | 8.0 (0 ratings) |
| Usability | 7.3 (0 ratings) | - (0 ratings) | 8.9 (0 ratings) |
| Availability | 8.6 (0 ratings) | - (0 ratings) | 9.5 (0 ratings) |
| Performance | 9.0 (0 ratings) | - (0 ratings) | 7.0 (0 ratings) |
| Support Rating | 1.0 (0 ratings) | - (0 ratings) | 8.9 (0 ratings) |
| In-Person Training | 8.7 (0 ratings) | - (0 ratings) | 6.9 (0 ratings) |
| Online Training | 8.0 (0 ratings) | - (0 ratings) | 8.5 (0 ratings) |
| Implementation Rating | 7.0 (0 ratings) | - (0 ratings) | 9.6 (0 ratings) |
| Configurability | 7.0 (0 ratings) | - (0 ratings) | 10.0 (0 ratings) |
| Ease of integration | 5.7 (0 ratings) | - (0 ratings) | - (0 ratings) |
| Product Scalability | 2.7 (0 ratings) | - (0 ratings) | - (0 ratings) |
| Vendor post-sale | 7.0 (0 ratings) | - (0 ratings) | - (0 ratings) |
| Vendor pre-sale | 7.0 (0 ratings) | - (0 ratings) | - (0 ratings) |
| IBM Cognos Analytics | IBM Cognos Controller | Microsoft BI (MSBI) | |
|---|---|---|---|
| Likelihood to Recommend |
| No answers on this topic |
|
| Pros |
| No answers on this topic |
|
| Cons |
 Josepe Bonfante Social Media Strategist | No answers on this topic |
|
| Likelihood to Renew |
 Dwight Taylor Manager of BI Reporting | No answers on this topic |
 Lee Cullom President |
| Usability |
 Robert Goodman Director, Business Intelligence & Analytics | No answers on this topic |
|
| Reliability and Availability |
 Gerrit Goewey Senior Analytics Consultant | No answers on this topic |
 Boris Skylar Vice President, Application Systems |
| Performance |
 Meghdeep Raval, PMP Manager, Data Architecture | No answers on this topic |
Robert Goodman Director, Business Intelligence & Analytics |
| Support Rating |
 Jonathan Kyrlach Business Intelligence Architect | No answers on this topic |
 Jacob Saunders National Practice Director - Business Intelligence |
| In-Person Training |
Robert Goodman Director, Business Intelligence & Analytics | No answers on this topic |
 Stephanie Grice Business Intelligence Analyst |
| Online Training |
Gerrit Goewey Senior Analytics Consultant | No answers on this topic |
 Sean Brady Business Intelligence Architect |
| Implementation Rating |
Robert Goodman Director, Business Intelligence & Analytics | No answers on this topic |
Jacob Saunders National Practice Director - Business Intelligence |
| Alternatives Considered |
Nishant Thakkar Senior Analyst | No answers on this topic |
Adam Montgomery Partnership Manager |
| Scalability |
Robert Goodman Director, Business Intelligence & Analytics | No answers on this topic | No answers on this topic |
| Return on Investment |
| No answers on this topic |
Nilufa Hossain IT Specialist |
| ScreenShots | IBM Cognos Analytics Screenshots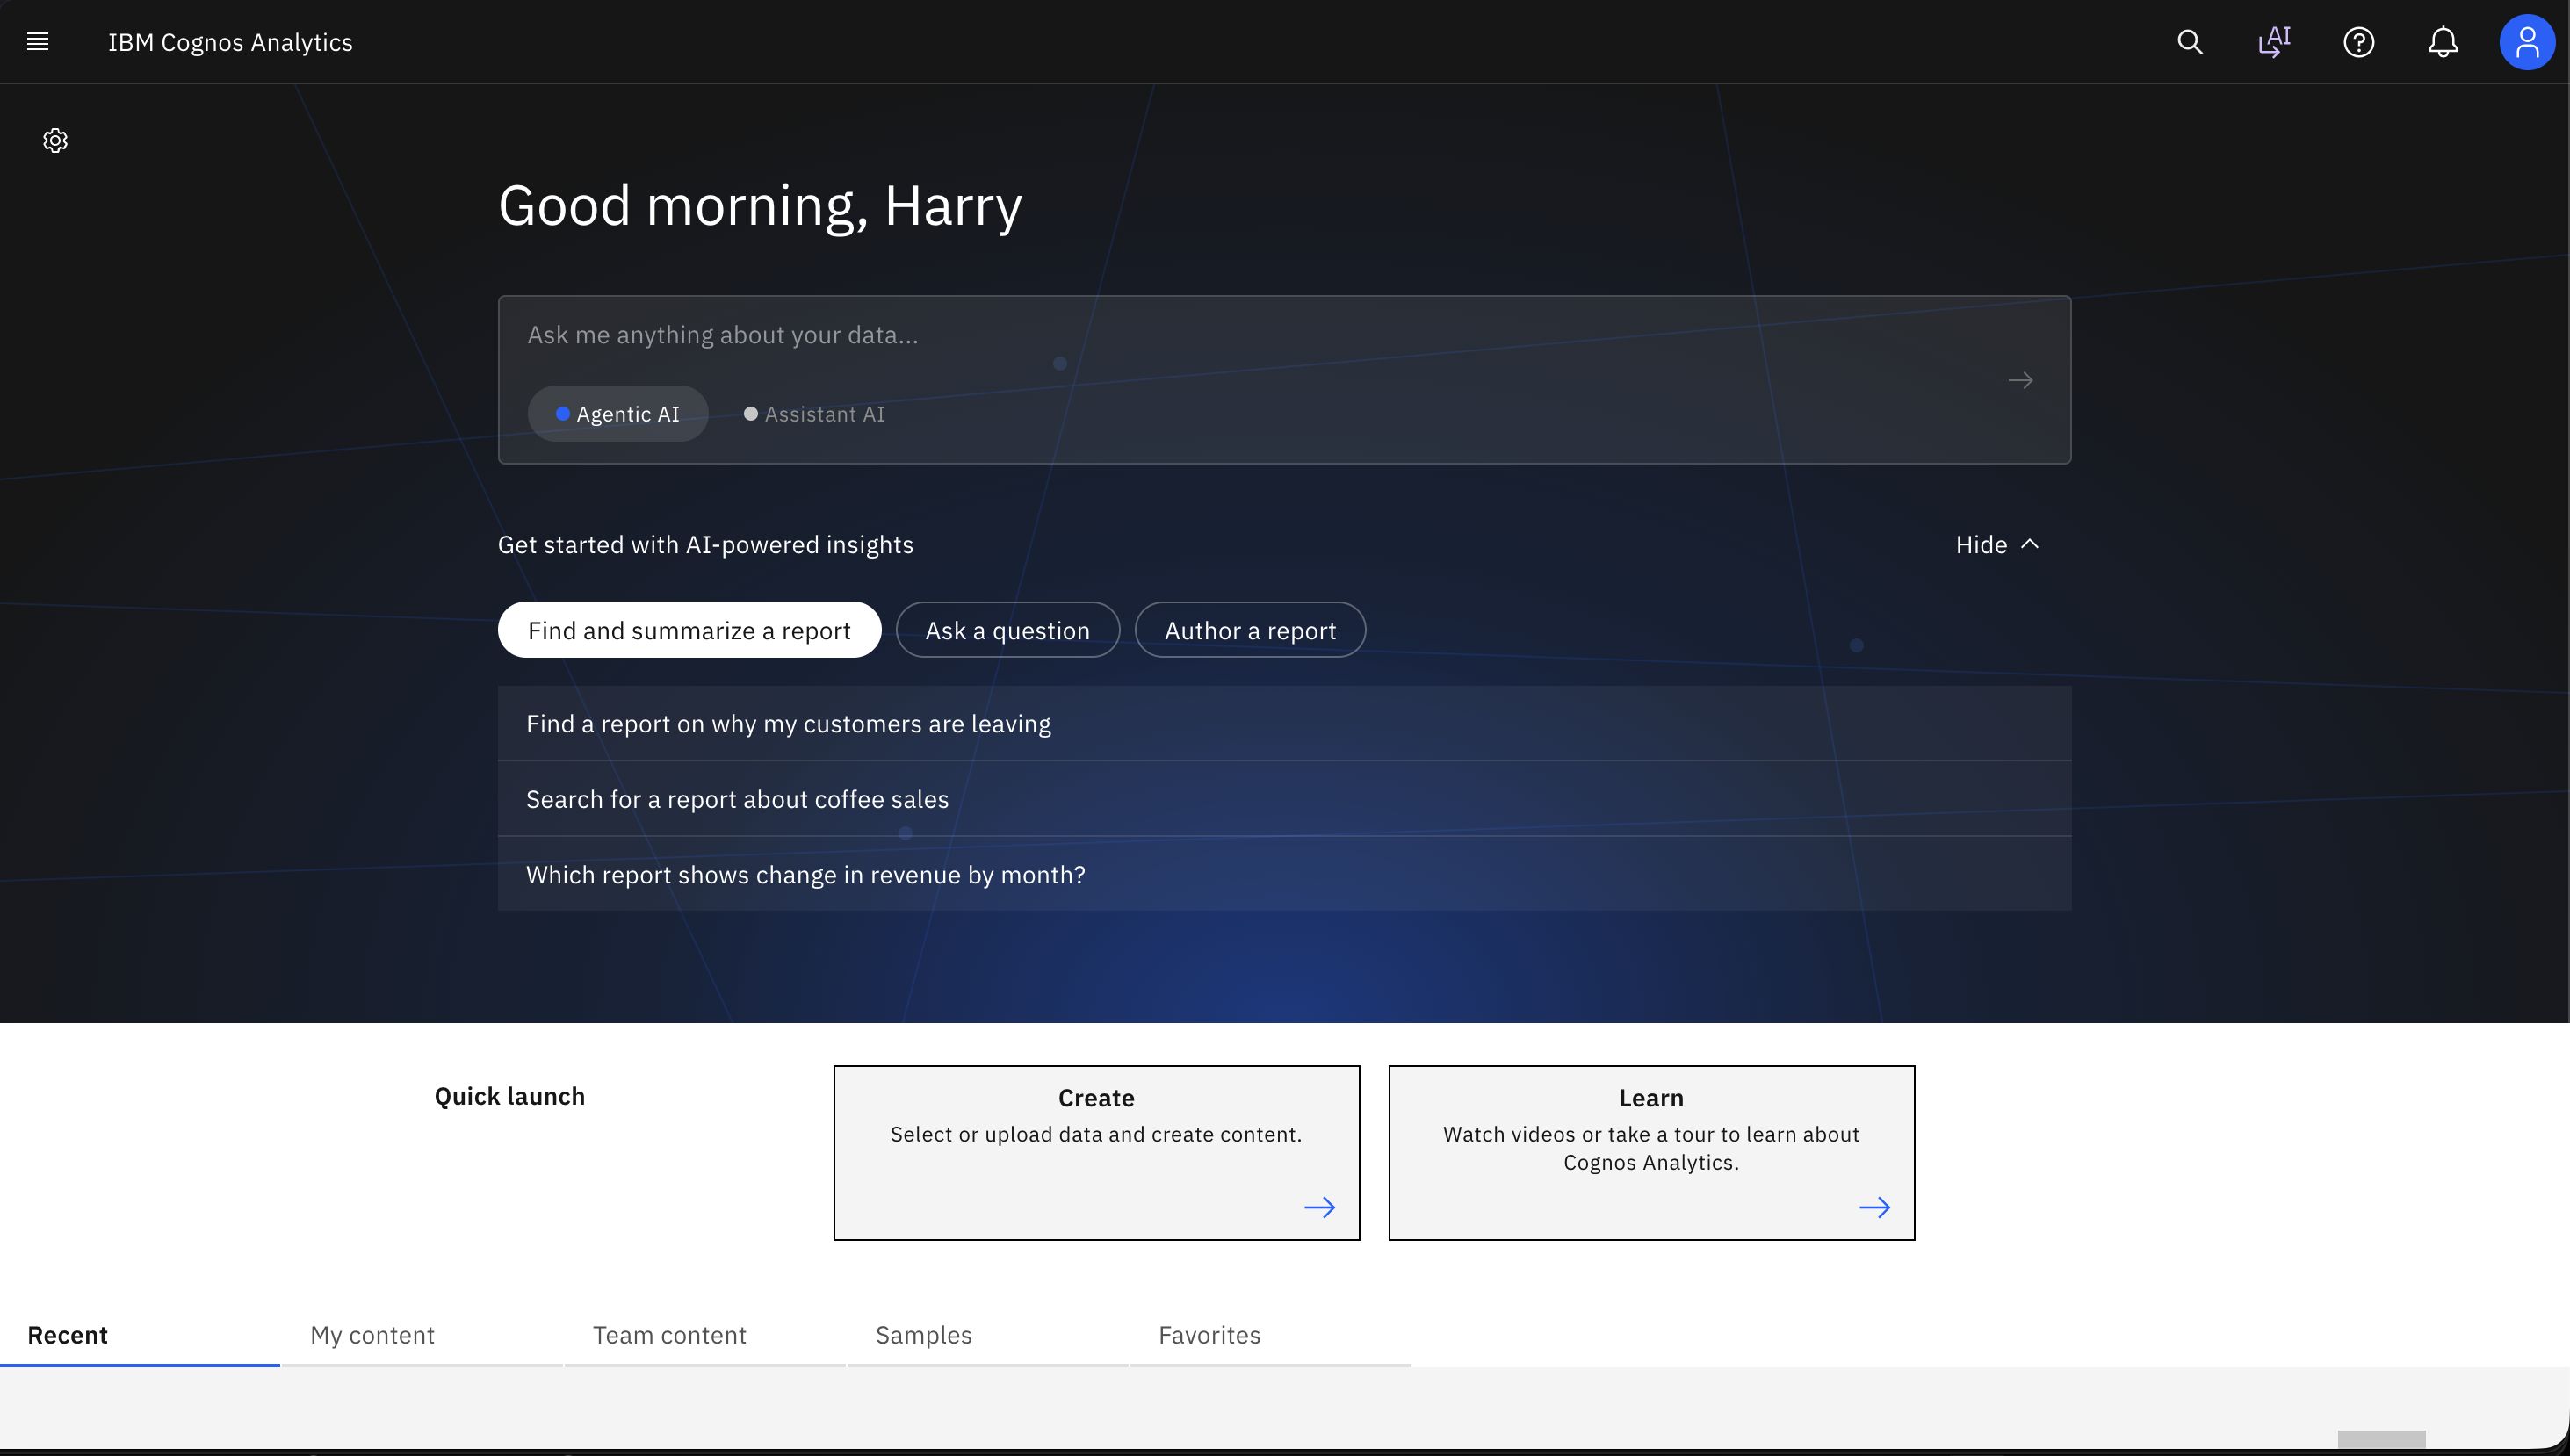    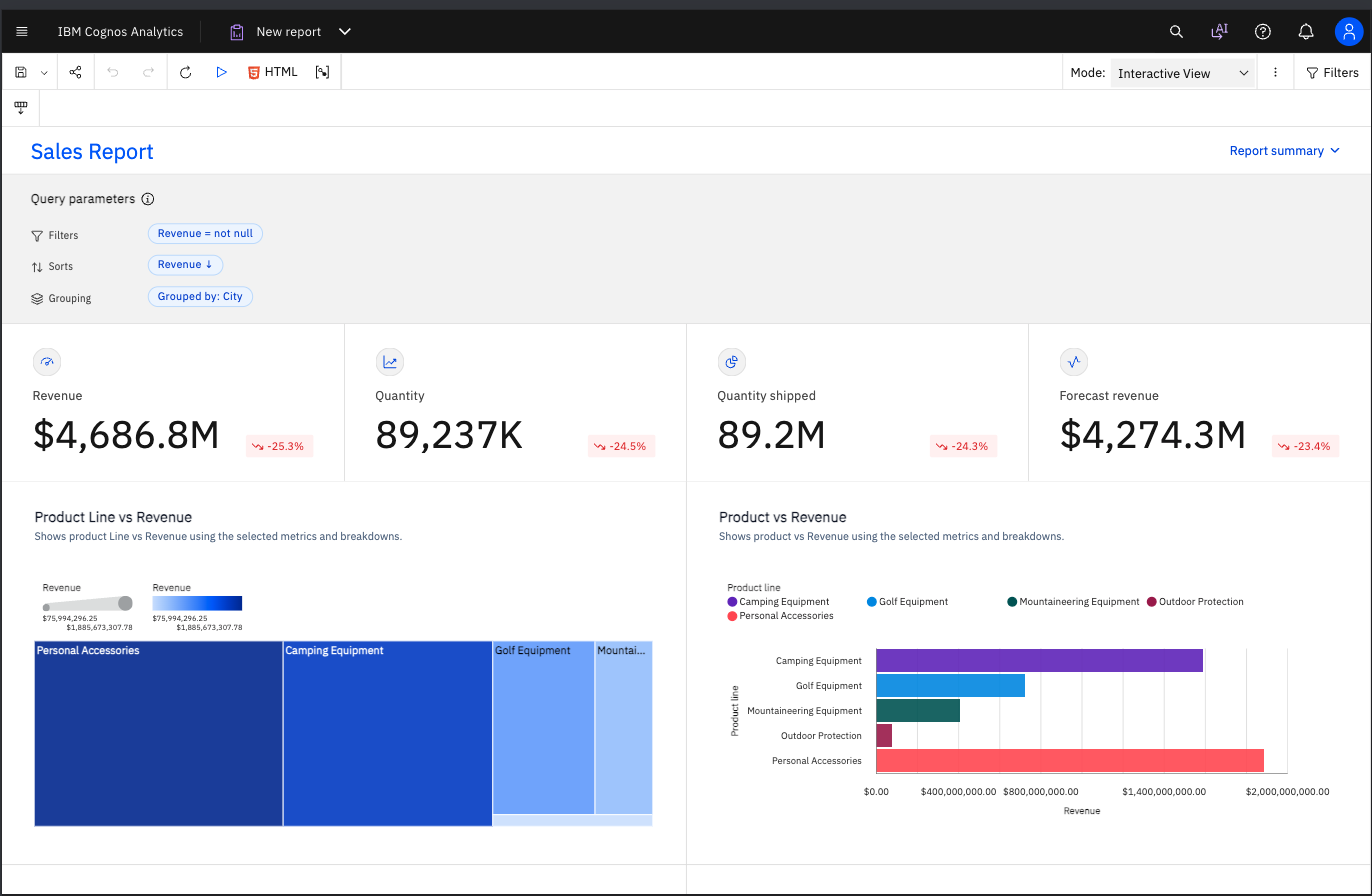 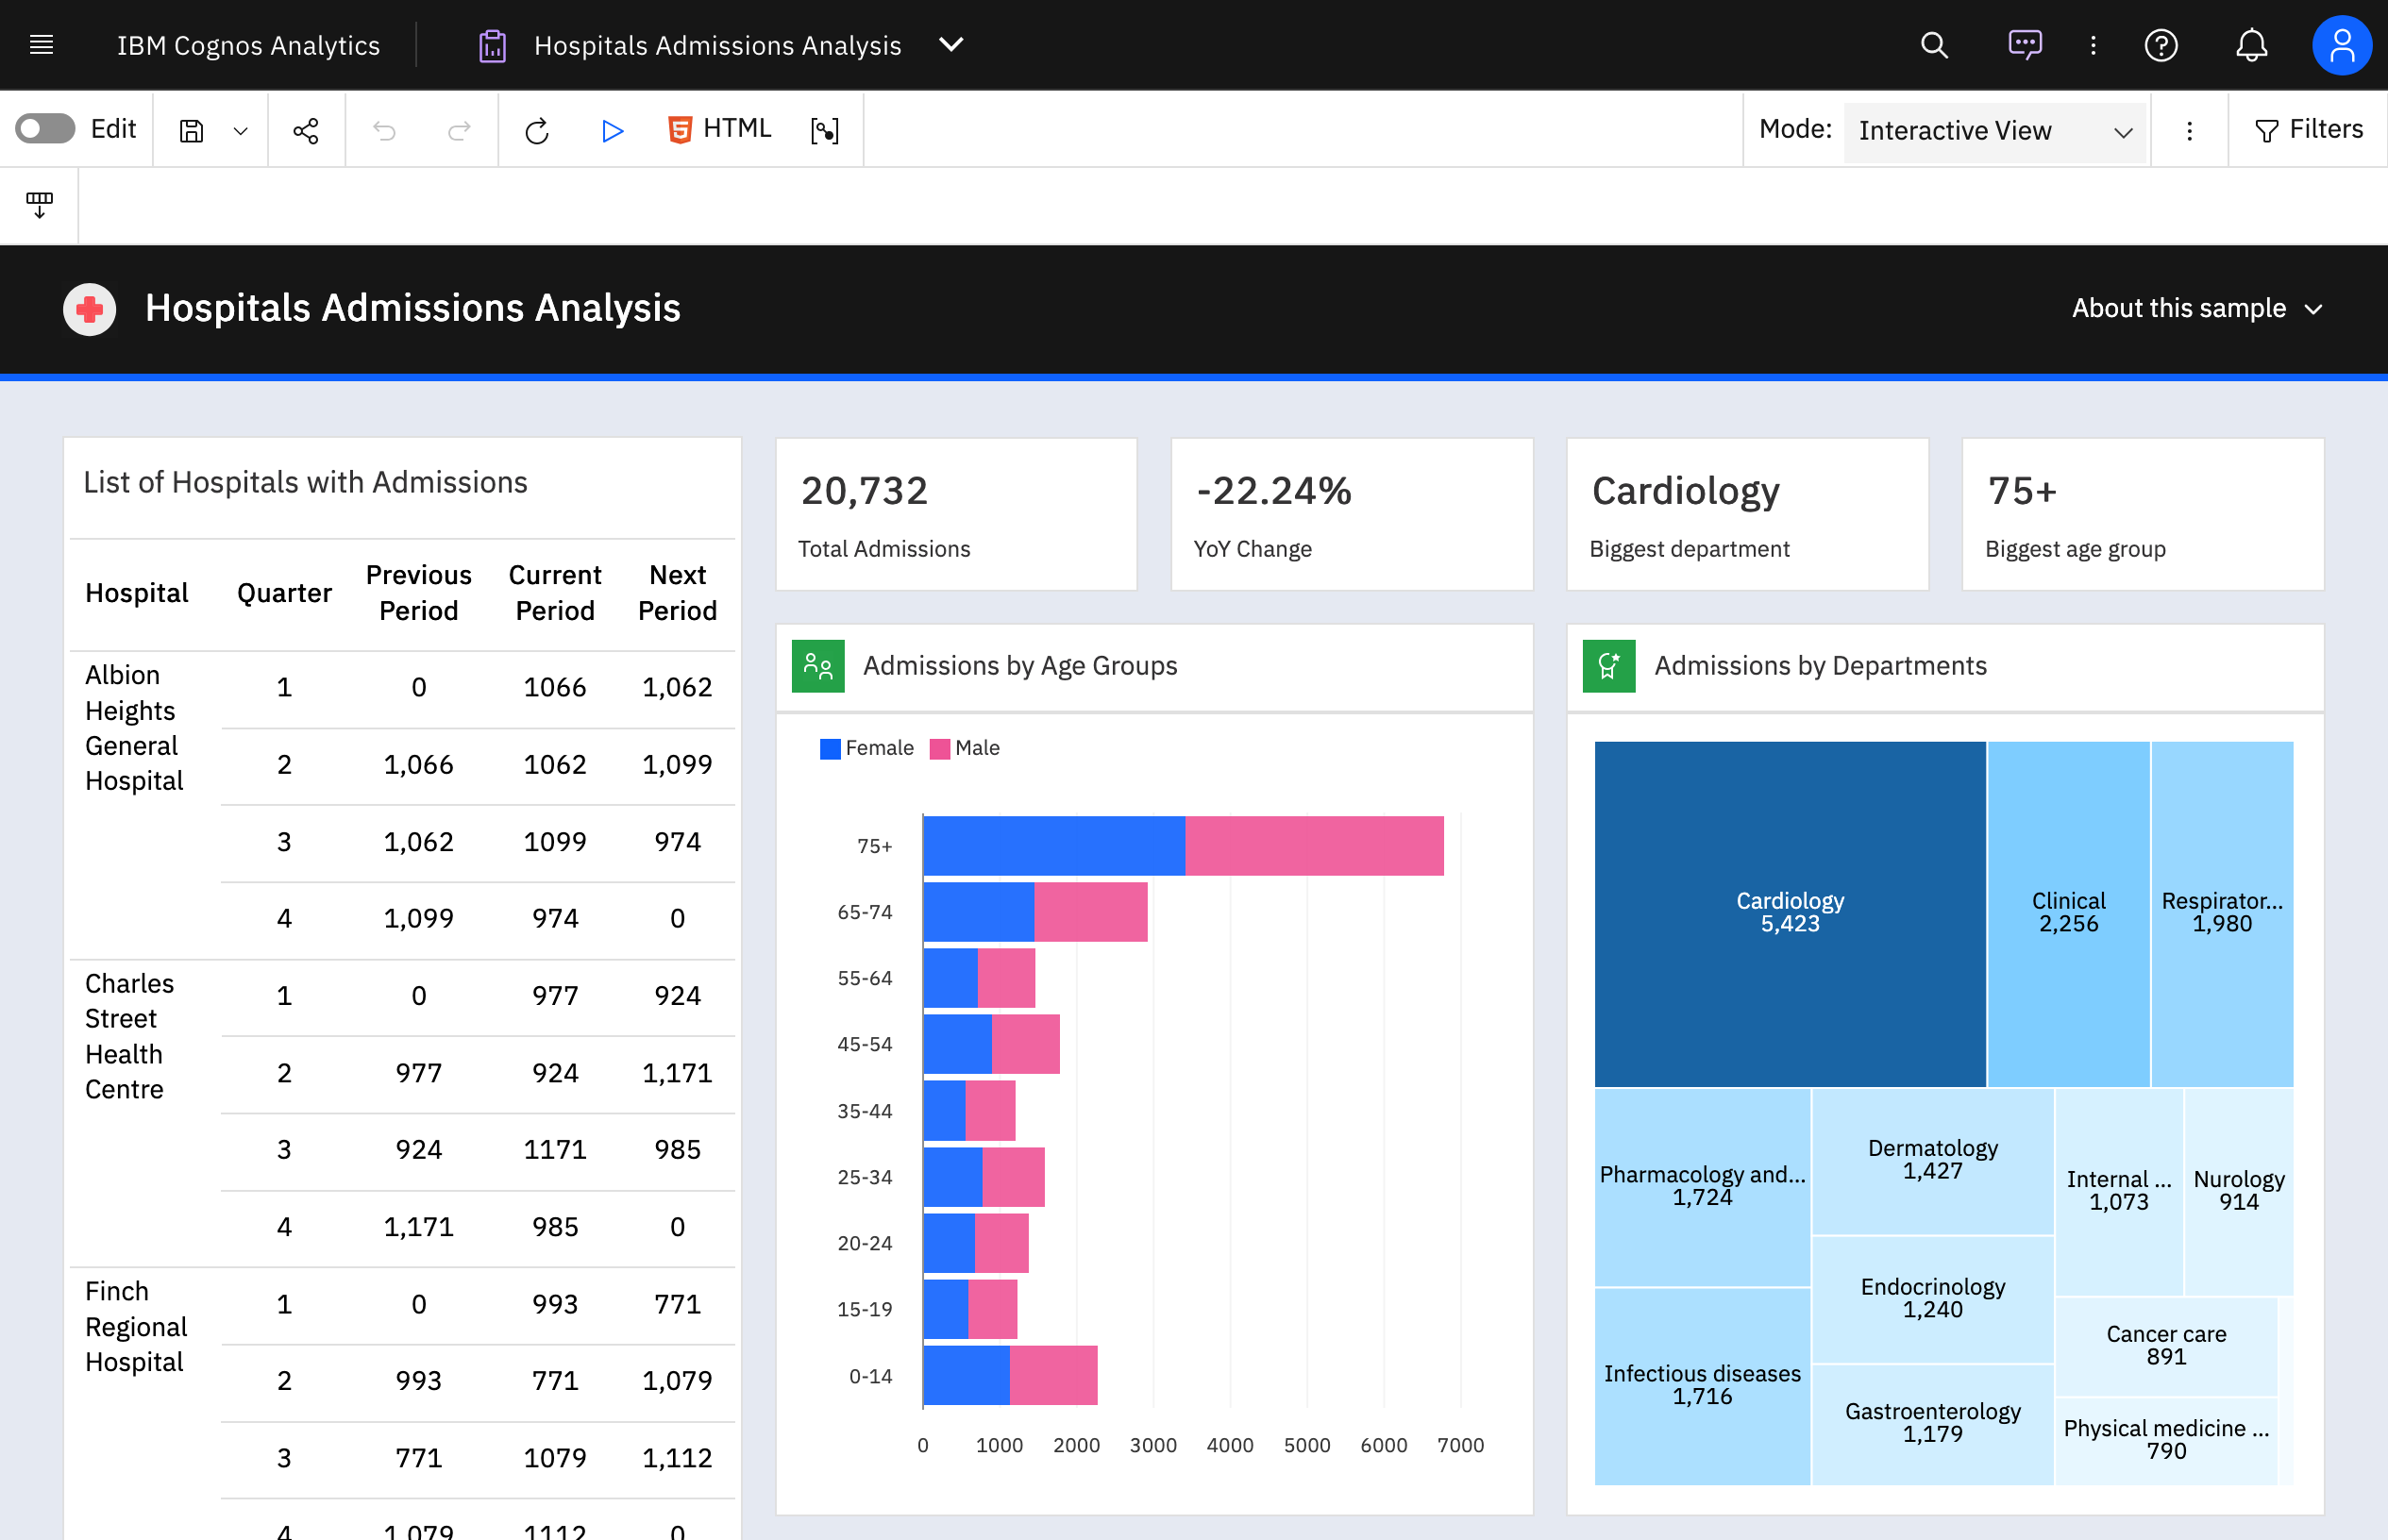 |