Instana, an IBM company since the December 2020 acquisition, provides APM services for SOA, microservices, containerized applications and Kubernetes, and cloud native applications, as well as discovery and monitoring for IT assets.
$75
per month per Managed Virtual Server (MVS)
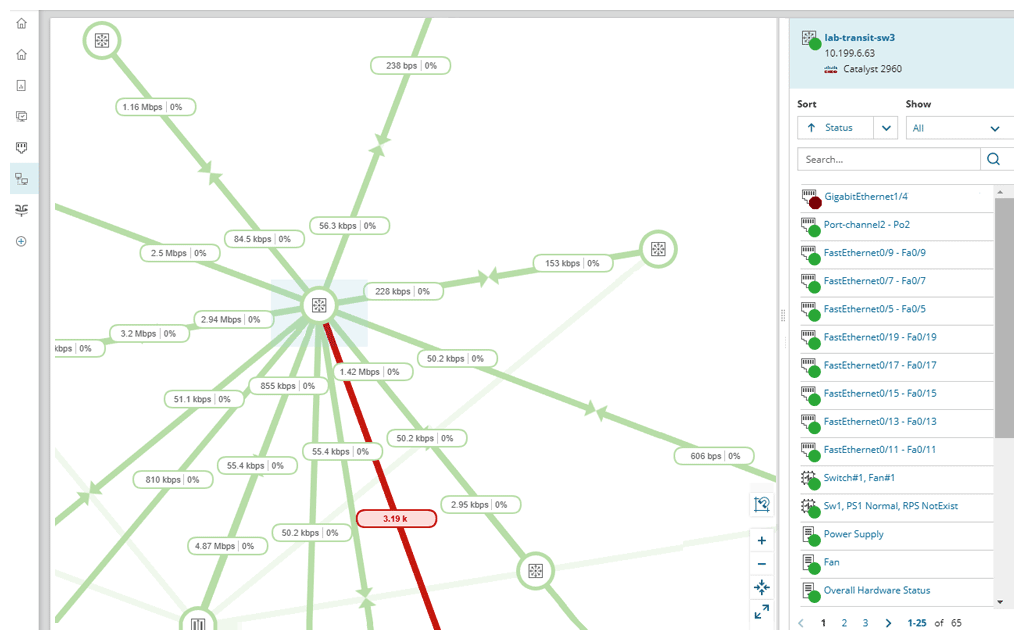
SolarWinds NPM
Score 7.8 out of 10
N/A
SolarWinds NPM is a monitoring and performance management platform. It provides performance troubleshooting support, auto network discovery, customizable thresholds, and can be rapidly deployed.
With enterprise IT assets in a multitude of ecosystems, cloud infrastructures and sometimes still left stuck in a legacy on prem architecture, IBM Instana makes it easy to get the right data to drive development and / or DevSecOps processes with tangible input from the target environment itself.
SolarWinds Network Performance Monitor (NPM) is excellent on node monitoring, for servers, switches, voice routers, etc. It also provides quick information on the dashboard, so you can take a look an in a few seconds determine is an entire site is down, if portions are down, and what may be causing the issue. We have experienced some difficulty when working with our wireless environment. It is less than natural when attempting to determine if a wireless access point is down itself, or if the switch feeding the access point is down, either port or switch. It does a very good job telling you if a switch is down, but troubleshooting the devices (specifically access points) it struggles.
Can monitor application(s) and system(s) with very large throughput of transactions by the second ( it gets everything !!!)
Provide strong drill down for your applications and will tell you where the points of failure of an application's is ( servers , network , Databases , etc you name it )
Very easy to set up and have it up and running when using the SaaS solution. There's an on premise solution which works just as well but requires more effort and preparation from an infrastructure point of view for your teams to implement.
Continuously improve their features and their agents auto-update and keep up. All while not interfering with your applications.
Let's you create your own dashboards and visualizations that can be tailored for different kind of users with the data collected.
Create your own events and smart alerts so you can know on the spot if something is happening or is likely to happen that needs addressing on your applications / systems
It's very difficult to create custom dashboards, only a handful of scenarios can be visualized to dashboards.
Extracting information from Instana to further analysis into excel for example is something that can be improved. Using an API to get data is very limiting.
Open telemetry features which allow to send application data to Instana is not working as documented.
Instana has been able to fulfill our all requirement and provide out of box solution for multiple component like AWS RDS Monitoring and real time alerting setup on basis of that. it is also easy to integrate with other open-source alerting and monitoring tools which makes it easier to incorporate into our solutions
The entire IT staff relies on NPM in its daily operations. It would be impossible for us to maintain our level of service without it. If SolarWinds gets to proud of their product and begins to over charge for it, we would be forced to reconsider and use a different product. But as it stands it is worth the price to renew it.
IBM Instana totally alters our monitoring approach since it increases the stability of the system and simplifies the process of problem solving. And since it helps to lower the degree of alert exhaustion that we experience, it is a total game changer for us.
SolarWinds Network Performance Monitor (NPM) is quite an extensive product, covering all our bases and requirements. There are a lot of customizable options and features which you can work with for their alerting which is really useful. I haven't found anything yet which I thought SolarWinds Network Performance Monitor (NPM) could do, but it actually couldn't so overall it works nicely and does the job.
In all of the times that we called support, someone at SolarWinds had the answer for us in a timely manner. Through thwack and other internet searching, we have been able to resolve all of our issues that arose to our satisfaction. The support staff have always been knowledgeable of their products or had a fellow support staff member to rely on to get the needed answers.
The training is good but during the implementation, you can get situations not learned during the training. The trainer was very open to hearing the questions about use cases and always sharing his experience. I really recommend having official training to take advantage of all features that the NPM can bring.
Make sure your inventory is accurate. Stand up some virtual machines for testing prior to installation. Make sure your database and its credentials are setup. Think about things you want to monitor that may not be obvious - UPS units, Door hardware, PBX systems, Fabric Channel switches, firewalls, routers, switches. Try to setup SNMP on these devices and have an IP that you will assign to the new server. If you do that it will go well.
As a DevOps engineer, I've explored various Application Performance Monitoring (APM) tools, including New Relic for real-time insights, AppDynamics for code-level visibility, Dynatrace for AI-driven monitoring, Datadog for comprehensive observability, Splunk for log management, Stackify Retrace for error tracking, and Raygun for crash reporting. Each tool offers distinct features, and the choice depends on specific use cases, technology stacks, and organizational needs. Thorough evaluations, considering factors like ease of use, integration capabilities, and scalability, help in selecting the most suitable APM solution for effective application monitoring in a DevOps environment.
We use NPM along with PRTG Network Monitor. While NPM is great at monitoring network devices and network links and some aspects of the servers, PRTG provides more in-depth monitoring for Server systems, applications and application ports such as Web Ports etc. PRTG also provides a more comprehensive Root cause analysis.
SolarWinds allows us to proactively address hardware issues before they impact the business. We recently had a server that was experiencing issues sporadically and we were able to use the data from SolarWinds to track down and correct the issue before it tanked the server.
SolarWinds gives our IT department some piece of mind knowing that they'll be alerted of any issues real time.
We can use SolarWinds data to justify needed to replace or upgrade certain equipment that is key to our core business.