iCharts vs. Reveal
iCharts vs. Reveal
| Product | Rating | Most Used By | Product Summary | Starting Price |
|---|---|---|---|---|
 iCharts | Mid-Size Companies (51-1,000 employees) | iCharts is a Business Intelligence and Analytics solution for NetSuite. With this solution, users can transform their NetSuite data into interactive, real-time analytics without leaving their NetSuite dashboard. iCharts includes drag-and-drop chart creation and best-practice templates. The vendor’s value proposition is that iCharts accelerates an organization’s analytics strategy by empowering their team with the critical data-driven tools they need. | $10,000 per installation | |
 Reveal | N/A | Reveal embedded analytics enables teams and customers to drive data insights with embedded intelligence, transforming the user experience of apps. Built with embed in mind first, on modern architecture, Reveal’s API aims to remove the complexity of embedding analytics into applications. Reveal’s native SDKs can be integrated into applications on any platform and tech stack including: .NET Core, Java, NodeJS (coming soon), and front-end technologies such as React, Angular, WebComponent,… | $0 |
| iCharts | Reveal | |||||||||||||||
|---|---|---|---|---|---|---|---|---|---|---|---|---|---|---|---|---|
| Editions & Modules |
|
| ||||||||||||||
| Offerings |
| |||||||||||||||
| Entry-level Setup Fee | $3,000 per installation | Optional | ||||||||||||||
| Additional Details | Based on number of NetSuite licenses | — | ||||||||||||||
| More Pricing Information | ||||||||||||||||
| iCharts | Reveal |
|---|
| iCharts | Reveal | |||||||||||||||
|---|---|---|---|---|---|---|---|---|---|---|---|---|---|---|---|---|
| BI Standard Reporting |
| |||||||||||||||
| Ad-hoc Reporting |
| |||||||||||||||
| Report Output and Scheduling |
| |||||||||||||||
| Data Discovery and Visualization |
| |||||||||||||||
| Access Control and Security |
| |||||||||||||||
| Mobile Capabilities |
| |||||||||||||||
| Application Program Interfaces (APIs) / Embedding |
|
| iCharts | Reveal | |
|---|---|---|
| Small Businesses |  Yellowfin Score 8.7 out of 10 | Yellowfin Score 8.7 out of 10 |
| Medium-sized Companies | Reveal Score 10.0 out of 10 | Yellowfin Score 8.7 out of 10 |
| Enterprises |  Kyvos Semantic Layer Score 9.5 out of 10 |  Infor Birst Score 6.4 out of 10 |
| All Alternatives | View all alternatives | View all alternatives |
| iCharts | Reveal | |
|---|---|---|
| Likelihood to Recommend | 8.0 (2 ratings) | 10.0 (16 ratings) |
| Likelihood to Renew | - (0 ratings) | 8.2 (1 ratings) |
| Usability | - (0 ratings) | 8.4 (16 ratings) |
| Availability | - (0 ratings) | 8.2 (1 ratings) |
| Performance | - (0 ratings) | 7.3 (1 ratings) |
| Implementation Rating | - (0 ratings) | 7.3 (1 ratings) |
| Configurability | - (0 ratings) | 7.3 (1 ratings) |
| Ease of integration | - (0 ratings) | 6.4 (1 ratings) |
| Product Scalability | - (0 ratings) | 6.4 (1 ratings) |
| Vendor post-sale | - (0 ratings) | 7.3 (1 ratings) |
| Vendor pre-sale | - (0 ratings) | 7.3 (1 ratings) |
| iCharts | Reveal | |
|---|---|---|
| Likelihood to Recommend | iCharts, Inc.
| Infragistics
|
| Pros | iCharts, Inc.
| Infragistics
|
| Cons | iCharts, Inc.
| Infragistics
|
| Likelihood to Renew | iCharts, Inc. No answers on this topic | Infragistics
|
| Usability | iCharts, Inc. No answers on this topic | Infragistics
|
| Reliability and Availability | iCharts, Inc. No answers on this topic | Infragistics
|
| Performance | iCharts, Inc. No answers on this topic | Infragistics
|
| Implementation Rating | iCharts, Inc. No answers on this topic | Infragistics
|
| Alternatives Considered | iCharts, Inc.
| Infragistics |
| Scalability | iCharts, Inc. No answers on this topic | Infragistics
|
| Return on Investment | iCharts, Inc. No answers on this topic | Infragistics
|
| ScreenShots | iCharts Screenshots 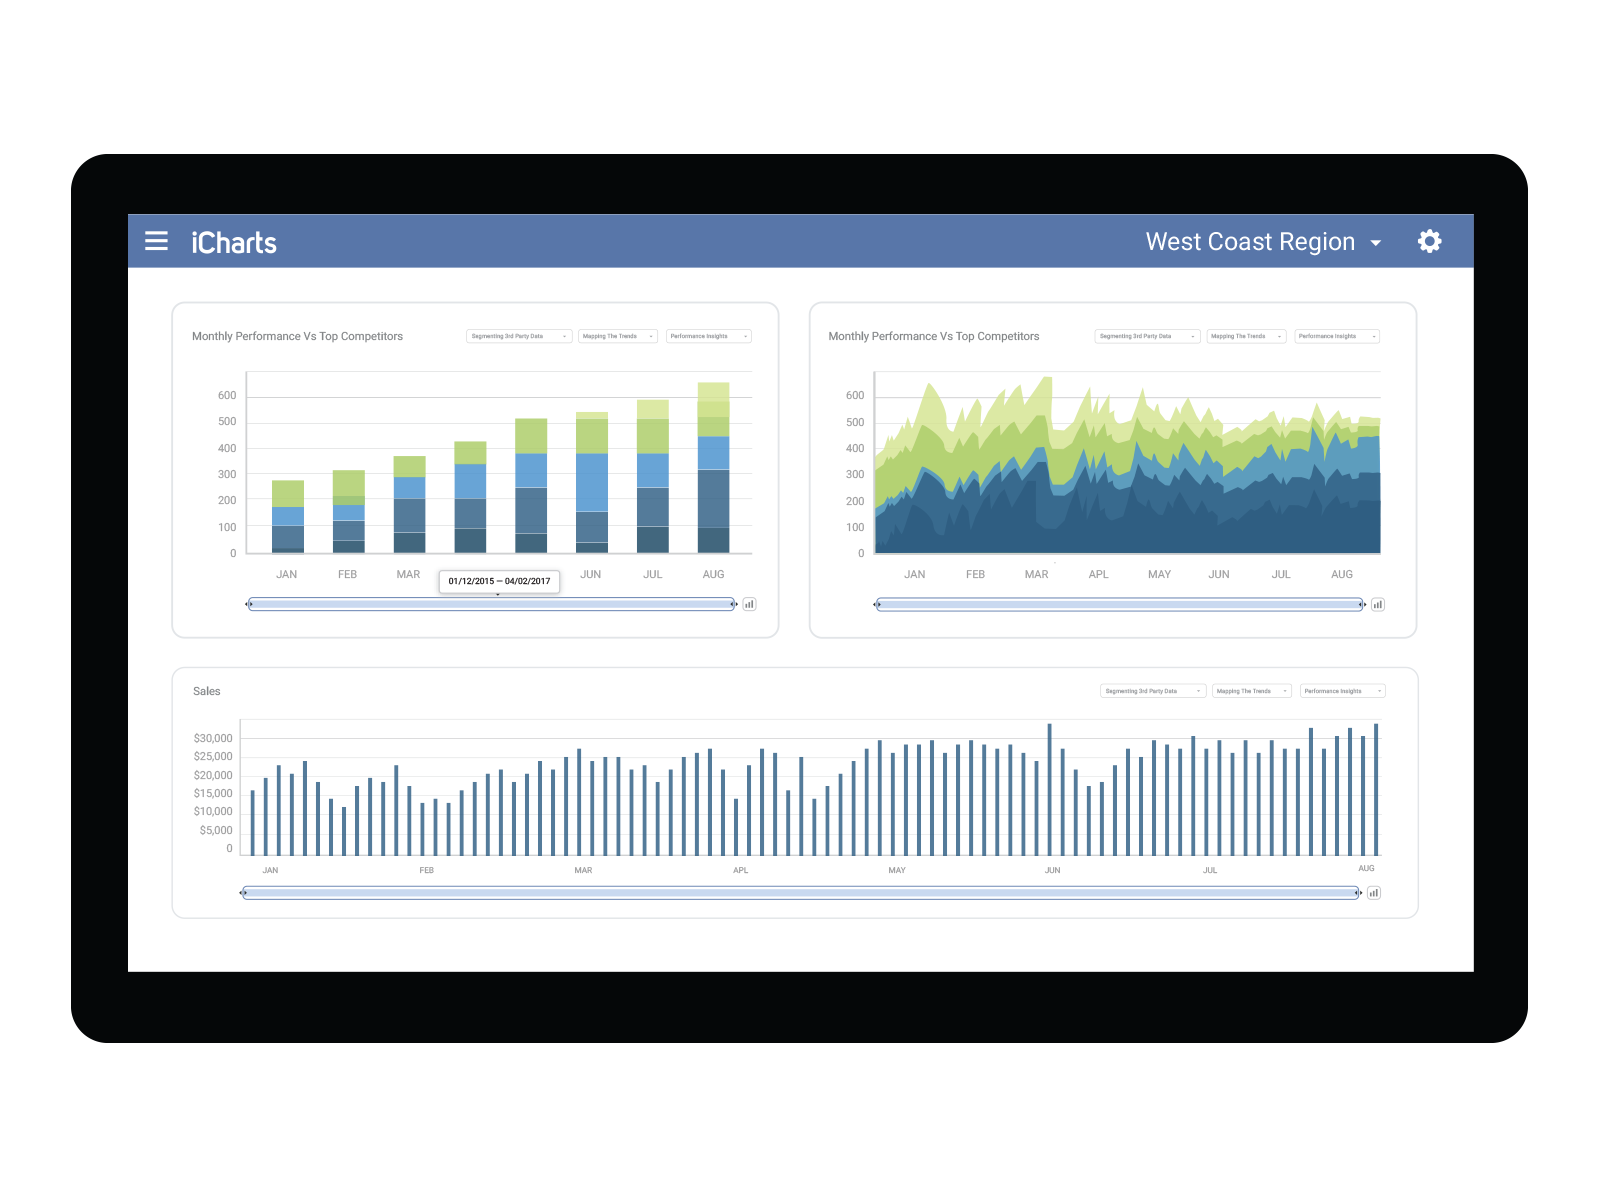 | Reveal Screenshots      |