Chose iCharts
I haven't experience any other alternative product of this.
| Product | Rating | Most Used By | Product Summary | Starting Price |
|---|---|---|---|---|
 iCharts | Mid-Size Companies (51-1,000 employees) | iCharts is a Business Intelligence and Analytics solution for NetSuite. With this solution, users can transform their NetSuite data into interactive, real-time analytics without leaving their NetSuite dashboard. iCharts includes drag-and-drop chart creation and best-practice templates. The vendor’s value proposition is that iCharts accelerates an organization’s analytics strategy by empowering their team with the critical data-driven tools they need. | $10,000 per installation | |
 Tableau Cloud | N/A | Tableau Cloud (formerly Tableau Online) is a self-service analytics platform that is fully hosted in the cloud. Tableau Cloud enables users to publish dashboards and invite colleagues to explore hidden opportunities with interactive visualizations and accurate data, from any browser or mobile device. | $15 per month billed annually per user |
| iCharts | Tableau Cloud | |||||||||||||||
|---|---|---|---|---|---|---|---|---|---|---|---|---|---|---|---|---|
| Editions & Modules |
|
| ||||||||||||||
| Offerings |
| |||||||||||||||
| Entry-level Setup Fee | $3,000 per installation | No setup fee | ||||||||||||||
| Additional Details | Based on number of NetSuite licenses | — | ||||||||||||||
| More Pricing Information | ||||||||||||||||
| iCharts | Tableau Cloud | |
|---|---|---|
| Considered Both Products | iCharts |  Tableau Cloud  Javier Collazos Fraud Prevention , Chargeback Managment and Payments Performance Chose Tableau Cloud Microsoft Excel and Microsoft Power BI  Hitesh Gautam Cloud engineer Chose Tableau Cloud Microsoft Power BI  Gavin Scott-Miller Project manager Chose Tableau Cloud Googles dashboard suite is very user-friendly and anyone can edit and make changes with very little knowledge or practice. But nothing I’ve worked with compares to the customization and multi streams of data in a user-friendly package like tableau does. It’s a really cool piece …  Tom Laughlin Senior Customer Success Manager Chose Tableau Cloud Prior to Tableau [Online], we were using complicated excel formulas and reports that were prone to break or were not easy to format. We used a few free tools before moving forward with Tableau. The free tools also had limitations but we found that the reports, ease of use …  Marquis C. Brantley Regional Manager Chose Tableau Cloud Microsoft Dynamics is the only other product I have interacted with that is similar to Tableau Online. I receive reports from Microsoft Dynamics on a weekly basis. I receive really valuable statistics that help me realize how I am interacting through email. Dynamics send me … |
| iCharts | Tableau Cloud | |||||||||||||||||||||
|---|---|---|---|---|---|---|---|---|---|---|---|---|---|---|---|---|---|---|---|---|---|---|
| BI Standard Reporting |
| |||||||||||||||||||||
| Ad-hoc Reporting |
| |||||||||||||||||||||
| Report Output and Scheduling |
| |||||||||||||||||||||
| Data Discovery and Visualization |
| |||||||||||||||||||||
| Access Control and Security |
| |||||||||||||||||||||
| Mobile Capabilities |
| |||||||||||||||||||||
| Application Program Interfaces (APIs) / Embedding |
|
| iCharts | Tableau Cloud | |
|---|---|---|
| Small Businesses |  Yellowfin Score 8.6 out of 10 | Yellowfin Score 8.6 out of 10 |
| Medium-sized Companies |  Reveal Score 10.0 out of 10 | Reveal Score 10.0 out of 10 |
| Enterprises |  Kyvos Semantic Layer Score 9.5 out of 10 | Kyvos Semantic Layer Score 9.5 out of 10 |
| All Alternatives | View all alternatives | View all alternatives |
| iCharts | Tableau Cloud | |
|---|---|---|
| Likelihood to Recommend | 8.0 (0 ratings) | 9.0 (0 ratings) |
| Usability | - (0 ratings) | 8.6 (0 ratings) |
| Support Rating | - (0 ratings) | 8.7 (0 ratings) |
| iCharts | Tableau Cloud | |
|---|---|---|
| Likelihood to Recommend |
|
|
| Pros |
|
 Raman Ahuja Associate Consultant |
| Cons |
|
|
| Usability | No answers on this topic |
|
| Support Rating | No answers on this topic |
Gavin Scott-Miller Project manager |
| Alternatives Considered |
|
|
| Return on Investment | No answers on this topic |
|
| ScreenShots | iCharts Screenshots 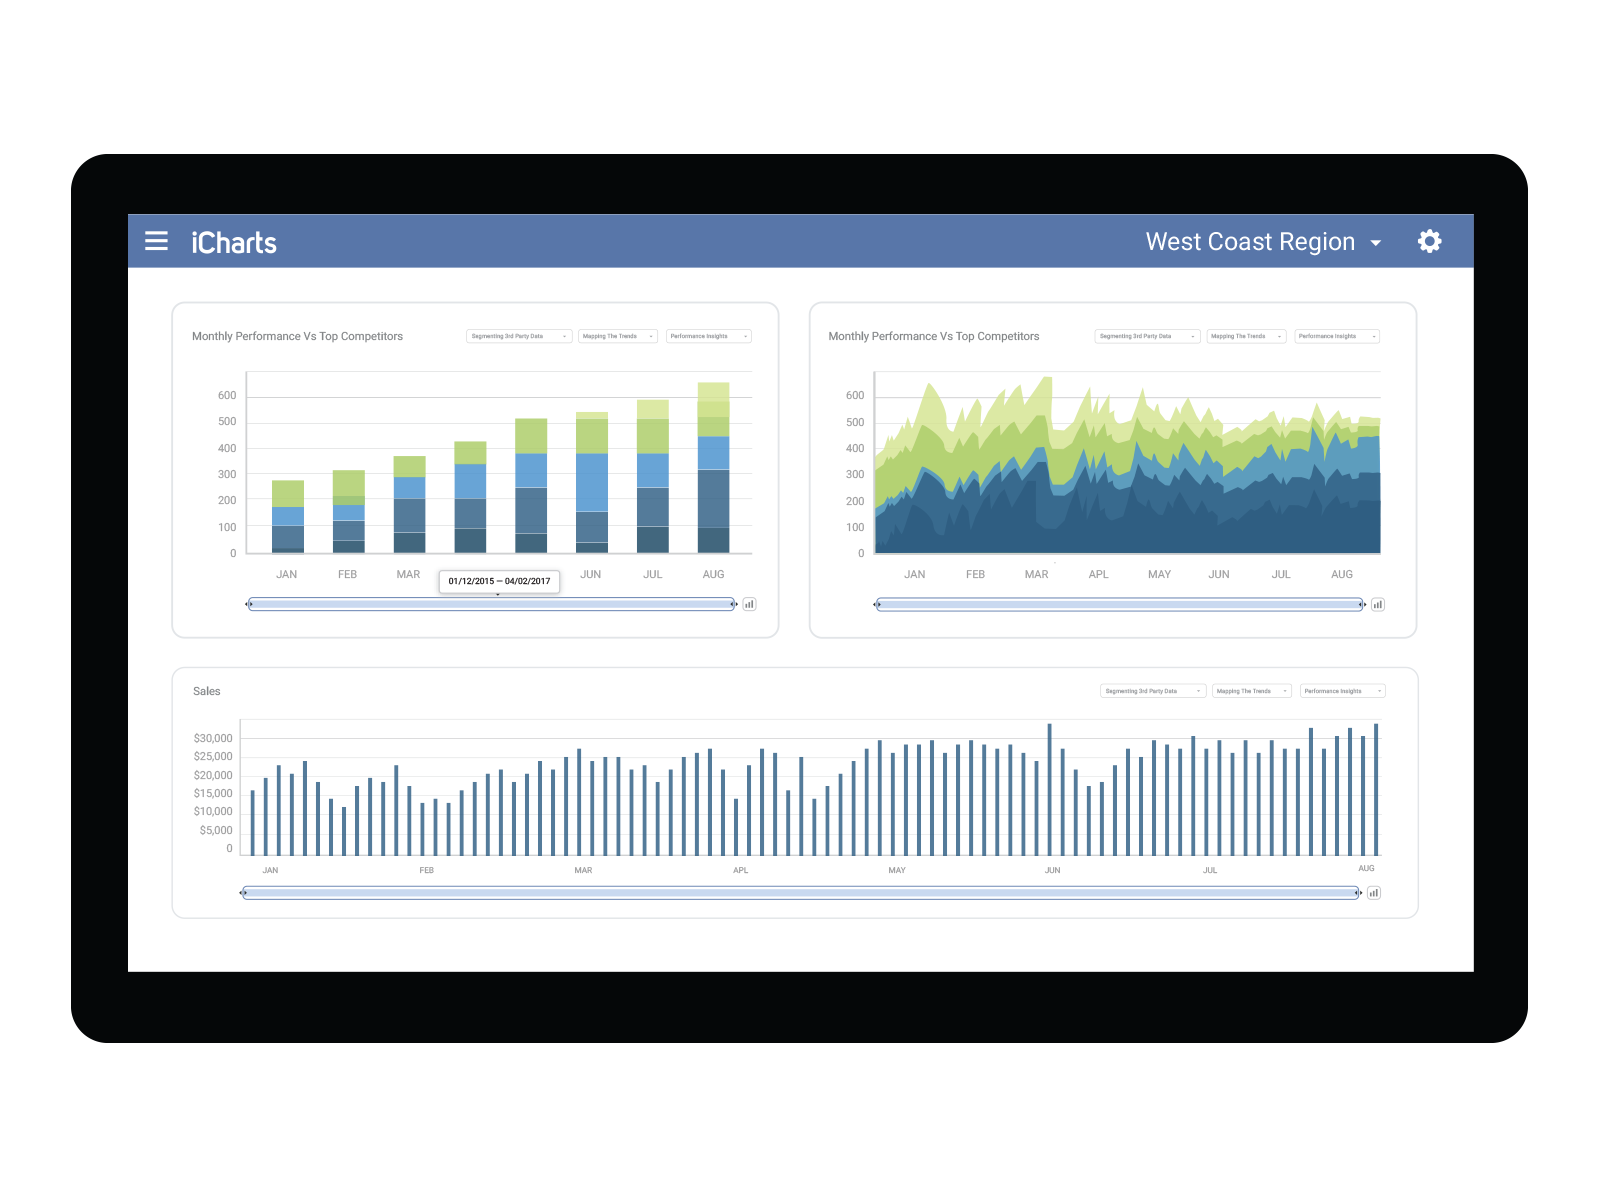 |