IDERA SQL Diagnostic Manager vs. Microsoft Power BI
IDERA SQL Diagnostic Manager vs. Microsoft Power BI
| Product | Rating | Most Used By | Product Summary | Starting Price |
|---|---|---|---|---|
 IDERA SQL Diagnostic Manager | N/A | SQL Diagnostic Manager for Microsoft SQL Server helps database administrators to find and fix Microsoft SQL Server performance problems in physical, virtual, and cloud environments. Unlike its competition, it provides effective scalability, advanced SQL query analysis and optimization, prescriptive analysis with corrective SQL scripts, powerful automated alert responses, broad PowerShell integration, complete customization, and extensive support for current and legacy Microsoft SQL Server and… | $1,996 per instance with first year maintenance included | |
 Microsoft Power BI | N/A | Microsoft Power BI is a visualization and data discovery tool from Microsoft. It allows users to convert data into visuals and graphics, visually explore and analyze data, collaborate on interactive dashboards and reports, and scale across their organization with built-in governance and security. | $168 per year per user |
| IDERA SQL Diagnostic Manager | Microsoft Power BI | |||||||||||||||
|---|---|---|---|---|---|---|---|---|---|---|---|---|---|---|---|---|
| Editions & Modules |
|
| ||||||||||||||
| Offerings |
| |||||||||||||||
| Entry-level Setup Fee | No setup fee | No setup fee | ||||||||||||||
| Additional Details | — | Power BI Desktop is the data exploration and report authoring experience for Power BI, and is available as a free download. | ||||||||||||||
| More Pricing Information | ||||||||||||||||
| IDERA SQL Diagnostic Manager | Microsoft Power BI |
|---|
| IDERA SQL Diagnostic Manager | Microsoft Power BI | |||||||||||||||||||||
|---|---|---|---|---|---|---|---|---|---|---|---|---|---|---|---|---|---|---|---|---|---|---|
| SQL Performance Monitoring |
| |||||||||||||||||||||
| BI Standard Reporting |
| |||||||||||||||||||||
| Ad-hoc Reporting |
| |||||||||||||||||||||
| Report Output and Scheduling |
| |||||||||||||||||||||
| Data Discovery and Visualization |
| |||||||||||||||||||||
| Access Control and Security |
| |||||||||||||||||||||
| Mobile Capabilities |
| |||||||||||||||||||||
| Application Program Interfaces (APIs) / Embedding |
|
| IDERA SQL Diagnostic Manager | Microsoft Power BI | |
|---|---|---|
| Small Businesses | No answers on this topic |  Yellowfin Score 8.7 out of 10 |
| Medium-sized Companies |  Redgate Monitor Score 8.0 out of 10 |  Reveal Score 10.0 out of 10 |
| Enterprises | Redgate Monitor Score 8.0 out of 10 |  Kyvos Semantic Layer Score 9.5 out of 10 |
| All Alternatives | View all alternatives | View all alternatives |
| IDERA SQL Diagnostic Manager | Microsoft Power BI | |
|---|---|---|
| Likelihood to Recommend | 9.0 (8 ratings) | 8.5 (197 ratings) |
| Likelihood to Renew | - (0 ratings) | 9.5 (3 ratings) |
| Usability | - (0 ratings) | 8.3 (113 ratings) |
| Support Rating | - (0 ratings) | 10.0 (52 ratings) |
| Implementation Rating | - (0 ratings) | 9.0 (1 ratings) |
| IDERA SQL Diagnostic Manager | Microsoft Power BI | |
|---|---|---|
| Likelihood to Recommend | Idera, Inc.
| Microsoft
|
| Pros | Idera, Inc.
 Greg Goss SQL Database and Business Intelligence Manager | Microsoft
|
| Cons | Idera, Inc.
 Steven Gockley, MBA, MCSA DBA / Sr. Data Analyst | Microsoft
|
| Likelihood to Renew | Idera, Inc. No answers on this topic | Microsoft
 David Jensen Operations Manager, Customer Success |
| Usability | Idera, Inc. No answers on this topic | Microsoft
|
| Support Rating | Idera, Inc. No answers on this topic | Microsoft
|
| Implementation Rating | Idera, Inc. No answers on this topic | Microsoft
 Anuj Sant Senior buyer |
| Alternatives Considered | Idera, Inc.
 José Javier Dominguez Reina Jefe de Proyecto | Microsoft
|
| Return on Investment | Idera, Inc.
| Microsoft
|
| ScreenShots | IDERA SQL Diagnostic Manager Screenshots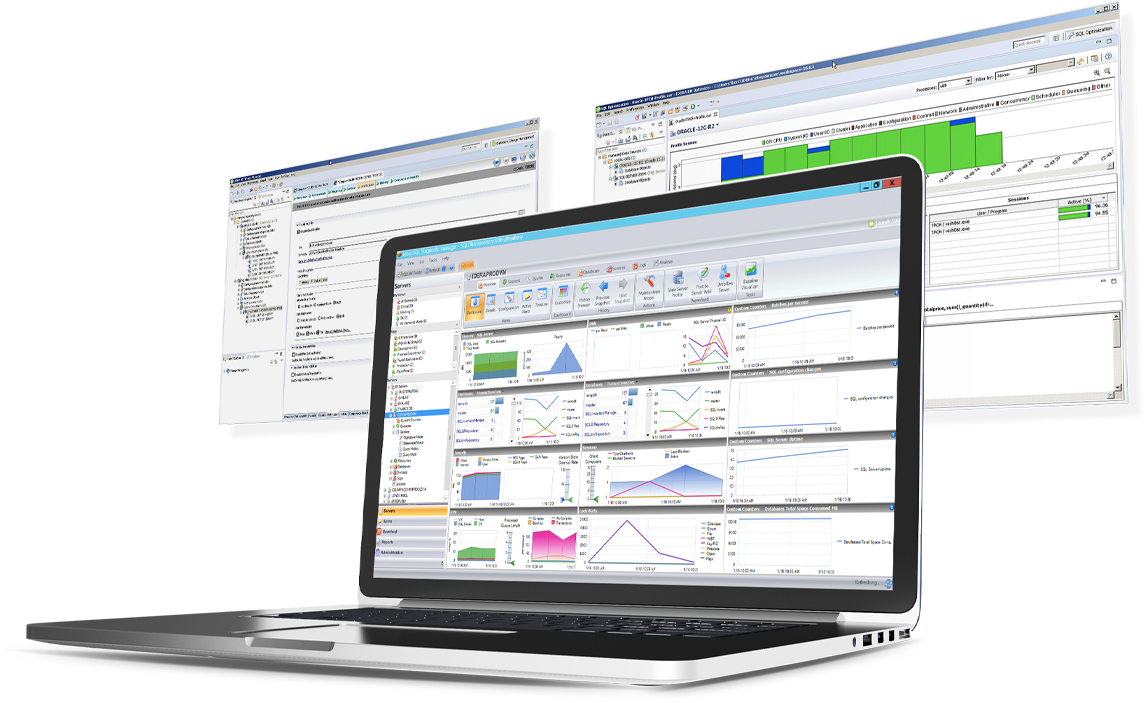 | Microsoft Power BI Screenshots      |