LiveAction’s LiveNX is a network performance monitoring and analytics platform. It supports packet-level, network-wide visibility and proactive alerts. It can be deployed on-premise, virtually, or in the cloud.
N/A
SolarWinds AppOptics
Score 8.2 out of 10
N/A
SolarWinds AppOptics (formerly Librato) is an IT infrastructure monitoring service and APM, based on technology acquired by SolarWinds with Librato in 2015 to expand its cloud monitoring portfolio.
N/A
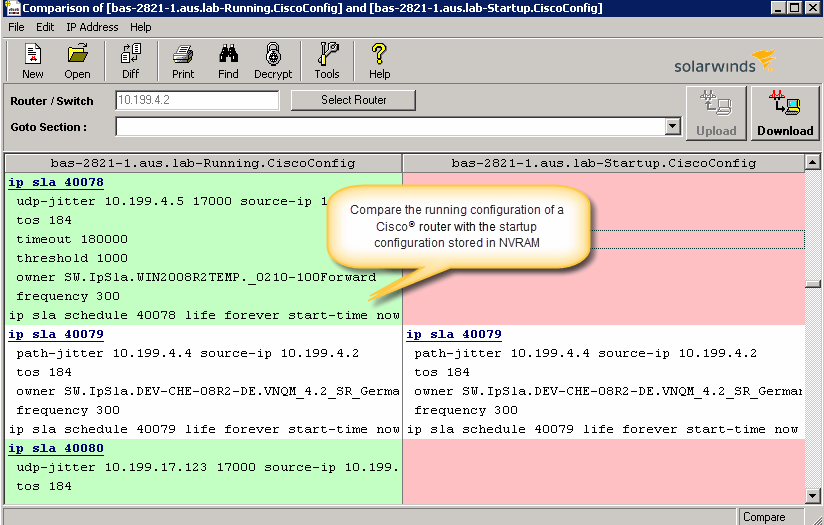
SolarWinds Engineer's Toolset
Score 7.9 out of 10
N/A
SolarWinds® Engineer’s Toolset (ETS) helps users monitor and troubleshoot a network with over 60 tools for network management. ETS allows users to monitor and receive alerts in real time on network availability and health, and perform network diagnostics for faster troubleshooting and resolution of complex
network issues. With ETS users can deploy an array of network discovery tools including Port Scanner, Switch Port Mapper or advanced Subnet Calculator, manage Cisco®
devices with specialized…
$1,585
Per Instance
Pricing
LiveAction
SolarWinds AppOptics
SolarWinds Engineer's Toolset
Editions & Modules
No answers on this topic
No answers on this topic
One Time Price
$1,585
Per Instance
Offerings
Pricing Offerings
LiveAction
SolarWinds AppOptics
SolarWinds Engineer's Toolset
Free Trial
No
Yes
Yes
Free/Freemium Version
No
No
No
Premium Consulting/Integration Services
No
No
No
Entry-level Setup Fee
No setup fee
No setup fee
No setup fee
Additional Details
—
—
—
More Pricing Information
Community Pulse
LiveAction
SolarWinds AppOptics
SolarWinds Engineer's Toolset
Features
LiveAction
SolarWinds AppOptics
SolarWinds Engineer's Toolset
Network Performance Monitoring
Comparison of Network Performance Monitoring features of Product A and Product B
LiveAction
6.9
2 Ratings
15% below category average
SolarWinds AppOptics
-
Ratings
SolarWinds Engineer's Toolset
-
Ratings
Automated network device discovery
7.22 Ratings
00 Ratings
00 Ratings
Network monitoring
7.22 Ratings
00 Ratings
00 Ratings
Baseline threshold calculation
5.01 Ratings
00 Ratings
00 Ratings
Alerts
6.32 Ratings
00 Ratings
00 Ratings
Network capacity planning
6.01 Ratings
00 Ratings
00 Ratings
Packet capture analysis
7.22 Ratings
00 Ratings
00 Ratings
Network mapping
6.32 Ratings
00 Ratings
00 Ratings
Customizable reports
10.01 Ratings
00 Ratings
00 Ratings
Wireless infrastructure monitoring
8.01 Ratings
00 Ratings
00 Ratings
Hardware health monitoring
6.01 Ratings
00 Ratings
00 Ratings
Application Performance Management
Comparison of Application Performance Management features of Product A and Product B
From a packet tracing standpoint, it was easy to setup and analyze an issue we were having with eigrp errors between 2 data centers. Took a few minutes to stand up on both sides and compare the traffic to determine hellos weren't being sent. On the other spectrum, had it had the analytics of such products as Extrahop, it could have recognized and alerted us of an internal DNS attack we had.
AppOptics is good for small to medium-sized organizations with less than 150 servers or less than 40 services to monitor. It performs well for this use case where people need to get an overview of application performance, and 95%ile data is okay. Somewhere every data point and every record is critical; it should be avoided.
I have found the toolset especially useful for scanning subnets to discover devices, and for setting up temporary real-time monitors when we are troubleshooting or setting up new connections. The most useful aspect has been the ability to apply the tools to help troubleshoot and pinpoint intermittent issues. More general tools like Orion often do not have the granularity to detect issues like intermittent packet loss which are especially impactful to applications like Voice. The toolset gives us another level of capability to dig into issues.
I use it primarily as a monitoring tool from a security standpoint, so one complaint is that the filter creation process takes a little time to learn.
In the digital days of printing less, I do still need to print network diagrams for compliance documentation and some of the larger network diagrams documents do not print easily.
I wish the network connection lines were easier to see. They are typically very light and you have to drill down to see them more clearly.
The only thing that I would add is the possibility to display every single query our servers receive to eventually analyze them and query through them. We could also generate nice visualizations from that. Right now I believe we can only see averages.
The unifying component that is intended to be the initial interface to the tools seems clunky. I prefer to start the tools individually rather than using it.
The port scanner could use some improvements to make it easier to use.
As far a usability is concerned for AppOptics, it is just as matter of few minutes away even if you start from scratch, as all you need to do is register on the site and you will get the URL and password. And after this all you have to do is follow the instruction, as per the configuration wizard (tool tip) within the console for various technology such as SQL, IIS, .NET
Can't really rate this, we never had to call support. The product wasn't complicated to setup and learn. We have a high level of network knowledge so the product was self-explanatory.
Solarwinds AppOptics is rated as 9 out of 10 and the reason is there are still few areas where AppOptics needs to improve such as Service Now Integration, GCP Cloud Support, Better Dashboard visualization for application transactions flow. Other than these feature everything is there in AppOptics and that's a reason given 9 points out of 10.
There is not any other product that does exactly what LiveAction does. Some come about halfway close, like scrutinizer by Plixer. However, there is a gap with that product as it doesn't give proper quality of service recommendations, or to update l2/l3 configs to head off problems. Plixer's scrutinizer product costs about the same. It was a no-brainer to pick LiveAction.
What we found positive in AppOptics from others is:
Easy to install and manage.
Various stack support.
Point to point deep-dive metrics and correlation.
Metrics like DB connection, query analysis, latency in API calls, and other connections, response codes for various APIs, etc are the key ones in our case, which AppOptics provides efficiently.
I haven't compared any tools similar to SolarWinds Engineer's Toolset. This might be because I'm pretty biased when it comes to monitoring, and reporting solutions. I've found that SolarWinds provides the biggest bang for the buck in my opinion. I'm sure there are other solutions on the market that compete, but I haven't tried any of them because I've been very satisfied with SolarWinds.