Logi Symphony is a business intelligence and data visualization software that includes customizable dashboards, reporting, and visual data analytics. It can be integrated into users’ existing business applications and its visualization and reporting tools can be customized.
N/A
SAP Analytics Cloud
Score8.1 out of 10
N/A
The SAP Analytics Cloud solution brings together analytics and planning with integration to SAP applications and access to heterogenous data sources. As the analytics and planning solution within SAP Business Technology Platform, SAP Analytics Cloud supports trusted insights and integrated planning processes enterprise-wide to help make decisions without doubt.
$36
per month per user
Pricing
Logi Symphony
SAP Analytics Cloud
Editions & Modules
No answers on this topic
SAP Analytics Cloud for Business Intelligence
$36.00
per month per user
SAP Analytics Cloud for Planning
Price upon request
per month per user
Offerings
Pricing Offerings
Logi Symphony
SAP Analytics Cloud
Free Trial
Yes
Yes
Free/Freemium Version
No
No
Premium Consulting/Integration Services
Yes
No
Entry-level Setup Fee
No setup fee
No setup fee
Additional Details
—
A 30-day trial with SAP Analytics Cloud is available, supporting analytics enterprise-wide. A trial can be extended up to 90 days on request.
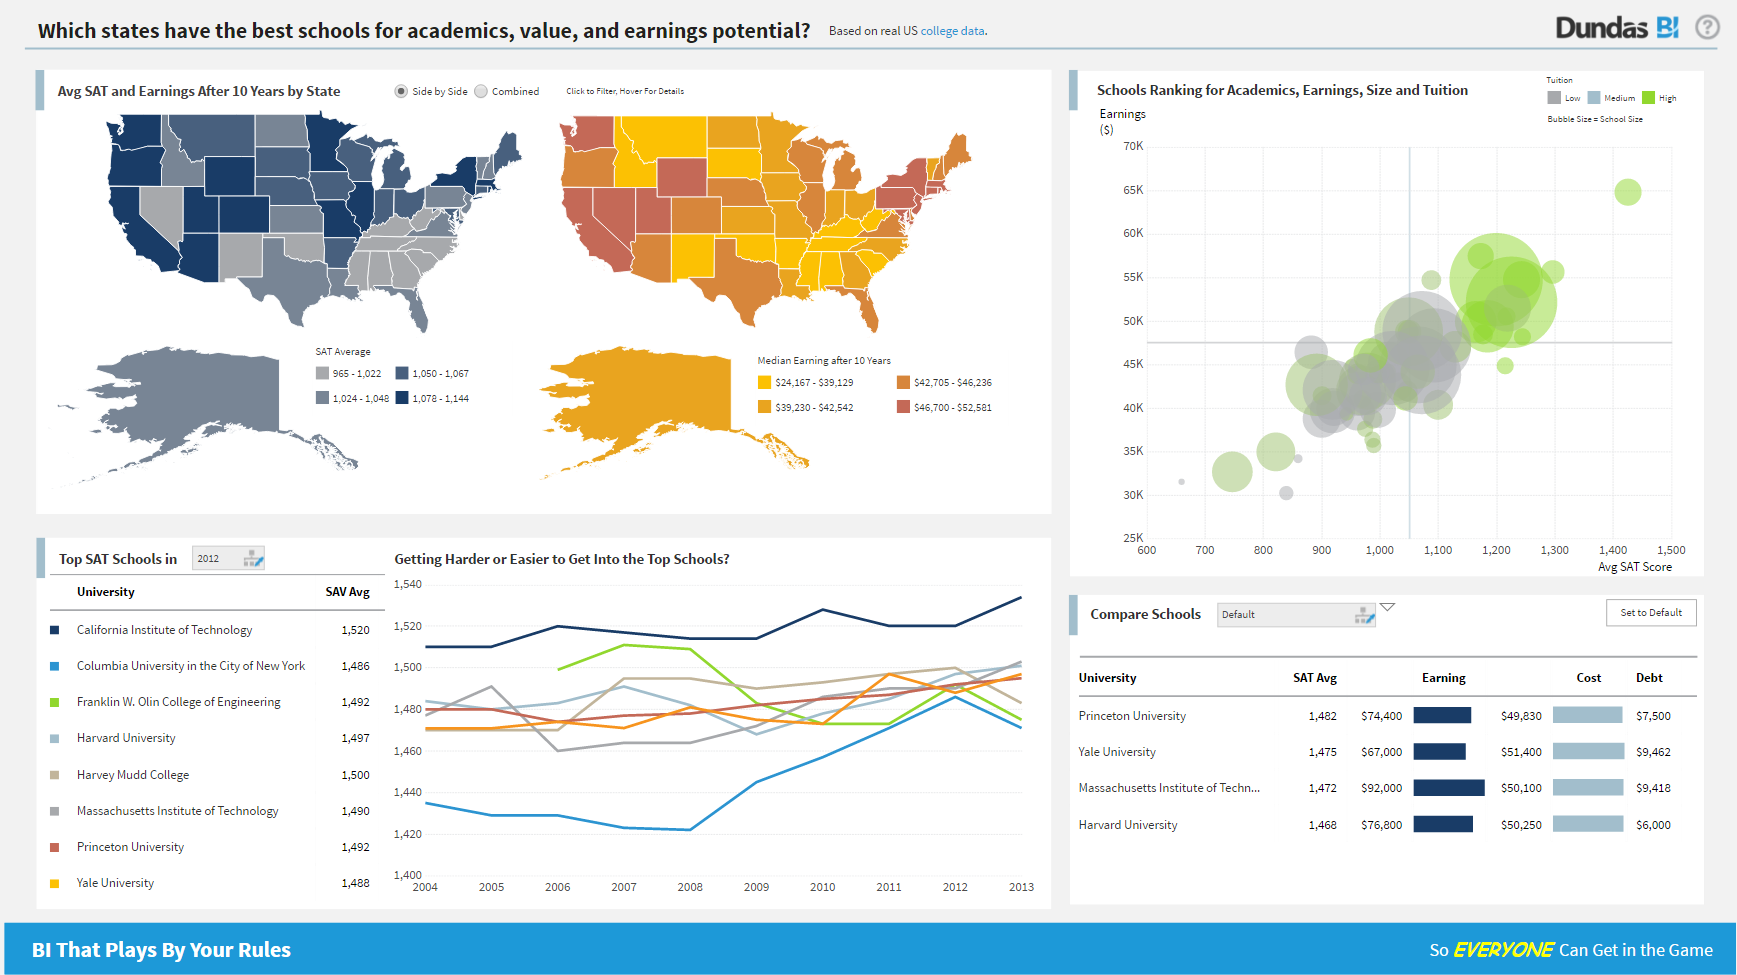
For all the scenarios I have so far worked on or I am currently working on, Dundas BI has proved to be more than adequate and apt to handle all of those. It is a very easy-to-use tool with quick shortcuts enabling you to prepare ad-hoc reports or dashboards in a matter of minutes.
A de minimis incentive was given to thank the reviewer for their time. The incentive was not used to bias or drive a particular response, nor was the incentive contingent on a positive endorsement. More Info
>> Using SAC predictive analytics capabilities for inventory management in a Production line setup has helped generate Purchase Requisitions and Purchase Orders for raw or semi-finished goods without much head-banging into Demand management rules. It does it beautifully with seamless integration with HANA core MM and PP modules, along with BI integration. It has resulted in 30% greater warehouse storage capacity, thereby saving revenue from piled-up inventory and associated manpower costs. >> SAC sometimes shows latency in working out a large data set, thus giving a poor user experience compared to its competition. Also, it may occasionally show misinterpretations when embedding data from 3rd-party systems into the HANA core dataset.
A de minimis incentive was given to thank the reviewer for their time. The incentive was not used to bias or drive a particular response, nor was the incentive contingent on a positive endorsement. TR verified that a representative sample of customers was invited. More Info
Project organization from Development to Production, you get a production and development license but I think the best way to do it is with DEV and Prod project in the Production box. Use the development box for testing updates and really crazy things. With the Dev and Prod projects on the same box, you just publish from Dev to Prod and you are done. Users only have access to the Prod projects so no one can mess up what you are working on.
Security - If you have a hierarchy (subsidiaries, divisions, department, teams) and you want each group to see only their data, then Security hierarchies are for you!
Dependent filters! What's this you ask? Here is an example of how it can be used, in your company you have departments and who works for what department is in your database. You make a dashboard that has a department filter (only show these departments), a managers filter, and employee filter. Not every manager or employee is in multiple departments usually only one. With dependent filters you can say that the manager and employee filter are dependent on what is selected in the departments filter so when you go to filter them they only show the managers or employees that are part of that department, and you can even it do so employees are not only dependent on department but on manager as well. Then it gets even better as it can be done in reverse as well so when you select a manager then go to the department it only shows the departments he works for (there are better situations where this is more useful).
It is scriptable! From calculate columns, null replacements, button actions, load actions, hover over events there a way to do what you want.
They are constantly improving and listens to your suggestions.
A de minimis incentive was given to thank the reviewer for their time. The incentive was not used to bias or drive a particular response, nor was the incentive contingent on a positive endorsement. More Info
It makes it easier yo analyse order and related records easily.
We can easily maintain and track the performance of employees in organisation.
Can easily track various aspects for the growth of an organisation thus allowing real time analysis and tracking of organisation's growth and performance.
A de minimis incentive was given to thank the reviewer for their time. The incentive was not used to bias or drive a particular response, nor was the incentive contingent on a positive endorsement. TR verified that a representative sample of customers was invited. More Info
Not too many cons for how we use the application. It really is easy and powerful. Very powerful.
Licensing is one thing that could be looked into. It is simple, but a little confusing. For example, if I get a license today, but a new release comes out tomorrow, it seems that the license doesn't work with the new release. Maybe that is by design, but it would be nice to clearly understand.
SAC supports various data sources, but improvements in the ease of connecting to and integrating with certain data repositories, especially non-SAP databases, would enhance the platform's versatility and integration capabilities.
An offline mode for SAC could be valuable for users who need to access and analyze data without an internet connection. Additionally, optimizing performance for large datasets and complex visualizations would contribute to a smoother user experience.
A de minimis incentive was given to thank the reviewer for their time. The incentive was not used to bias or drive a particular response, nor was the incentive contingent on a positive endorsement. TR verified that a representative sample of customers was invited. More Info
We are planning to review the licensing as we have issues with SAC dealing with huge datasets. Analytics area is good for import models but when we have live connections in place that's when we have issue with SAC dealing with huge datasets in live be it BW or be it HANA models in the backend.
A de minimis incentive was given to thank the reviewer for their time. The incentive was not used to bias or drive a particular response, nor was the incentive contingent on a positive endorsement. TR verified that a representative sample of customers was invited. More Info
We are still in the implementation phase, but so far we are finding it to be easy to use and learn. The eLearning courses that they have made available for free, as well as User Forums and other training videos have made even difficult concepts easier to understand.
I landed on a 7 out of 10 for a few key reasons. The tool is flexible in the sense that we are using very very very (very) little off the shelf solutions and customizing to our needs. Users enjoy having the customized data actions, key variance calculations, and easy to use headcount/salary planning in the same tool. One downside is that users are hard to please when they are used to excel. SAP Analytics Cloud simply is not excel, and the flexibility of excel in a crunch is not there.
A de minimis incentive was given to thank the reviewer for their time. The incentive was not used to bias or drive a particular response, nor was the incentive contingent on a positive endorsement. TR verified that a representative sample of customers was invited. More Info
I would rate SAP Analytics Cloud an 8 out of 10 for scalability. It offers a flexible, cloud-based architecture that supports expansion across departments and geographies. The platform adapts well to growing data volumes and user needs, making it a strong choice for organizations looking to scale analytics capabilities efficiently.
A de minimis incentive was given to thank the reviewer for their time. The incentive was not used to bias or drive a particular response, nor was the incentive contingent on a positive endorsement. TR verified that a representative sample of customers was invited. More Info
I would rate SAP Analytics Cloud’s performance an 8 out of 10. Pages generally load quickly, and reports run within a reasonable time frame, even with complex datasets. Integration with other systems is smooth and doesn’t noticeably affect performance. Overall, it’s a responsive and efficient tool for business analytics. But
A de minimis incentive was given to thank the reviewer for their time. The incentive was not used to bias or drive a particular response, nor was the incentive contingent on a positive endorsement. TR verified that a representative sample of customers was invited. More Info
We have bi-weekly calls with our Success Manager, as well as access to support as needed. Any question that I have had, multiple people have been willing and able to jump on a call to talk me through it, or send an email with the solution
Since the implementation stage, the support team has been very helpful and assisting. Even in the later stages, the tech team had quite a rapid response. In general, SAP has provided us with great customer support, let it be for a specific product of SAP or for integration of different modules.
A de minimis incentive was given to thank the reviewer for their time. The incentive was not used to bias or drive a particular response, nor was the incentive contingent on a positive endorsement. More Info
A de minimis incentive was given to thank the reviewer for their time. The incentive was not used to bias or drive a particular response, nor was the incentive contingent on a positive endorsement. TR verified that a representative sample of customers was invited. More Info
In hindsight, it would have been easier to have someone there in person. Questions were answered, but with 11 participants, it got a bit chaotic online
A de minimis incentive was given to thank the reviewer for their time. The incentive was not used to bias or drive a particular response, nor was the incentive contingent on a positive endorsement. TR verified that a representative sample of customers was invited. More Info
SAC is a simple solution ad it works fine when connecting it to other SAP tools. On the other hand, connecting it to third party solutions brings difficulties when there's no previous design and the objetives are not clear. It is really important to integrate Business users from the start to provide with valuable business insights
A de minimis incentive was given to thank the reviewer for their time. The incentive was not used to bias or drive a particular response, nor was the incentive contingent on a positive endorsement. TR verified that a representative sample of customers was invited. More Info
Per dollar spent, it offers the widest range of features of the tools that we evaluated. It offers lots of options for how to configure your environment, though they are not always intuitive to figure out. Having an ETL layer was a must have for us, as well as the ability to host to secure HIPAA compliance. It is not a replacement for ad hoc reporting, but does a great job of creating parameterized reports and dashboards that look great.
A de minimis incentive was given to thank the reviewer for their time. The incentive was not used to bias or drive a particular response, nor was the incentive contingent on a positive endorsement. More Info
SAP Analytics Cloud and Power BI are both tools that help businesses understand their data, but they have some differences. SAC, made by SAP, works well if your company already uses other SAP products. It's in the cloud, easy to use, and has features for analyzing data, getting insights, and planning for the future. Power BI, made by Microsoft, can be used in the cloud or on your own computers. It fits well with Microsoft tools, is easy to use, and can do advanced data analysis. SAC has built-in planning tools, while Power BI needs extra tools for detailed planning
A de minimis incentive was given to thank the reviewer for their time. The incentive was not used to bias or drive a particular response, nor was the incentive contingent on a positive endorsement. TR verified that a representative sample of customers was invited. More Info
A de minimis incentive was given to thank the reviewer for their time. The incentive was not used to bias or drive a particular response, nor was the incentive contingent on a positive endorsement. TR verified that a representative sample of customers was invited. More Info
Is good for use across multiple locations. It allows users to access data and reports from anywhere, regardless of their location. Can consolidate data from various sources, including different SAP systems and external sources, which facilitates cross-location analysis. SAC enables access to data and models from SAP Datasphere to create new stories. Detailed permissions can be defined for cross-departmental use.
A de minimis incentive was given to thank the reviewer for their time. The incentive was not used to bias or drive a particular response, nor was the incentive contingent on a positive endorsement. TR verified that a representative sample of customers was invited. More Info
A de minimis incentive was given to thank the reviewer for their time. The incentive was not used to bias or drive a particular response, nor was the incentive contingent on a positive endorsement. TR verified that a representative sample of customers was invited. More Info
A de minimis incentive was given to thank the reviewer for their time. The incentive was not used to bias or drive a particular response, nor was the incentive contingent on a positive endorsement. More Info
Many manual data manipulations and exports in Excel have been replaced by the tool, providing management with improved insight into the amount of time spent at each stage of an invoice's lifetime, allowing bottlenecks to be discovered.
We now have more insight into the data, and people with little technical experience can easily build stories.
A de minimis incentive was given to thank the reviewer for their time. The incentive was not used to bias or drive a particular response, nor was the incentive contingent on a positive endorsement. TR verified that a representative sample of customers was invited. More Info