Looker Studio is a data visualization platform that transforms data into meaningful presentations and dashboards with customized reporting tools.
$9
per month per user per project
Rational BI
Score 7.7 out of 10
Enterprise companies (1,001+ employees)
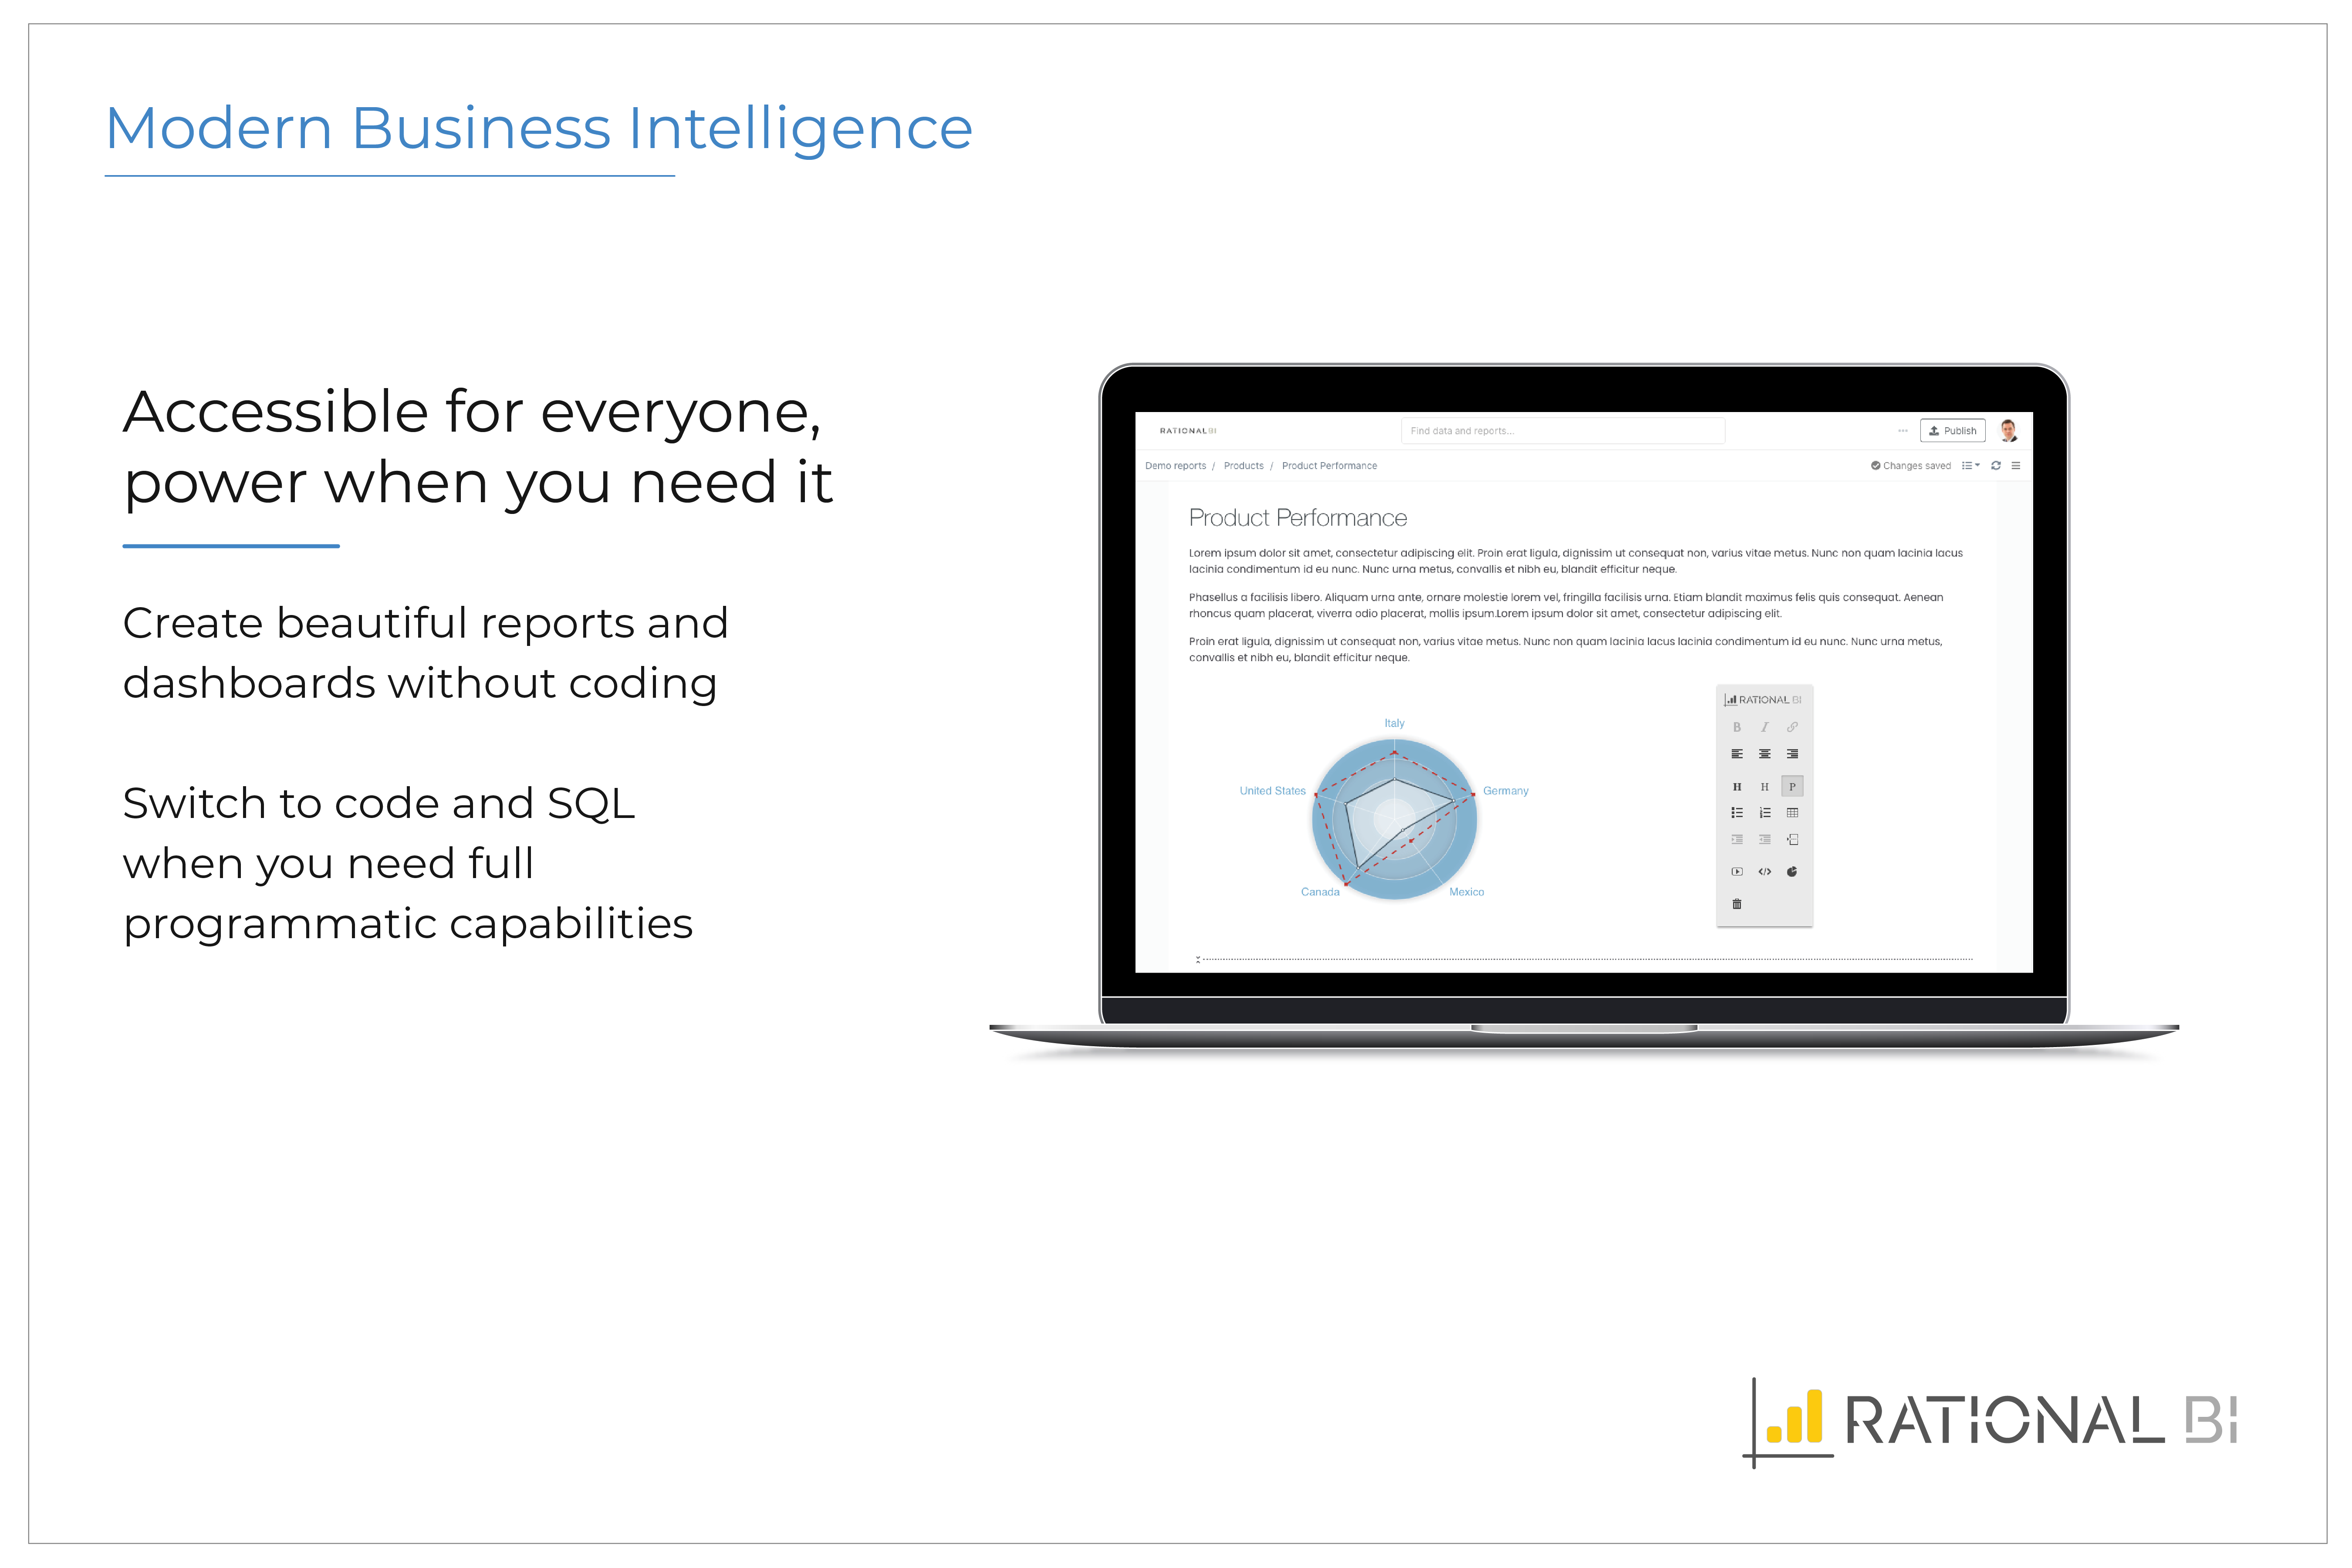
Rational BI provides analytics, data science and business intelligence in an analytical platform that connects to databases, data files and cloud drives including AWS and Azure data sources, enabling users to explore and visualize data. Users can build real-time notebook-style reports directly in a web browser with JavaScript and SQL with direct and live connections to data. Filter and query data with an SQL database embedded in the client, without network…
$0
single user
Pricing
Looker Studio
Rational BI
Editions & Modules
Looker Studio Pro
$9
per month per user per project
Looker Studio
No charge
Free
$0
single user
Professional
$129
single user
Enterprise
Varies
single user
Offerings
Pricing Offerings
Looker Studio
Rational BI
Free Trial
No
Yes
Free/Freemium Version
Yes
Yes
Premium Consulting/Integration Services
No
Yes
Entry-level Setup Fee
No setup fee
Optional
Additional Details
—
Additional cost per extra user (varies by edition)
More Pricing Information
Community Pulse
Looker Studio
Rational BI
Features
Looker Studio
Rational BI
BI Standard Reporting
Comparison of BI Standard Reporting features of Product A and Product B
Looker Studio
7.1
62 Ratings
13% below category average
Rational BI
8.3
4 Ratings
3% above category average
Pixel Perfect reports
6.743 Ratings
7.63 Ratings
Customizable dashboards
7.461 Ratings
8.74 Ratings
Report Formatting Templates
7.359 Ratings
8.54 Ratings
Ad-hoc Reporting
Comparison of Ad-hoc Reporting features of Product A and Product B
Looker Studio
7.7
61 Ratings
1% below category average
Rational BI
8.3
4 Ratings
6% above category average
Drill-down analysis
7.151 Ratings
7.73 Ratings
Formatting capabilities
7.257 Ratings
8.24 Ratings
Integration with R or other statistical packages
6.929 Ratings
8.03 Ratings
Report sharing and collaboration
9.759 Ratings
9.24 Ratings
Report Output and Scheduling
Comparison of Report Output and Scheduling features of Product A and Product B
Looker Studio
8.2
60 Ratings
0% above category average
Rational BI
9.0
4 Ratings
10% above category average
Publish to Web
8.353 Ratings
9.03 Ratings
Publish to PDF
8.853 Ratings
9.04 Ratings
Report Versioning
8.139 Ratings
8.63 Ratings
Report Delivery Scheduling
7.942 Ratings
9.24 Ratings
Delivery to Remote Servers
7.624 Ratings
9.33 Ratings
Data Discovery and Visualization
Comparison of Data Discovery and Visualization features of Product A and Product B
Visualizing cross-channel campaign performance can blend data from a few different sources to compare performance metrics like spend, clicks, and conversions side-by-side in a single view, which helps in quick budget reallocation decisions. When dealing with massive volumes of data (millions of rows) or highly complex queries, Looker Studio dashboards can become slow, laggy, or even crash. Performance issues are a frequent complaint when working with large datasets, making it unsuitable for enterprise-level companies
Definitely well suited for small companies, but again many of their competitors are also well suited in this segment. We were in general happy with the solution provided, but I'm not blown away by their solution or support. If you want to get more data-driven visual boards with data displayed in nice graphics is in my opinion a good start, and here Rational BI delivers what it should.
Breath of data - the number of ways to interrogate the data is endless, and the options to view metrics alongside each other make for comprehensive datasets.
Data visualisation and customisation - the options for presenting data and separating out across pages allow for clean visuals and segmented information.
Easy shareability/usability - a quick and simple tool to introduce colleagues to, and easy to grant access for them to be able to view the data, without having to understand the setup itself.
It needs better handling of complex logic. We often need workarounds to perform complex custom calculations, and it can be really unpleasant at times.
Felt it got slow with a larger data set, and in one minor report, we had to set up time filters so that calculations during spikes could be traced more quickly.
Compare to competition they need to improve with notification things.
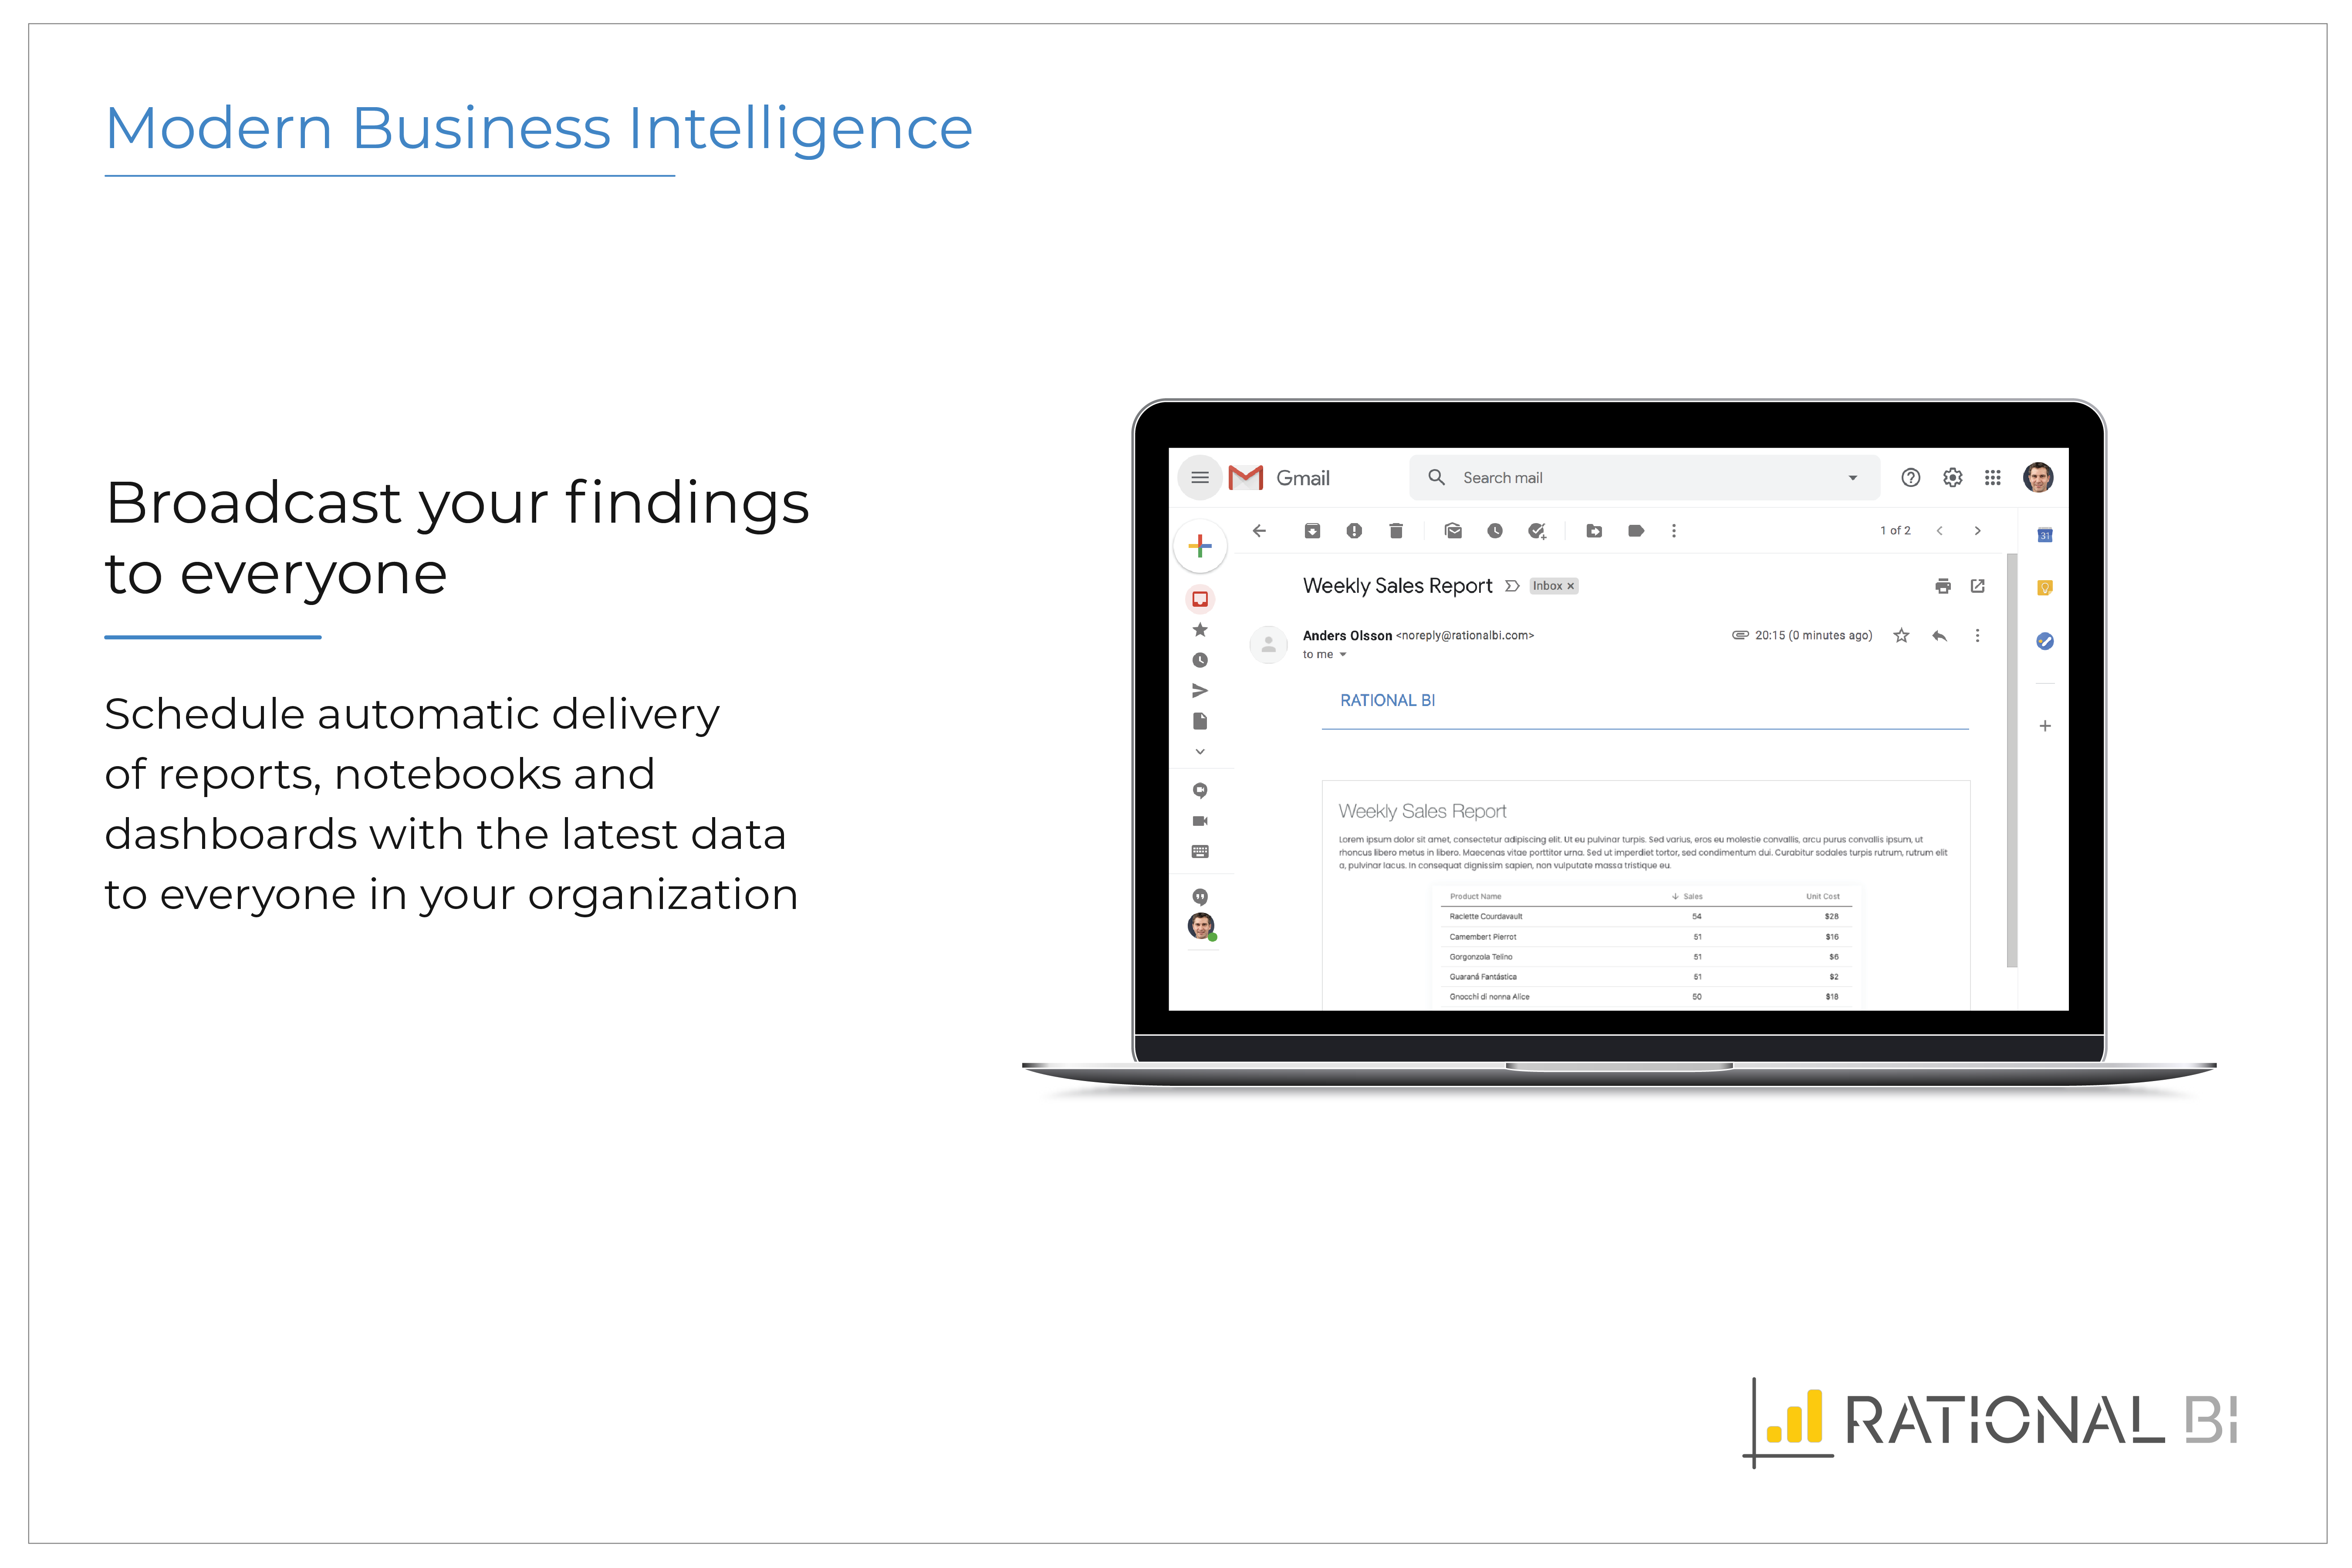
It is the simplest and least expensive way for us to automate our reporting at this time. I like the ability to customize literally everything about each report, and the ability to send out reports automatically in emails. The only issue we have been having recently is a technical glitch in the automatic email report. Sadly, there is almost no support for this tool from Google, but is also free, so that is important to take into consideration
Looker Studio is easy to use, and it offers a sufficient variety of predefined visualizations to choose from. It's easy for us, and anyone can set up basic reporting without extensive data visualization skills. The interface layout is easy to understand, and it doesn't take long to get used to.
Overall Rational BI is a valuable enterprise reporting tool for any data driven organization. It offers great depth and breadth of features for reporting and analytics that can lead to better business outcomes. Its easy to use and highly configurable to evolve to changing reporting needs of organizations of any scale.
I give it a lower support rating because it seems like our Dev team hasn't gotten the support they need to set up our database to connect. Seems like we hit a roadblock and the project got put on pause for dev. That sucks for me because it is harder to get the dev team to focus on it if they don't get the help they need to set it up.
I haven't used the support myself, but my colleagues have been satisfied with the support. As I have understood from my colleagues the support is as you could expect. Still, the documentation could be better and that could avoid the need to contact their support, but overall we're still happy with the support as well.
Looker Studio is far easier to implement, stand up, and learn. The interface is simpler and user-friendly for various levels of data visualization/analysis knowledge and experience. The biggest benefit of Looker Studio, however, is its ease of connection to GA data and speed. Furthermore, since it is an online program/tool, it requires less CPU/battery/storage on the user's device.
Rational BI allows a deeper data analysis with respect to the other software I experimented with. The velocity to perform the analysis is similar to the other one. The predictive analysis could be very useful, but at the moment I do not use it in my activities. Dashboards are nice and easy to understand.