Looker vs. Sellerview.AI

Overview
ProductRatingMost Used ByProduct SummaryStarting Price
Looker
Score 8.2 out of 10
N/A
Looker is a BI application with an analytics-oriented application server that sits on top of relational data stores. It includes an end-user interface for exploring data, a reusable development paradigm for data discovery, and an API for supporting data in other systems.N/A
Sellerview.AI
Score 0.0 out of 10
Small Businesses (1-50 employees)
Sellerview.ai is a profit intelligence platform for Amazon FBA and FBM sellers. The system provides SKU-level profitability analysis by calculating net margins after accounting for Amazon fees, advertising costs, and product returns. Core Features SKU-level P&L: Generates Profit and Loss (P&L) statements for individual products, incorporating FBA charges, ad spend, and return costs. Advertising Performance: Tracks Total Advertising Cost of Sale…
$18
per month per user
Pricing
LookerSellerview.AI
Editions & Modules
No answers on this topic
Starter
$18
per month per user
Growth
$30
per month per user
Scale
$59
per month per user
Pro
$119
per month per user
Offerings
Pricing Offerings
LookerSellerview.AI
Free Trial
YesYes
Free/Freemium Version
NoNo
Premium Consulting/Integration Services
YesYes
Entry-level Setup FeeRequiredNo setup fee
Additional DetailsMust contact sales team for pricing.Sellerview.ai offers SaaS pricing designed for Amazon sellers, aggregators, and growing eCommerce brands. Pricing may vary based on business size, number of SKUs, and reporting requirements. All plans include access to SKU-level profitability analytics, TACoS and ACoS tracking, ad spend visibility, margin analysis, and profit leak detection tools. A 30-day free trial is available for new users, and custom onboarding or consulting support may be available for larger teams and enterprise accounts. A discount is available for annual billing.
More Pricing Information
Community Pulse
LookerSellerview.AI
Features
LookerSellerview.AI
BI Standard Reporting
Comparison of BI Standard Reporting features of Product A and Product B
Looker
7.4
134 Ratings
10% below category average
Sellerview.AI
-
Ratings
Pixel Perfect reports6.5110 Ratings00 Ratings
Customizable dashboards8.3133 Ratings00 Ratings
Report Formatting Templates7.5115 Ratings00 Ratings
Ad-hoc Reporting
Comparison of Ad-hoc Reporting features of Product A and Product B
Looker
6.9
132 Ratings
15% below category average
Sellerview.AI
-
Ratings
Drill-down analysis6.4128 Ratings00 Ratings
Formatting capabilities6.6130 Ratings00 Ratings
Integration with R or other statistical packages5.655 Ratings00 Ratings
Report sharing and collaboration8.8131 Ratings00 Ratings
Report Output and Scheduling
Comparison of Report Output and Scheduling features of Product A and Product B
Looker
7.9
128 Ratings
4% below category average
Sellerview.AI
-
Ratings
Publish to Web7.7105 Ratings00 Ratings
Publish to PDF7.9113 Ratings00 Ratings
Report Versioning7.984 Ratings00 Ratings
Report Delivery Scheduling8.3110 Ratings00 Ratings
Data Discovery and Visualization
Comparison of Data Discovery and Visualization features of Product A and Product B
Looker
6.6
128 Ratings
19% below category average
Sellerview.AI
-
Ratings
Pre-built visualization formats (heatmaps, scatter plots etc.)7.7124 Ratings00 Ratings
Location Analytics / Geographic Visualization7.5110 Ratings00 Ratings
Predictive Analytics4.66 Ratings00 Ratings
Access Control and Security
Comparison of Access Control and Security features of Product A and Product B
Looker
7.4
128 Ratings
14% below category average
Sellerview.AI
-
Ratings
Multi-User Support (named login)7.6120 Ratings00 Ratings
Role-Based Security Model7.2105 Ratings00 Ratings
Multiple Access Permission Levels (Create, Read, Delete)7.2122 Ratings00 Ratings
Report-Level Access Control7.360 Ratings00 Ratings
Mobile Capabilities
Comparison of Mobile Capabilities features of Product A and Product B
Looker
5.2
95 Ratings
39% below category average
Sellerview.AI
-
Ratings
Responsive Design for Web Access5.191 Ratings00 Ratings
Mobile Application5.01 Ratings00 Ratings
Dashboard / Report / Visualization Interactivity on Mobile5.985 Ratings00 Ratings
Best Alternatives
LookerSellerview.AI
Small Businesses
Yellowfin
Yellowfin
Score 8.6 out of 10
Webgility
Webgility
Score 9.6 out of 10
Medium-sized Companies
Reveal
Reveal
Score 10.0 out of 10
Hotjar
Hotjar
Score 8.0 out of 10
Enterprises
Kyvos Semantic Layer
Score 9.5 out of 10
Google Analytics
Google Analytics
Score 8.3 out of 10
All AlternativesView all alternativesView all alternatives
User Ratings
LookerSellerview.AI
Likelihood to Recommend
8.1
(134 ratings)
-
(0 ratings)
Likelihood to Renew
9.2
(8 ratings)
-
(0 ratings)
Usability
8.8
(12 ratings)
-
(0 ratings)
Availability
10.0
(1 ratings)
-
(0 ratings)
Performance
6.0
(1 ratings)
-
(0 ratings)
Support Rating
8.8
(14 ratings)
-
(0 ratings)
Implementation Rating
10.0
(1 ratings)
-
(0 ratings)
Configurability
10.0
(1 ratings)
-
(0 ratings)
Contract Terms and Pricing Model
10.0
(1 ratings)
-
(0 ratings)
Ease of integration
10.0
(1 ratings)
-
(0 ratings)
Product Scalability
10.0
(1 ratings)
-
(0 ratings)
Professional Services
10.0
(1 ratings)
-
(0 ratings)
Vendor post-sale
10.0
(1 ratings)
-
(0 ratings)
Vendor pre-sale
10.0
(1 ratings)
-
(0 ratings)
User Testimonials
LookerSellerview.AI
Likelihood to Recommend
Google
When data drives potential for new orders, Looker earns its place in our tech stack. If, on the other hand, we are hoping for pipeline generation, Looker is useful if you are willing to repeatedly go check customer utilizations .... it is not appropriate if you are hoping to automate data analysis for this purpose.
Read full review
Sellerview.ai
No answers on this topic
Pros
Google
  • Show visited pages - sessions, pageviews - which programs are viewed the most.
  • Displays session source/medium views to see where users are coming from.
  • It shows the video titles, URLs, and event counts so we can monitor the performance of our videos.
  • It gives a graphic face to the numbers, such as using bar charts, pie graphs, and other charts to show user trends or which channels are driving engagement.
  • Our clients like to see the top pages visited for a month.
  • I like the drop-and-drag approach, and building charts is a little easier than it was before.
Read full review
Sellerview.ai
No answers on this topic
Cons
Google
  • Documentation is scarce, and very difficult to find when you need it.
  • Pricing is unclear, particularly as you look to scale your reports across the business.
  • Data from other sources is not represented in the system as well as first party Google services.
Read full review
Sellerview.ai
No answers on this topic
Likelihood to Renew
Google
I give it this rating because it deems as effective, I am able to complete majority of my tasks using this app. It is very helpful when analyzing the data provided and shown in the app and it's just overall a great app for Operational use, despite the small hiccups it has (live data).
Read full review
Sellerview.ai
No answers on this topic
Usability
Google
Looker is relatively easy to use, even as it is set up. The customers for the front-end only have issues with the initial setup for looker ml creations. Other "looks" are relatively easy to set up, depending on the ETL and the data which is coming into Looker on a regular basis.
Read full review
Sellerview.ai
No answers on this topic
Reliability and Availability
Google
No objections
Read full review
Sellerview.ai
No answers on this topic
Performance
Google
Somehow resources heavy, both on server and client. I recommned at least 50Mbs data rate and high performance desktop comouter to be abke to run comolex tasks and configure larger amount of data. On the other hand, the client does not need to worry when viewing, the performance is usually ok
Read full review
Sellerview.ai
No answers on this topic
Support Rating
Google
Never had to work with support for issues. Any questions we had, they would respond promptly and clearly. The one-time setup was easy, by reading documentation. If the feature is not supported, they will add a feature request. In this case, LDAP support was requested over OKTA. They are looking into it.
Read full review
Sellerview.ai
No answers on this topic
Implementation Rating
Google
Very satisfied, easy to implement
Read full review
Sellerview.ai
No answers on this topic
Alternatives Considered
Google
Looker Studio, you can easily report on data from various sources without programming. Looker Studio is available at no charge for creators and report viewers. Enterprise customers who upgrade to Looker Studio Pro will receive support and expanded administrative features, including team content management. So it's good.
Read full review
Sellerview.ai
No answers on this topic
Contract Terms and Pricing Model
Google
Perfect price to performance
Read full review
Sellerview.ai
No answers on this topic
Return on Investment
Google
  • Looker has a poignant impact on our business's ROI objectives. As an advertising exchange we have specific goals for daily requests and fill, and having premade Looks to monitor this is an integral piece of our operational capability
  • To facilitate an efficient monthly billing cycle in our organization, Looker is essential to track estimated revenue and impression delivery by publisher. Without the Looks we have set up, we would spend considerably more time and effort segmenting revenue by vertical.
  • Looker's unique value proposition is making analytical tools more digestible to people without conventional analytical experience. Other competing tools like Tableau require considerably more training and context to successfully use, and the ability to easily plot different visualizations is one of its greatest selling points.
Read full review
Sellerview.ai
No answers on this topic
ScreenShots

Looker Screenshots

Screenshot of a Looker dashboard with a geo chart.

Sellerview.AI Screenshots

Screenshot of Sellerview.ai’s Dashboard, which provides Amazon sellers with a centralized view of business performance, profitability trends, and operational health across their catalog. The dashboard combines sales, ad spend, and net profit analytics into a single visual interface, helping sellers understand how revenue and profitability change over time.

Users can analyze performance by SKU, ASIN, marketplace, and date range while tracking key metrics such as total sales, advertising clicks, total units sold, order volume, ad conversion rate, refunds, and net profit. The Profit Health visualization makes it easy to identify profit fluctuations, rising ad costs, and performance anomalies before they impact overall margins.

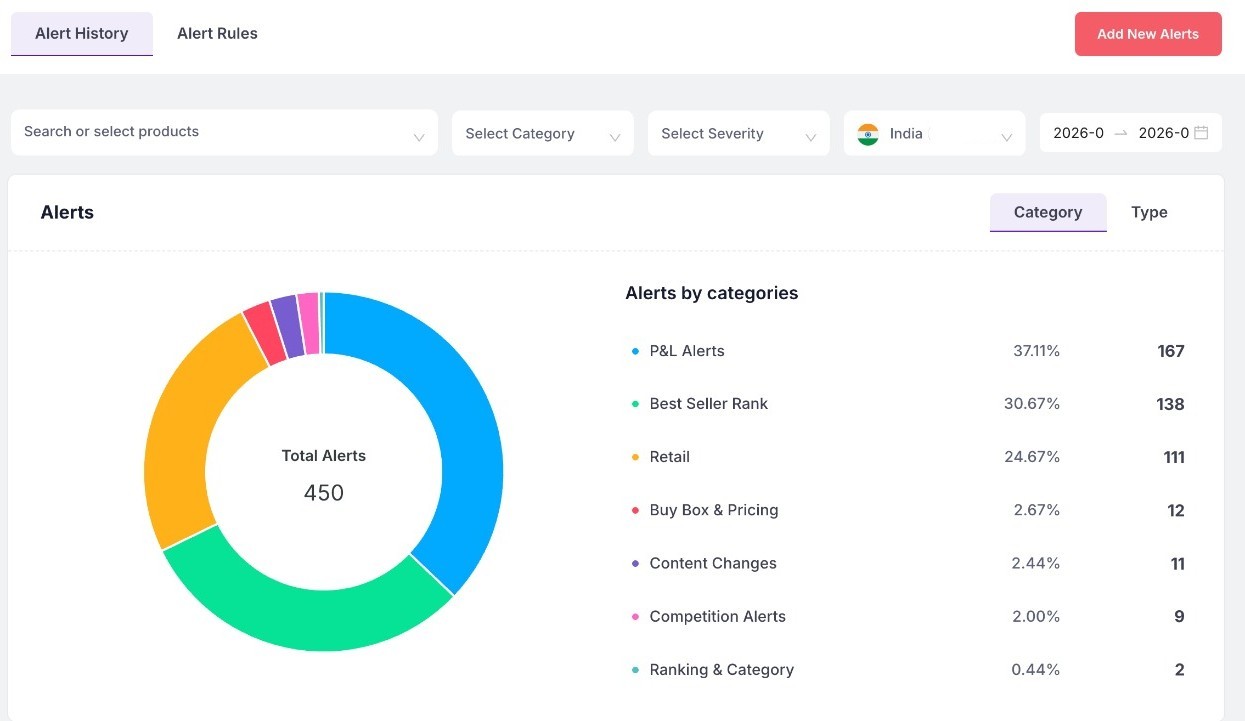
Advanced filtering, customizable columns, and export functionality allow teams to create focused reports and monitor the metrics most relevant to their business. The dashboard is designed to help Amazon brands make faster, data-driven decisions and scale operations more profitably.Screenshot of Sellerview.ai’s Alert System, which helps Amazon sellers proactively monitor critical changes affecting profitability, product performance, and marketplace visibility. The dashboard provides categorized real-time alerts across P&L performance, Best Seller Rank (BSR), retail activity, Buy Box changes, pricing fluctuations, content modifications, competition tracking, and ranking movements.

Users can filter alerts by product, category, severity, marketplace, and date range to quickly identify issues that need immediate attention. The visual alert breakdown is used to understand which operational areas are generating the highest impact and where profit risks may be emerging.

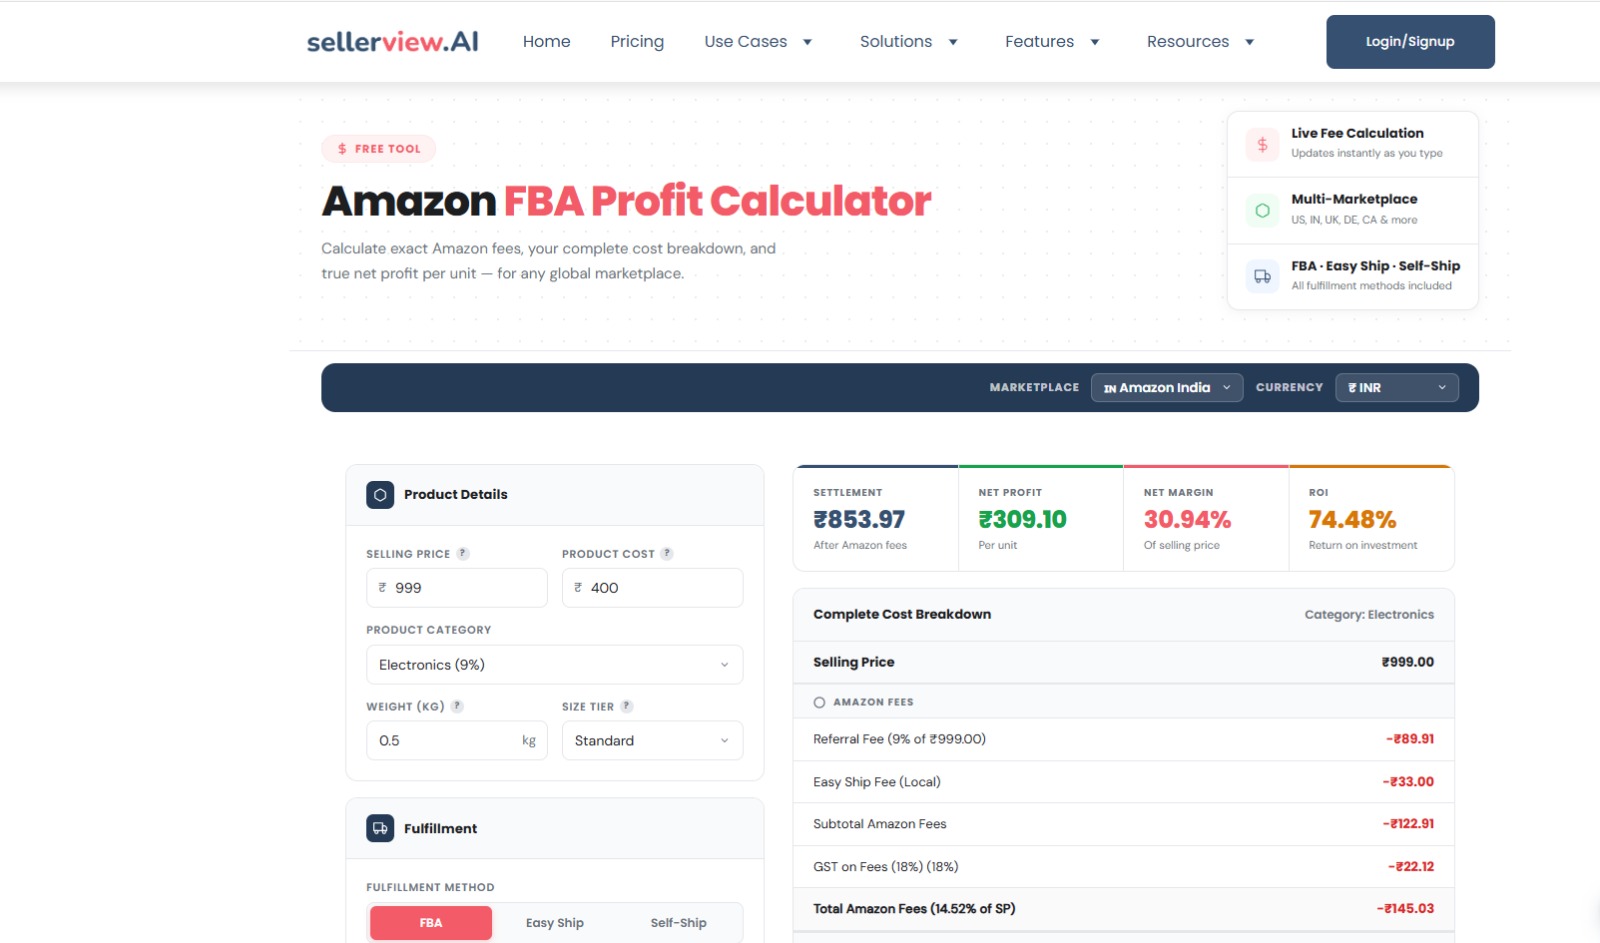
This feature is designed to help Amazon brands react faster, reduce hidden profit leaks, and stay ahead of operational and competitive changes across their catalog.Screenshot of Sellerview.ai’s Amazon FBA Profit Calculator, which helps sellers estimate product profitability before launching or scaling products on Amazon. The tool provides a complete breakdown of Amazon fees, fulfillment costs, margins, ROI, and net profit per unit across multiple marketplaces and fulfillment methods.

Users can calculate profitability by entering selling price, product cost, category, weight, size tier, and fulfillment method, including FBA, Easy Ship, and Self-Ship options. The calculator automatically estimates referral fees, shipping charges, GST, and other Amazon-related costs to provide a real-time view of actual earnings.

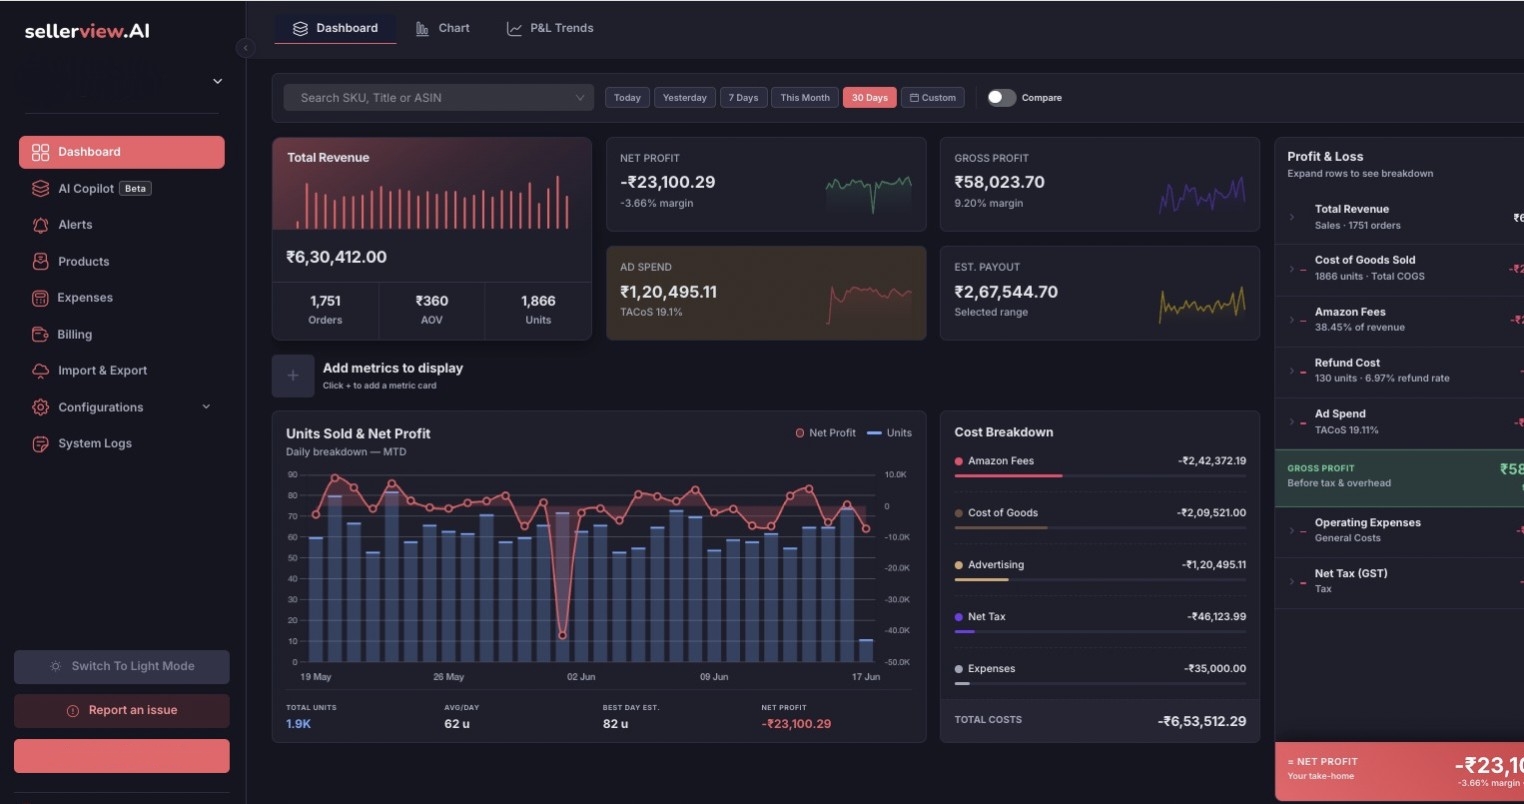
The tool supports multiple marketplaces and currencies, making it useful for global Amazon sellers managing operations across different regions. By simplifying cost analysis and fee calculations, the FBA Profit Calculator helps sellers make better pricing, sourcing, and inventory decisions while reducing hidden profitability risks.Screenshot of New updated dark theme dashboard