
Jessé Paixão
Analista de operações de TI
Chose Microsoft BI (MSBI)
Microsoft BI (MSBI) is the first data mining and processing tool I've used.
| Product | Rating | Most Used By | Product Summary | Starting Price |
|---|---|---|---|---|
 Microsoft BI (MSBI) | N/A | Microsoft BI is a business intelligence product used for data analysis and generating reports on server-based data. It features unlimited data analysis capacity with its reporting engine, SQL Server Reporting Services alongside ETL, master data management, and data cleansing. | $14 per month per user | |
 Panorama Necto | N/A | Panorama Necto is a business intelligence solution that provides enterprises with new ways to collaborate and create unique contextual connections. Some key features include: Workboards/Dashboards, Advanced Analytics, and Contextual Discovery. | N/A |
| Microsoft BI (MSBI) | Panorama Necto | |||||||||||||||
|---|---|---|---|---|---|---|---|---|---|---|---|---|---|---|---|---|
| Editions & Modules |
| No answers on this topic | ||||||||||||||
| Offerings |
| |||||||||||||||
| Entry-level Setup Fee | No setup fee | No setup fee | ||||||||||||||
| Additional Details | — | — | ||||||||||||||
| More Pricing Information | ||||||||||||||||
| Microsoft BI (MSBI) | Panorama Necto | |
|---|---|---|
| Considered Both Products | Microsoft BI (MSBI) Jessé Paixão Analista de operações de TI Chose Microsoft BI (MSBI) Microsoft BI (MSBI) is the first data mining and processing tool I've used.  Adam Montgomery Partnership Manager Chose Microsoft BI (MSBI) We use Microsoft BI because our organization has all of its software in the Microsoft ecosystem. It just made sense to utilize Microsoft BI because it can so seamlessly connect to all of the other Microsoft tools and data sources that we were using before. We often find that …  Al Mubassir Muin Software Engineer Chose Microsoft BI (MSBI) Better integration with Microsoft products is one of the advantages of using Business Intelligence (BI). It's simple to understand, and plenty of resources are available to outsource it. Many of our existing clients have Microsoft licensing agreements. It's an obvious path when …  Aononna Tazin Customer Relationship Management Specialist Chose Microsoft BI (MSBI) Outsourcing work is easy to understand, and there are plenty of resources available in the marketplace. It is expensive, but it is still significantly less costly than the alternatives. Results from Microsoft BI (MSBI) are dependable; therefore, there is no problem with trust. …  Nilufa Hossain IT Specialist Chose Microsoft BI (MSBI) MSBI is great for data collection and reporting, but it lacks the visual appeal and features of Power BI. Even though it's still useful, it falls short of Power BI in terms of features. There's no reason to doubt MSBI's findings. MSBI has a proactive customer service team that …  Hrishikesh Kardile Logistics Analyst Chose Microsoft BI (MSBI) Microsoft BI is much cheaper.  Shelby Bowden Graduate Research Assistant Chose Microsoft BI (MSBI) Specific data displays are some of the strongest aspects of Microsoft BI when compared to alternate programs. It also does a superior job in compatibility with many programs, especially those from Microsoft. Since my company primarily uses Office 365 and other Microsoft …  Michael Timms Information Technology Supervisor Chose Microsoft BI (MSBI) To be honest, I have never used anything similar to PowerBI. I have seen reports that come from Whatagraph, but I have never used it myself, so that is the only application that I can sort of compare it too. Just looking at the visuals from both, PowerBI reports are better … |  Panorama Necto  Hema Malini Senior Software Engineer Chose Panorama Necto Tableau Desktop and Pentaho  Felix BOGNOU Datawarehouse and BI Architect Chose Panorama Necto Panorama Necto is a very self service BI, data discovery and automation tool. It empowers business users with data discovery tools.  Malabyajit Roy IT Analyst Chose Panorama Necto More visually enriched infographics and geo analytics and lower license cost means Panorama is a front runner in comparison to the tools mentioned above.  Sarmista Nath Senior Sofware Engineer Chose Panorama Necto No I have not used any other self service BI tool.  Nidhish Khare BI Developer Chose Panorama Necto This is the next generation BI tool, which will be very helpful for small and medium businesses to kick start data exploration and visualization of their diverse databases, with less intervention from IT. This tool is more end user centric and gives way more power to the end …  Sidharth Dash Data Visualization and BI Consultant Chose Panorama Necto One of the best tools in the market available today. I started getting attached to this tool recently and this never stops amazing me. I can connect to a variety of data sources and quickly analyze my data. The best part of this product is the built-in intelligence system which … Chose Panorama Necto We compared Panorama Necto with another leading product. Necto's cost and visual appeal were certainly winners.  Dileep Kumar Varala System Analyst Chose Panorama Necto We can visualize the data right away in Necto. Where as we have to create reports in SAP Business Objects to present it to the business user. The reports have to be scheduled at particular time to get the presentation. We need to have additional SDK code for SAP Business …  Dilip Prajapati BI Developer Chose Panorama Necto We have evaluated few small vendor's BI tools for reporting purposes. Among other BI tools, we found Necto is quite easy to use and provides very good data visualization. Also it provides collaboration features which are least supported by other BI tools.  Chittiappa Areyada QA Lead & Test Analyst Disney Consumer Products for Satwic Inc Chose Panorama Necto In comparison with Pentaho Business Analytics, Panorama Necto 14 is providing similar features where it is distinguished through its provision of a suggestive analytics feature. This is fairly unique to the Panorama Necto 14 software where it analyzes information from various …  Snehal Katariya CSM, CSPO Product Owner / Business Analyst Chose Panorama Necto  Rajan Patel BI Intelligence Developer Chose Panorama Necto It works very well with Microsoft tools and platforms.  Aditya Singh Programmer Analyst Chose Panorama Necto We are evaluating different data visualization tools and recently I tried Panorama Necto. I was really amazed with this product as it's a new age technology and powerful tool for visualizing data, creating reports. It comes with Infographics which is great and best unique …  manshul goel IT Analyst Chose Panorama Necto we are assessing latest BI tools available in market for customer  Soumya Roy Senior BI Analyst Chose Panorama Necto All the above mentioned BI tools are complex from a maintenance perspective. They are not easy to learn. All those BI tools have limited cloud based reporting capability. Whereas Necto is a fully web based self service BI tool. It's collaborative capability makes it stack up …  Lewis Ewing UI Designer Chose Panorama Necto It provides attractive info-graphics according to user's interest. Their visual materiels are modern and stylish. You can use the same dashboard everywhere. Necto always keeps you up-to-date through mobile devices. It gives you many automated analysis and recommendations …  Gaurav Pandya Data Analyst Chose Panorama Necto Collaboration on data is super powerful in the case of Necto and wins all the medals compared to other BI tools. The real time analysis for decision making is extremely easy and just a click away, which is really not a smooth case for other BI tools.  GP Nath Data Analyst Chose Panorama Necto
 Milos Milenkovic Senior Business Intelligence/Reporting Developer Chose Panorama Necto Tableau, QlikView, Power BI, Klipfolio, Zoho Reports... |
| Microsoft BI (MSBI) | Panorama Necto | |||||||||||||||||||||
|---|---|---|---|---|---|---|---|---|---|---|---|---|---|---|---|---|---|---|---|---|---|---|
| BI Standard Reporting |
| |||||||||||||||||||||
| Ad-hoc Reporting |
| |||||||||||||||||||||
| Report Output and Scheduling |
| |||||||||||||||||||||
| Data Discovery and Visualization |
| |||||||||||||||||||||
| Access Control and Security |
| |||||||||||||||||||||
| Mobile Capabilities |
| |||||||||||||||||||||
| Application Program Interfaces (APIs) / Embedding |
|
| Microsoft BI (MSBI) | Panorama Necto | |
|---|---|---|
| Small Businesses |  Yellowfin Score 8.6 out of 10 | Yellowfin Score 8.6 out of 10 |
| Medium-sized Companies |  Reveal Score 10.0 out of 10 | Reveal Score 10.0 out of 10 |
| Enterprises |  Kyvos Semantic Layer Score 9.5 out of 10 | Kyvos Semantic Layer Score 9.5 out of 10 |
| All Alternatives | View all alternatives | View all alternatives |
| Microsoft BI (MSBI) | Panorama Necto | |
|---|---|---|
| Likelihood to Recommend | 8.9 (0 ratings) | 8.0 (0 ratings) |
| Likelihood to Renew | 8.0 (0 ratings) | 8.0 (0 ratings) |
| Usability | 8.9 (0 ratings) | 8.2 (0 ratings) |
| Availability | 9.5 (0 ratings) | - (0 ratings) |
| Performance | 7.0 (0 ratings) | - (0 ratings) |
| Support Rating | 8.9 (0 ratings) | 7.1 (0 ratings) |
| In-Person Training | 6.9 (0 ratings) | - (0 ratings) |
| Online Training | 8.5 (0 ratings) | - (0 ratings) |
| Implementation Rating | 9.6 (0 ratings) | 6.7 (0 ratings) |
| Configurability | 10.0 (0 ratings) | - (0 ratings) |
| Microsoft BI (MSBI) | Panorama Necto | |
|---|---|---|
| Likelihood to Recommend |
|
Soumya Roy Senior BI Analyst |
| Pros |
|
Sarmista Nath Senior Sofware Engineer |
| Cons |
|
Felix BOGNOU Datawarehouse and BI Architect |
| Likelihood to Renew |
 Lee Cullom President |
Lewis Ewing UI Designer |
| Usability |
|
Milos Milenkovic Senior Business Intelligence/Reporting Developer |
| Reliability and Availability |
 Boris Skylar Vice President, Application Systems | No answers on this topic |
| Performance |
 Robert Goodman Director, Business Intelligence & Analytics | No answers on this topic |
| Support Rating |
 Jacob Saunders National Practice Director - Business Intelligence |
Hema Malini Senior Software Engineer |
| In-Person Training |
 Stephanie Grice Business Intelligence Analyst | No answers on this topic |
| Online Training |
 Sean Brady Business Intelligence Architect | No answers on this topic |
| Implementation Rating |
Jacob Saunders National Practice Director - Business Intelligence |
Milos Milenkovic Senior Business Intelligence/Reporting Developer |
| Alternatives Considered |
Adam Montgomery Partnership Manager |
Chittiappa Areyada QA Lead & Test Analyst Disney Consumer Products for Satwic Inc |
| Return on Investment |
Nilufa Hossain IT Specialist | No answers on this topic |
| ScreenShots | Panorama Necto Screenshots 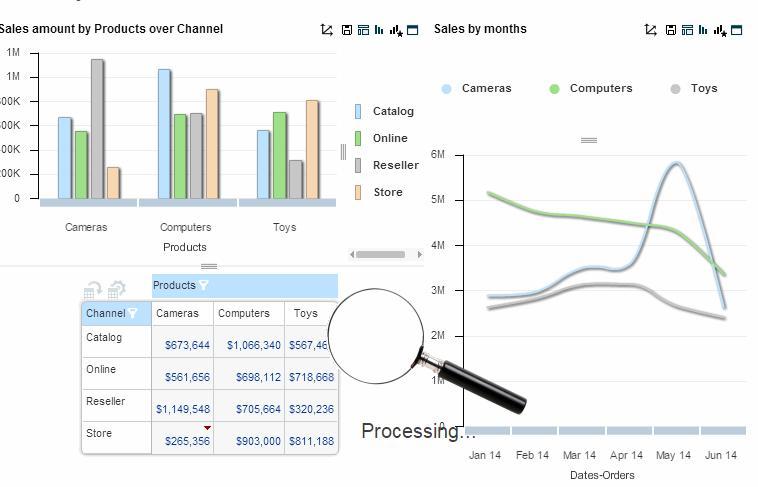 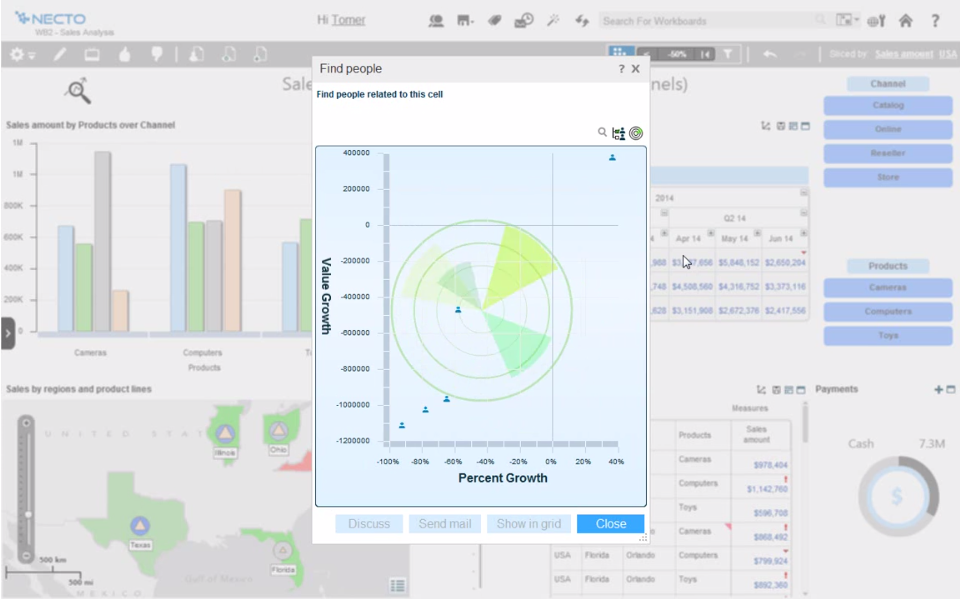   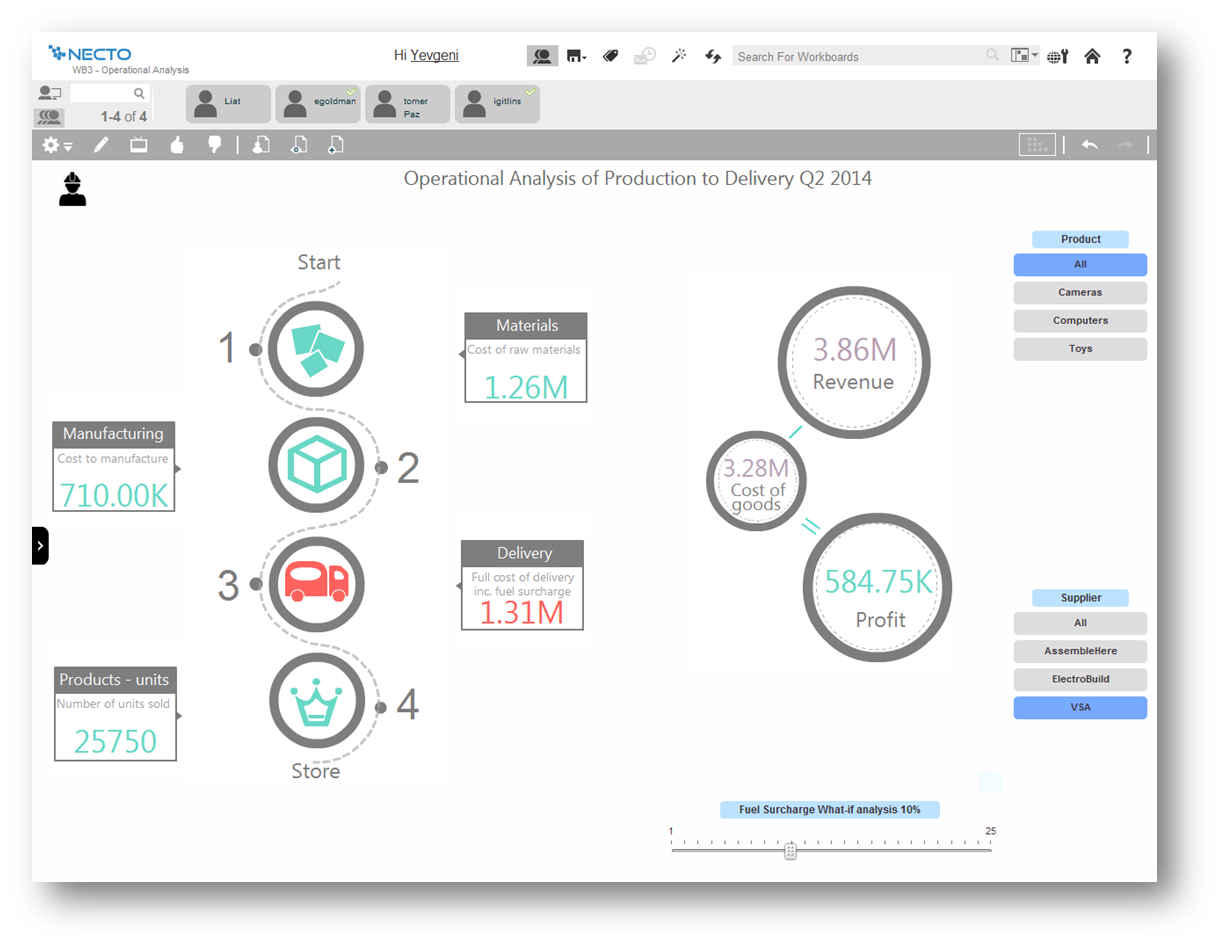 |
