Microsoft Power BI vs. Panorama Necto
Microsoft Power BI vs. Panorama Necto
| Product | Rating | Most Used By | Product Summary | Starting Price |
|---|---|---|---|---|
 Microsoft Power BI | N/A | Microsoft Power BI is a visualization and data discovery tool from Microsoft. It allows users to convert data into visuals and graphics, visually explore and analyze data, collaborate on interactive dashboards and reports, and scale across their organization with built-in governance and security. | $168 per year per user | |
 Panorama Necto | N/A | Panorama Necto is a business intelligence solution that provides enterprises with new ways to collaborate and create unique contextual connections. Some key features include: Workboards/Dashboards, Advanced Analytics, and Contextual Discovery. | N/A |
| Microsoft Power BI | Panorama Necto | |||||||||||||||
|---|---|---|---|---|---|---|---|---|---|---|---|---|---|---|---|---|
| Editions & Modules |
| No answers on this topic | ||||||||||||||
| Offerings |
| |||||||||||||||
| Entry-level Setup Fee | No setup fee | No setup fee | ||||||||||||||
| Additional Details | Power BI Desktop is the data exploration and report authoring experience for Power BI, and is available as a free download. | — | ||||||||||||||
| More Pricing Information | ||||||||||||||||
| Microsoft Power BI | Panorama Necto |
|---|
| Microsoft Power BI | Panorama Necto | |||||||||||||||||||||
|---|---|---|---|---|---|---|---|---|---|---|---|---|---|---|---|---|---|---|---|---|---|---|
| BI Standard Reporting |
| |||||||||||||||||||||
| Ad-hoc Reporting |
| |||||||||||||||||||||
| Report Output and Scheduling |
| |||||||||||||||||||||
| Data Discovery and Visualization |
| |||||||||||||||||||||
| Access Control and Security |
| |||||||||||||||||||||
| Mobile Capabilities |
| |||||||||||||||||||||
| Application Program Interfaces (APIs) / Embedding |
|
| Microsoft Power BI | Panorama Necto | |
|---|---|---|
| Small Businesses |  Yellowfin Score 8.7 out of 10 | Yellowfin Score 8.7 out of 10 |
| Medium-sized Companies |  Reveal Score 10.0 out of 10 | Reveal Score 10.0 out of 10 |
| Enterprises |  Kyvos Semantic Layer Score 9.5 out of 10 | Kyvos Semantic Layer Score 9.5 out of 10 |
| All Alternatives | View all alternatives | View all alternatives |
| Microsoft Power BI | Panorama Necto | |
|---|---|---|
| Likelihood to Recommend | 8.5 (197 ratings) | 8.0 (25 ratings) |
| Likelihood to Renew | 9.5 (3 ratings) | 8.0 (17 ratings) |
| Usability | 8.3 (113 ratings) | 8.2 (2 ratings) |
| Support Rating | 10.0 (52 ratings) | 7.1 (3 ratings) |
| Implementation Rating | 9.0 (1 ratings) | 6.7 (2 ratings) |
| Microsoft Power BI | Panorama Necto | |
|---|---|---|
| Likelihood to Recommend | Microsoft
|  Panorama Software
 Chittiappa Areyada QA Lead & Test Analyst Disney Consumer Products for Satwic Inc |
| Pros | Microsoft
| Panorama Software
 Sarmista Nath Senior Sofware Engineer |
| Cons | Microsoft
| Panorama Software
 Soumya Roy Senior BI Analyst |
| Likelihood to Renew | Microsoft
 David Jensen Operations Manager, Customer Success | Panorama Software
 Lewis Ewing UI Designer |
| Usability | Microsoft
| Panorama Software
 Milos Milenkovic Senior Business Intelligence/Reporting Developer |
| Support Rating | Microsoft
| Panorama Software
 Hema Malini Senior Software Engineer |
| Implementation Rating | Microsoft
 Anuj Sant Senior buyer | Panorama Software
Milos Milenkovic Senior Business Intelligence/Reporting Developer |
| Alternatives Considered | Microsoft
| Panorama Software
 Nidhish Khare BI Developer |
| Return on Investment | Microsoft
| Panorama Software No answers on this topic |
| ScreenShots | Microsoft Power BI Screenshots      | Panorama Necto Screenshots 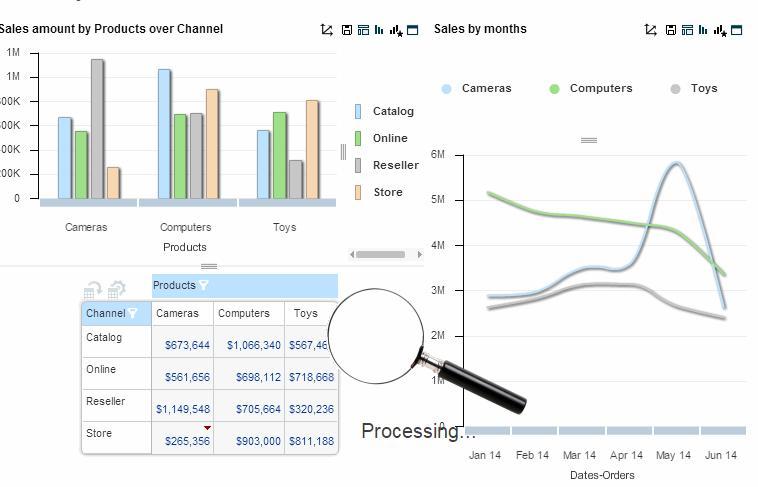 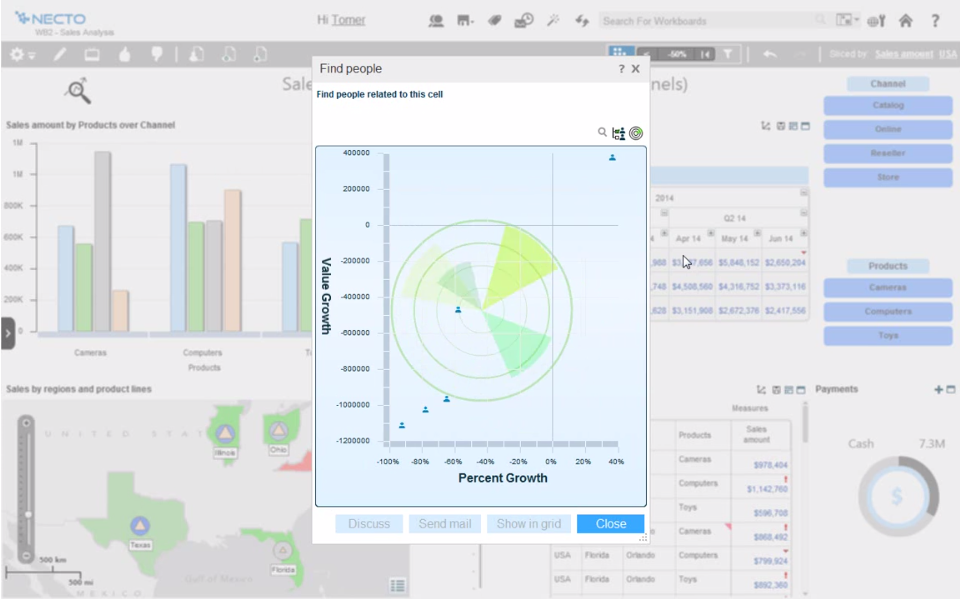   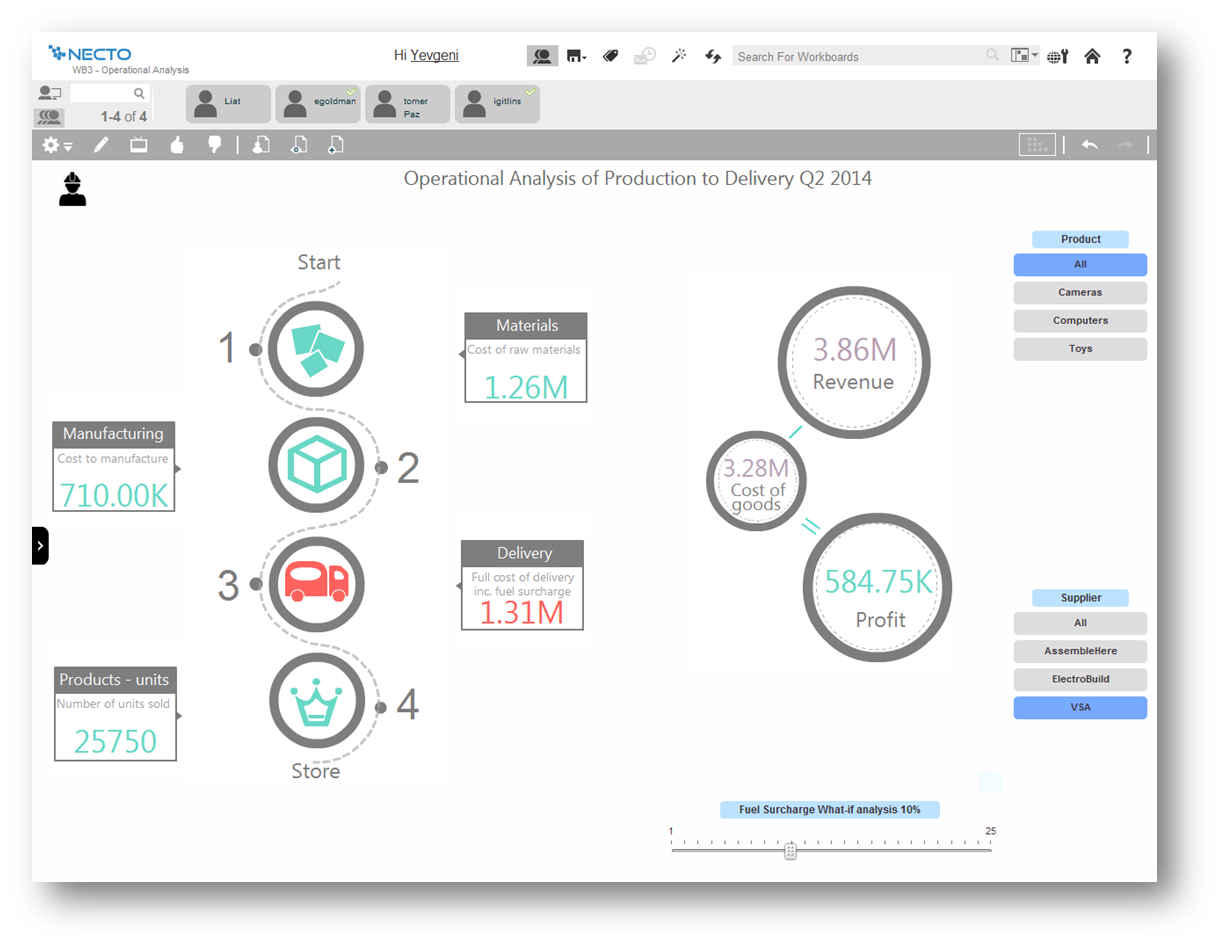 |