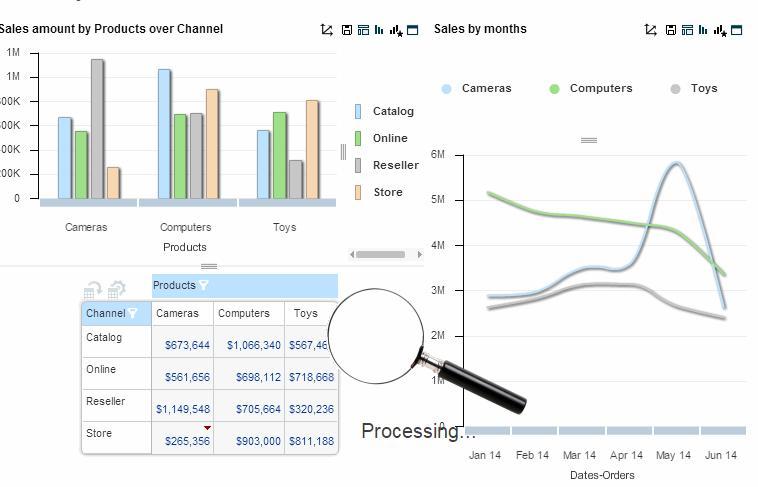
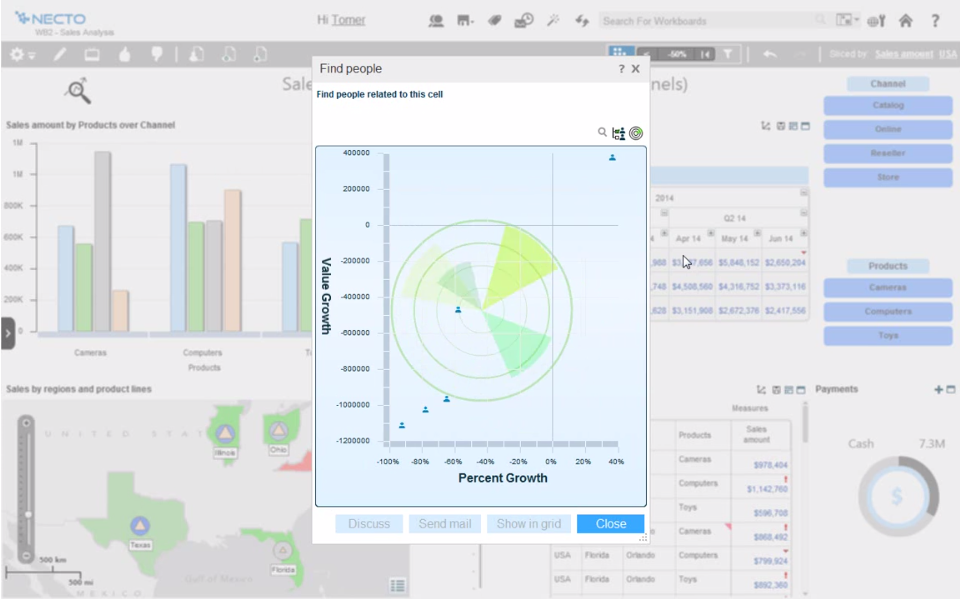
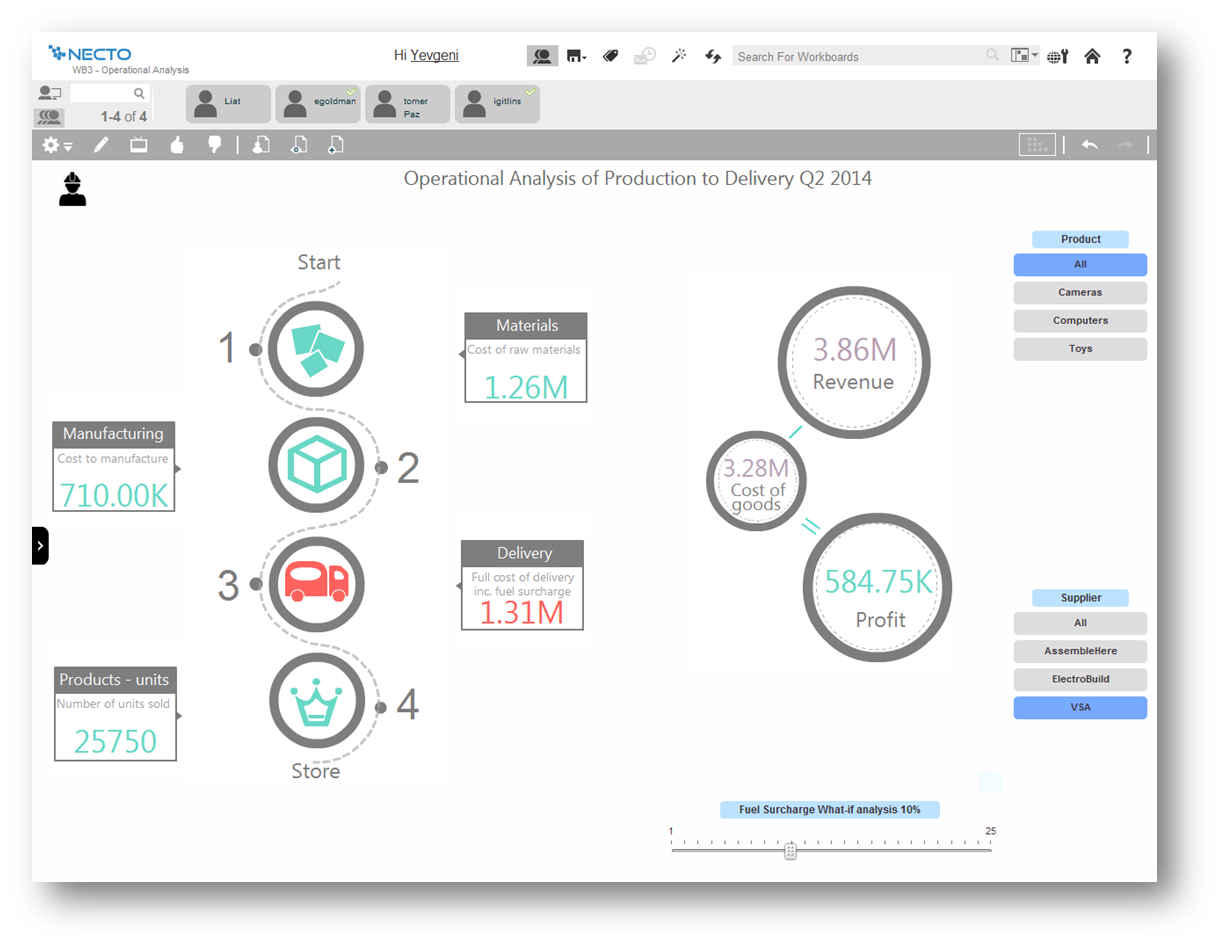
Panorama Necto is a business intelligence solution that provides enterprises with new ways to collaborate and create unique contextual connections. Some key features include: Workboards/Dashboards, Advanced Analytics, and Contextual Discovery.
N/A
Tableau Server
Score 7.7 out of 10
N/A
Tableau Server allows Tableau Desktop users to publish dashboards to a central server to be shared across their organizations. The product is designed to facilitate collaboration across the organization. It can be deployed on a server in the data center, or it can be deployed on a public cloud.
$12
Per User Per Month
Pricing
Panorama Necto
Tableau Server
Editions & Modules
No answers on this topic
Viewer
$12.00
Per User Per Month
Explorer
$35.00
Per User Per Month
Creator
$70.00
Per User Per Month
Offerings
Pricing Offerings
Panorama Necto
Tableau Server
Free Trial
Yes
Yes
Free/Freemium Version
No
No
Premium Consulting/Integration Services
Yes
Yes
Entry-level Setup Fee
No setup fee
No setup fee
Additional Details
—
—
More Pricing Information
Community Pulse
Panorama Necto
Tableau Server
Features
Panorama Necto
Tableau Server
BI Standard Reporting
Comparison of BI Standard Reporting features of Product A and Product B
Panorama Necto
7.3
24 Ratings
12% below category average
Tableau Server
8.4
95 Ratings
3% above category average
Pixel Perfect reports
6.022 Ratings
9.129 Ratings
Customizable dashboards
8.024 Ratings
7.094 Ratings
Report Formatting Templates
8.024 Ratings
9.081 Ratings
Ad-hoc Reporting
Comparison of Ad-hoc Reporting features of Product A and Product B
Panorama Necto
8.0
24 Ratings
0% below category average
Tableau Server
7.8
95 Ratings
3% below category average
Drill-down analysis
9.023 Ratings
8.095 Ratings
Formatting capabilities
7.024 Ratings
8.093 Ratings
Integration with R or other statistical packages
8.017 Ratings
8.059 Ratings
Report sharing and collaboration
8.022 Ratings
7.089 Ratings
Report Output and Scheduling
Comparison of Report Output and Scheduling features of Product A and Product B
Panorama Necto
7.2
22 Ratings
13% below category average
Tableau Server
7.2
91 Ratings
13% below category average
Publish to Web
7.821 Ratings
8.085 Ratings
Publish to PDF
6.722 Ratings
7.084 Ratings
Report Versioning
7.116 Ratings
8.070 Ratings
Report Delivery Scheduling
7.021 Ratings
8.077 Ratings
Delivery to Remote Servers
00 Ratings
5.19 Ratings
Data Discovery and Visualization
Comparison of Data Discovery and Visualization features of Product A and Product B
Panorama Necto 14 is well suited where BI is built to support social collaboration so that its analytics features can be shared to improve decision making by incorporating various organizational input. Additionally it supports an infographic display for information review which is unlike most of its competitors.
Whole funnel and specific channel performance from upper to lower funnel metrics. The ability to view full channel performance for some time, such as weekly, monthly, or quarterly, has truly been monumental in how my team optimizes specific channels and campaigns. Daily performance tracking is a bit overwhelming, with load times and having to refresh specific live views over time. It can be challenging to do so at times, as extensive dashboards take much longer to load.
Comes with lot of option to modify and build the smart infographic. Uses innovative pictures and charts to create the dashboards
Helps you identify why you are succeeding and where you should shift your focus to.
The maps are amazing and they just don’t act as control points rather you can populate various measures on them making it really efficient to understand the business in geographical info graph
It's good at doing what it is designed for: accessing visualizations without having to download and open a workbook in Tableau Desktop. The latter would be a very inefficient method for sharing our metrics, so I am glad that we have Tableau Server to serve this function.
Publishing to Tableau Server is quick and easy. Just a few clicks from Tableau Desktop and a few seconds of publishing through an average speed network, and the new visualizations are live!
Seeing details on who has viewed the visualization and when. This is something particularly useful to me for trying to drive adoption of some new pages, so I really appreciate the granularity provided in Tableau Server
This tool is relatively new to the current competitive BI market. Many organizations or business analyst are not yet aware of it's eye catching features.
Need more enhancement for predictive analysis.
Publishing reports as email attachment and mail server configuration is a little complicated process.
Tableau Server has had some issue handling some of our larger data sets. Our extract refreshes fail intermittently with no obvious error that we can fix
Tableau Server has been hard to work with before they launched their new Rest API, which is also a little tricky to work with
Some features are very basic and sometimes you can't add your own SQL query for custom reports. For Macs and Blackberry users this application is not helpful. Non-languages are not supported in info-graphics. They need to improve their forecast analysis. Report sharing is limited among the portal users only
It simply is used all the time by more and more people. Migrating to something else would involve lots of work and lots of training. The renewal fee being fair, it simply isn't worth migrating to a different tool for now.
It provides all the features that are required and some that are not the basic requirements, but they represent a great additional capabilities, not available within the similar products
Tableau Server takes training and experience in order to unlock the application's full potential. This is best handled by a qualified data scientist or data analytics manager. Tableau user interface layout, nomenclature, and command structure take time and training to become proficient with. Integration and connectivity require proper IT developer support.
Our instance of Tableau Server was hosted on premises (I believe all instances are) so if there were any outages it was normally due to scheduled maintenance on our end. If the Tableau server ever went down, a quick restart solved most issues
While there are definitely cases where a user can do things that will make a particular worksheet or dashboard run slowly, overall the performance is extremely fast. The user experience of exploratory analysis particularly shines, there's nothing out there with the polish of Tableau.
We have consistently had highly satisfactory results every time we've reached out for help. Our contractor, used for Tableau server maintenance and dashboard development is very technically skilled. When he hits a roadblock on how to do something with Tableau, the support staff have provided timely and useful guidance. He frequently compares it to Cognos and says that while Cognos has capabilities Tableau doesn't, the bottom line value for us is a no-brainer
In our case, they hired a private third party consultant to train our dept. It was extremely boring and felt like it dragged on. Everything I learned was self taught so I was not really paying attention. But I do think that you can easily spend a week on the tool and go over every nook and cranny. We only had the consultant in for a day or two.
The Tableau website is full of videos that you can follow at your own pace. As a very small company with a Tableau install, access to these free resources was incredibly useful to allowing me to implement Tableau to its potential in a reasonable and proportionate manner.
Implementation was over the phone with the vendor, and did not go particularly well. Again, think this was our fault as our integration and IT oversight was poor, and we made errors. Would they have happened had a vendor been onsite? Not sure, probably not, but we probably wouldn't have paid for that either
This is the next generation BI tool, which will be very helpful for small and medium businesses to kick start data exploration and visualization of their diverse databases, with less intervention from IT. This tool is more end user centric and gives way more power to the end user to perform data analysis
Today, if my shop is largely Microsoft-centric, I would be hard pressed to choose a product other than Power BI. Tableau was the visualization leader for years, but Microsoft has caught up with them in many areas, and surpassed them in some. Its ability to source, transform, and model data is superior to Tableau. Tableau still has the lead in some visualizations, but Power BI's rise is evidenced by its ever-increasing position in the leadership section of the Gartner Magic Quadrant.
Tableau does take dedicated FTE to create and analyze the data. It's too complex (and powerful) a product not to have someone dedicated to developing with it.
There are some significant setup for the server product.
Once sever setup is complete, it's largely "fire and forget" until an update is necessary. The server update process is cumbersome.