TrustRadius: an HG Insights company

Predicte.com vs. Qualtrics XM for Strategy and Research

Save this comparison

Save this comparison

Add Product

Recommended Comparisons

    Overview
    ProductRatingMost Used ByProduct SummaryStarting Price

    Predicte.com

    N/A
    Small Businesses (1-50 employees)
    Predicte offers real-time predicive insights from product, sales, and client data. By unifying disparate data sources within its Data Platform (Analytics), Predicte empowers distributors, wholesalers and manufacturers to forecast sales with greater accuracy, detect churn risks before they escalate, and deliver tailored recommendations. The platform’s analytics framework helps teams optimize product usage, enhance sales performance, and continuously improve client outcomes through its…N/A

    Qualtrics

    Score7.8 out of 10
    N/AQualtrics is software for advanced quantitative and qualitative research to design products that satisfy customers, increase market share, and build enduring brands. The platform brings sophisticated quant and qual research together with analytics in a single platform.

    $1,500

    per user/per year

    Pricing
    Predicte.comQualtrics
    Editions & Modules
    No answers on this topic
    Research Core 1
    1,500
    per user/per year
    Offerings
    Pricing Offerings
    Predicte.comQualtrics
    Free Trial
    NoYes
    Free/Freemium Version
    NoYes
    Premium Consulting/Integration Services
    NoYes
    Entry-level Setup FeeRequiredOptional
    Additional Details——
    More Pricing Information
    Community Pulse
    Predicte.comQualtrics
    Considered Both Products
    Predicte.com
    No answer on this topic
    Qualtrics
    No answer on this topic
    Key User Insights
    Would buy again
    No answers on this topic
    64%
    Would buy again
    9 Answers
    Delivers good value for the price
    No answers on this topic
    80%
    Delivers good value for the price
    8 Answers
    Happy with the feature set
    No answers on this topic
    71%
    Happy with the feature set
    10 Answers
    Lived up to sales and marketing promises
    No answers on this topic
    88%
    Lived up to sales and marketing promises
    7 Answers
    Implementation went as expected
    No answers on this topic
    56%
    Implementation went as expected
    5 Answers
    Features
    Predicte.comQualtrics
    Sales Intelligence Data Standards
    Comparison of Sales Intelligence Data Standards features of Predicte.com and Qualtrics XM for Strategy and Research
    Feature
    Predicte.com
    -
    Ratings
    Qualtrics XM for Strategy and Research
    6.0
    1 Ratings
    0% above category average
    Contact information00 Ratings6.01 Ratings
    Financial Research
    Comparison of Financial Research features of Predicte.com and Qualtrics XM for Strategy and Research
    Feature
    Predicte.com
    -
    Ratings
    Qualtrics XM for Strategy and Research
    6.3
    2 Ratings
    14% below category average
    Private Company Data00 Ratings8.01 Ratings
    Industry-Specific Information00 Ratings6.01 Ratings
    Independent Research Access00 Ratings6.01 Ratings
    Search Tools00 Ratings5.02 Ratings
    Market Research
    Comparison of Market Research features of Predicte.com and Qualtrics XM for Strategy and Research
    Feature
    Predicte.com
    -
    Ratings
    Qualtrics XM for Strategy and Research
    6.6
    4 Ratings
    6% below category average
    Competitor Research00 Ratings7.03 Ratings
    Consumer Feedback00 Ratings8.25 Ratings
    Competitor alerts00 Ratings5.02 Ratings
    Market Insights and Reports00 Ratings6.03 Ratings
    User Ratings
    Predicte.comQualtrics
    Likelihood to Recommend
    -
    (0 ratings)
    7.0
    (174 ratings)
    Likelihood to Renew
    -
    (0 ratings)
    9.4
    (41 ratings)
    Usability
    -
    (0 ratings)
    6.4
    (25 ratings)
    Availability
    -
    (0 ratings)
    9.0
    (1 ratings)
    Performance
    -
    (0 ratings)
    5.5
    (1 ratings)
    Support Rating
    -
    (0 ratings)
    1.6
    (21 ratings)
    Online Training
    -
    (0 ratings)
    8.0
    (2 ratings)
    Implementation Rating
    -
    (0 ratings)
    9.0
    (1 ratings)
    User Testimonials
    Predicte.comQualtrics
    Likelihood to Recommend
    Predicte.com
    No answers on this topic
    Qualtrics
    Qualtrics is a good medium for creating surveys and getting analytics back for it. I think it's easy to learn if you are in the business of creating surveys or if it's part of your studies. It can be a little overwhelming for a brand new user who has never created a survey for the first time. So onboarding could be better.
    Read full review
    Pros
    Predicte.com
    No answers on this topic
    Qualtrics
    • Qualtrics CoreXM is easy to use for quick one-time surveys or for measuring opinions over time
    • It's great for sending/managing RSVPs for meetings or other gatherings or to collect important data like Conflict of Interest declarations.
    • Qualtrics CoreXM's reporting and crosstab functionality is beefy and gets better all of the time. I'm always amazed at how easy it is to generate reports for sharing my survey response data and research.
    Incentivized
    Read full review
    Cons
    Predicte.com
    No answers on this topic
    Qualtrics
    • The collaborate feature can be clunky and sometimes we have to remove access and add a person back in for them to see the survey in their lists
    • We have a contract through our university and more than one person has created their account in the wrong place, causing some administrative headaches as that is fixed so that we can collaborate on surveys with them.
    • I wish it was easier to organize my surveys into folders, there should be a more efficient way to do that.
    Incentivized
    Read full review
    Likelihood to Renew
    Predicte.com
    No answers on this topic
    Qualtrics
    I was impressed a couple years ago when two heads of market research at Fortune 500 companies told me about them, and I've been even more impressed with the advancements I've seen in the last year. I like where the company is headed, and I look forward to using them again in a future role.
    Read full review
    Usability
    Predicte.com
    No answers on this topic
    Qualtrics
    All the menus are very user friendly and intuitive. I can always find exactly what I'm looking for and can change anything I need to with ease. All the elements of the survey are adjustable with very little effort and without confusion.
    Read full review
    Support Rating
    Predicte.com
    No answers on this topic
    Qualtrics
    Whenever we have had an issue with trying to figure out how to do something (even though the documentation is incredibly well put together) we have asked Qualtrics support and have always received our answer nearly immediately (I think in maybe 10 times, only once did a support person need to call us back). Qualtrics support is dedicated to solving customer issues right, and in the first contact, if at all possible
    Read full review
    Online Training
    Predicte.com
    No answers on this topic
    Qualtrics
    I still use it. It does everything you need an online survey to do. From heat mapping to complex skip logic and display logic. I use it weekly and it never disappoints
    Read full review
    Implementation Rating
    Predicte.com
    No answers on this topic
    Qualtrics
    I like being able to easily integrate new colleagues by simply giving them a log in user name and password
    Read full review
    Alternatives Considered
    Predicte.com
    No answers on this topic
    Qualtrics
    ]Qualtrics] CoreXM is great if you want something that is a little more [long] lasting and impactful than a simple survey engine, but aren't quite ready for something that is a long term sustainable program. I would put [Qualtrics] CoreXM squarely in the large, defined project phase. CX is more of the program phase, and other lessor vendors are great for the pre-project definition phase
    Incentivized
    Read full review
    Return on Investment
    Predicte.com
    No answers on this topic
    Qualtrics
    • Increased productivity due to the highly intuitive user-interface and template saving capabilities.
    • Reporting and analytics are extremely valuable. Our team can track responses and share feedback/results extremely quickly.
    • If a user has created a great template, they can share to external teams quite easily. It helps other departments!
    Incentivized
    Read full review
    ScreenShots

    Predicte.com Screenshots

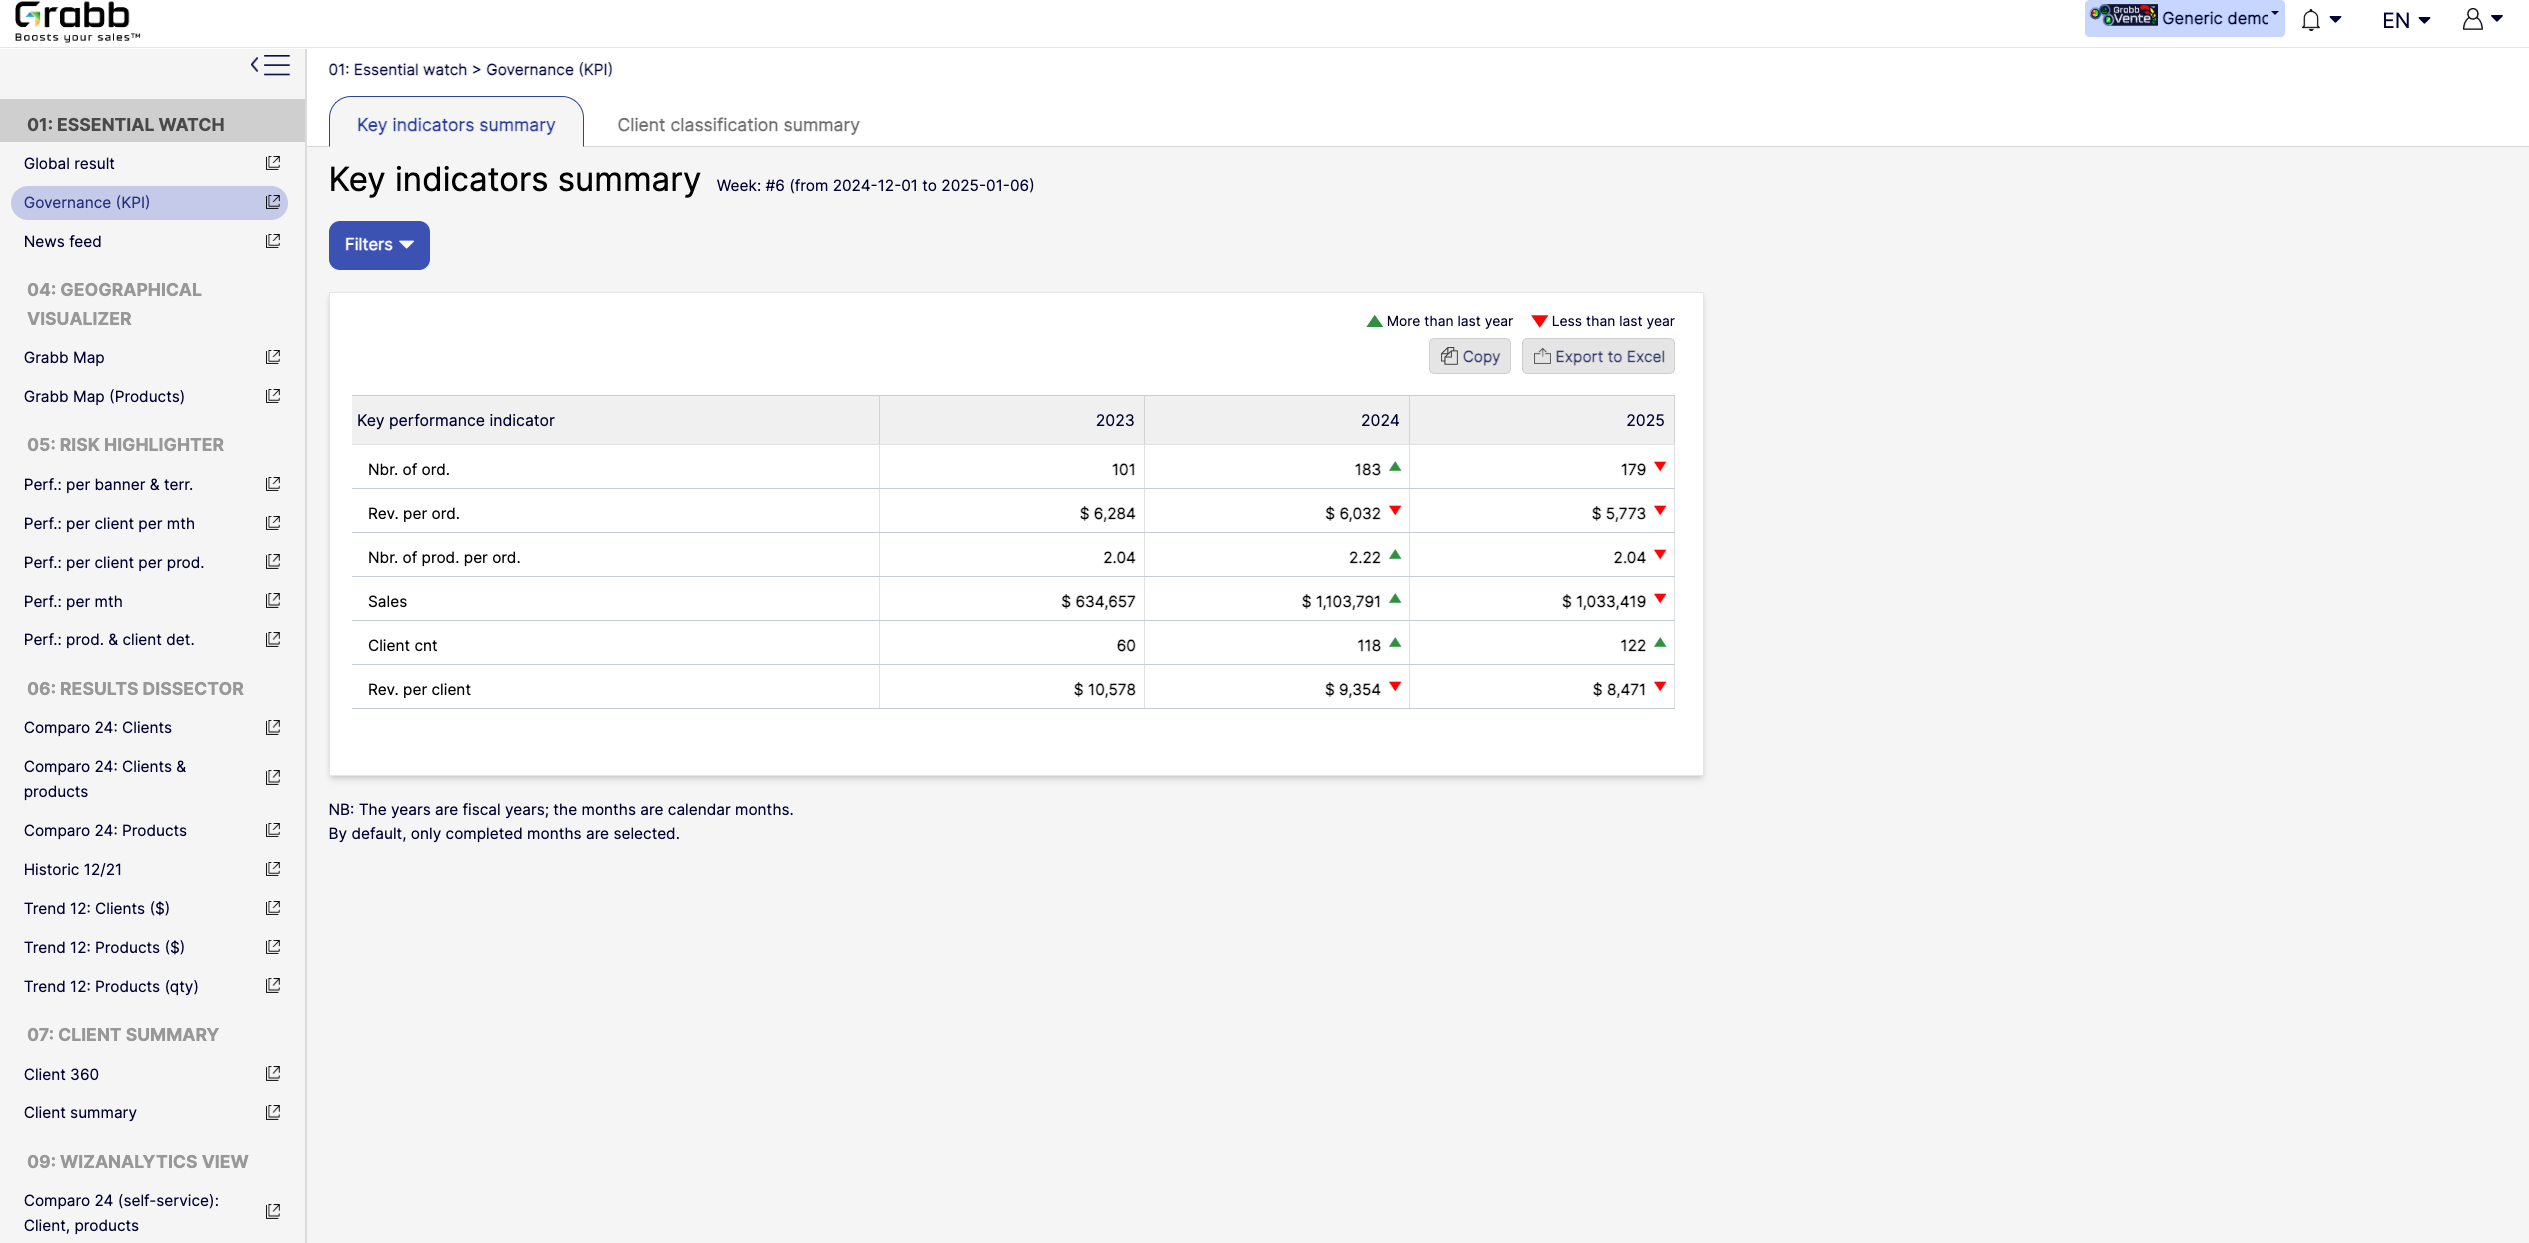
    Screenshot of the dashboard for executives and managers, with various performance metrics:

High‐Level KPIs: Summarizes top metrics (e.g., total sales, revenue per client, average products per order) all in one table, making it easier to spot whether the company is trending up or down.
Year‐to‐Year Comparison: Displays data for each fiscal year, with green/red arrows to show improvement or decline since the previous year.
Immediate Visibility of Trends: Simplifies strategic decision‐making by illustrating whether overall performance is improving or if corrective measures are needed.
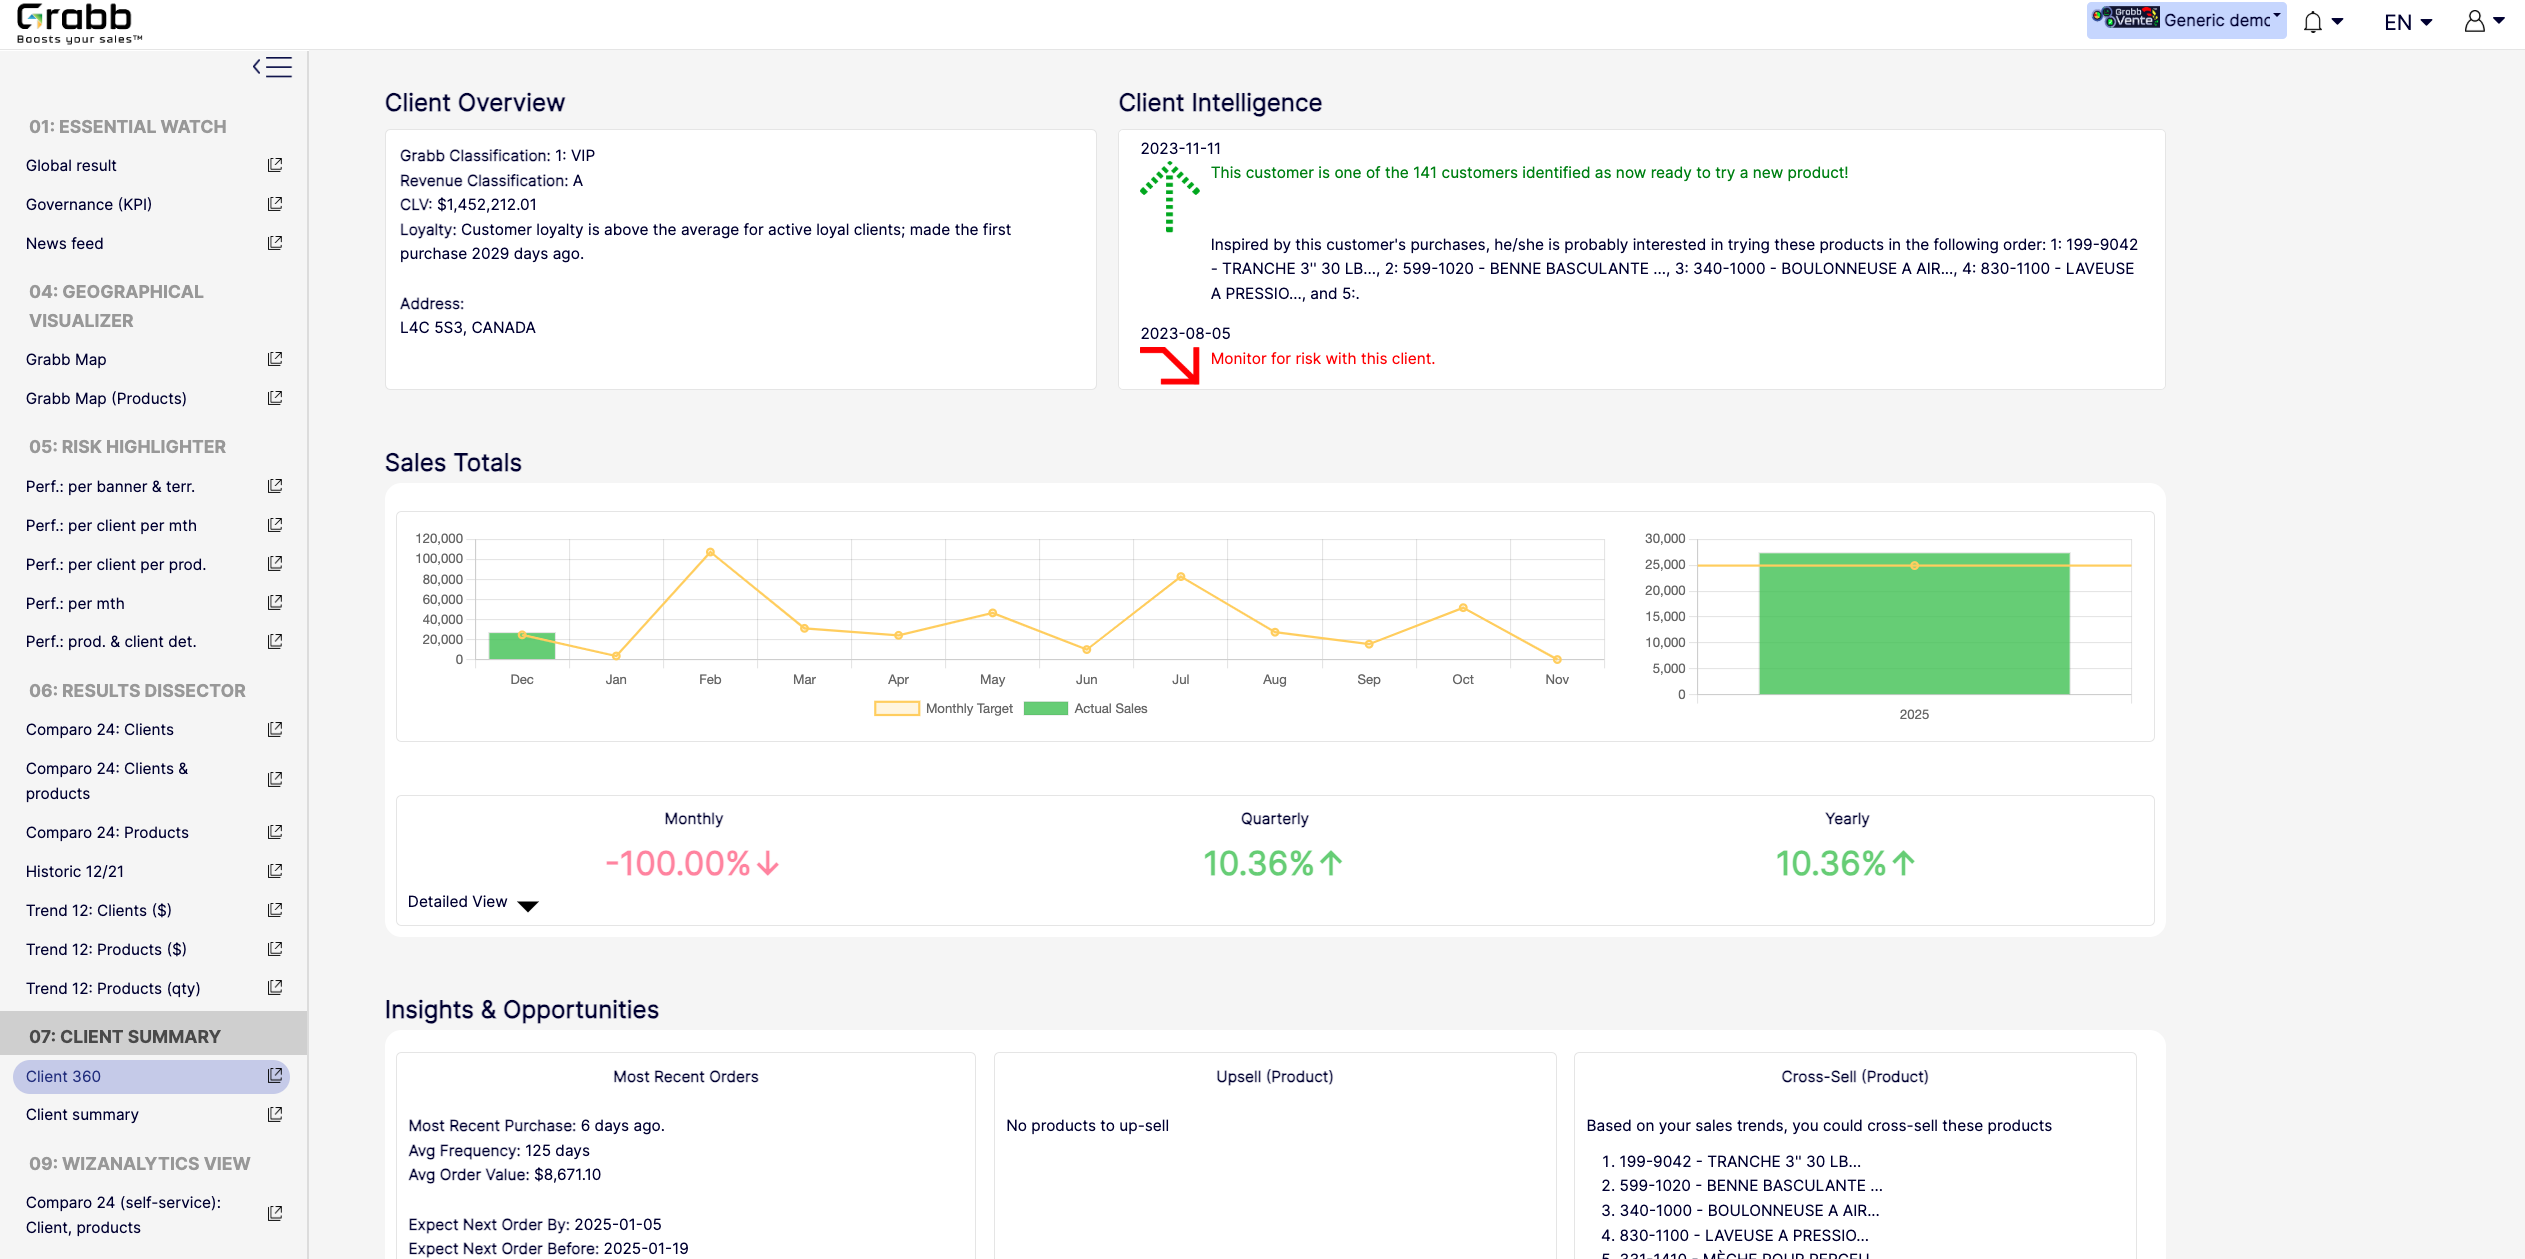
It’s a quick, executive‐friendly scoreboard of the organization’s health, ensuring leaders have the clarity to plan next steps.Screenshot of an at‐a‐glance understanding of a single client’s status, loyalty level, buying behavior, and next best actions that includes data about up‐selling, cross‐selling, and churn risk is often siloed or not immediately visible. This provides:

A Centralized Client Snapshot: Shows the client’s classification (e.g., VIP), revenue category, and CLV, ensuring everyone quickly sees the client’s overall value.
Predictive Intelligence: Highlights whether the client is “ready to try a new product,” or if there’s any “monitor for risk” alert, taking the guesswork out of deciding the next sales move.
Sales Trend & Graphs: Displays monthly, quarterly, and yearly sales to pinpoint performance patterns and quickly identify dips/spikes.
Upsell/Cross‐Sell Suggestions: Automatically suggests which products the client is most likely to buy next, helping reps act on potential revenue opportunities immediately.
Insights & Opportunities: Offers quick reference points such as “Most Recent Purchase,” average order value, frequency, and predicted next order date so you can plan proactive outreach.
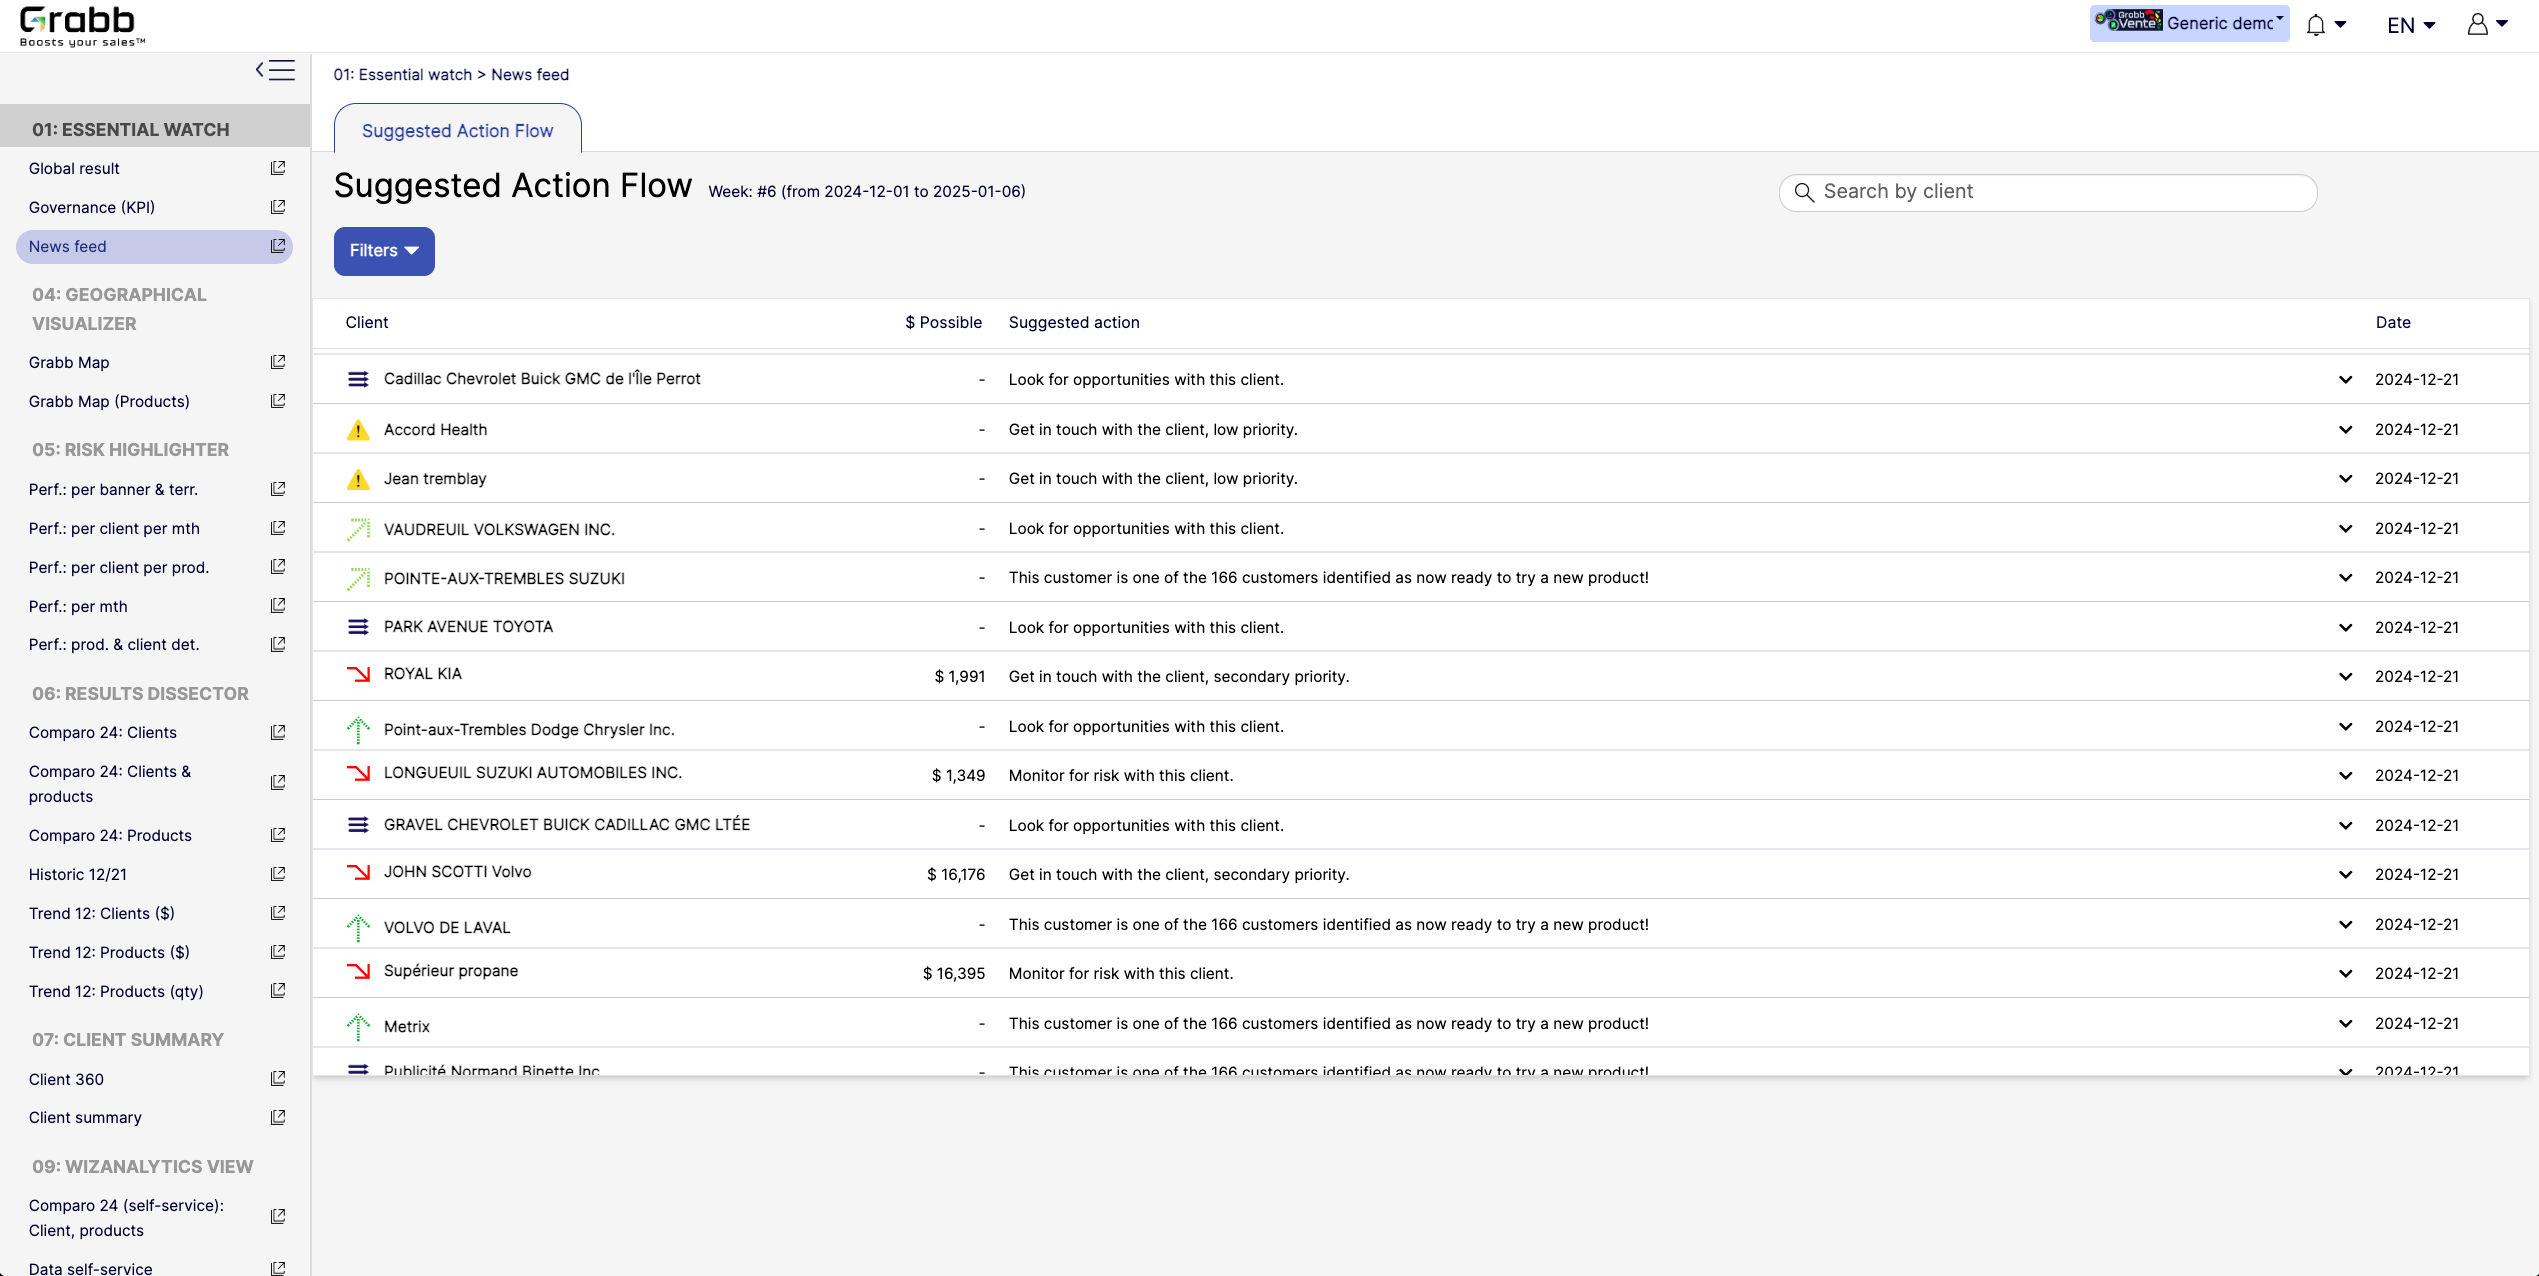
This holistic view enables data‐driven decisions—whether to focus on strengthening loyalty, pitching new products, or preventing churn.Screenshot of A visualization for sales reps and managers, providing:

Prioritized Recommandations: Provides a dynamic feed of next best actions—whether it’s “Look for opportunities with this client” or “Monitor for risk,” ensuring no lead or account slips through the cracks.
Opportunity & Risk Indicators: Quickly flags which clients are “ready to try a new product” versus those at higher risk, so teams can focus their energy where it matters most.
Estimated Upside ($ Possible): In some cases, the screen shows potential revenue if successful, helping reps evaluate the ROI of their outreach efforts.
Search & Filter Capabilities: Salespeople can easily locate a specific client in the list and see suggested actions, which speeds up daily planning and follow‐ups.
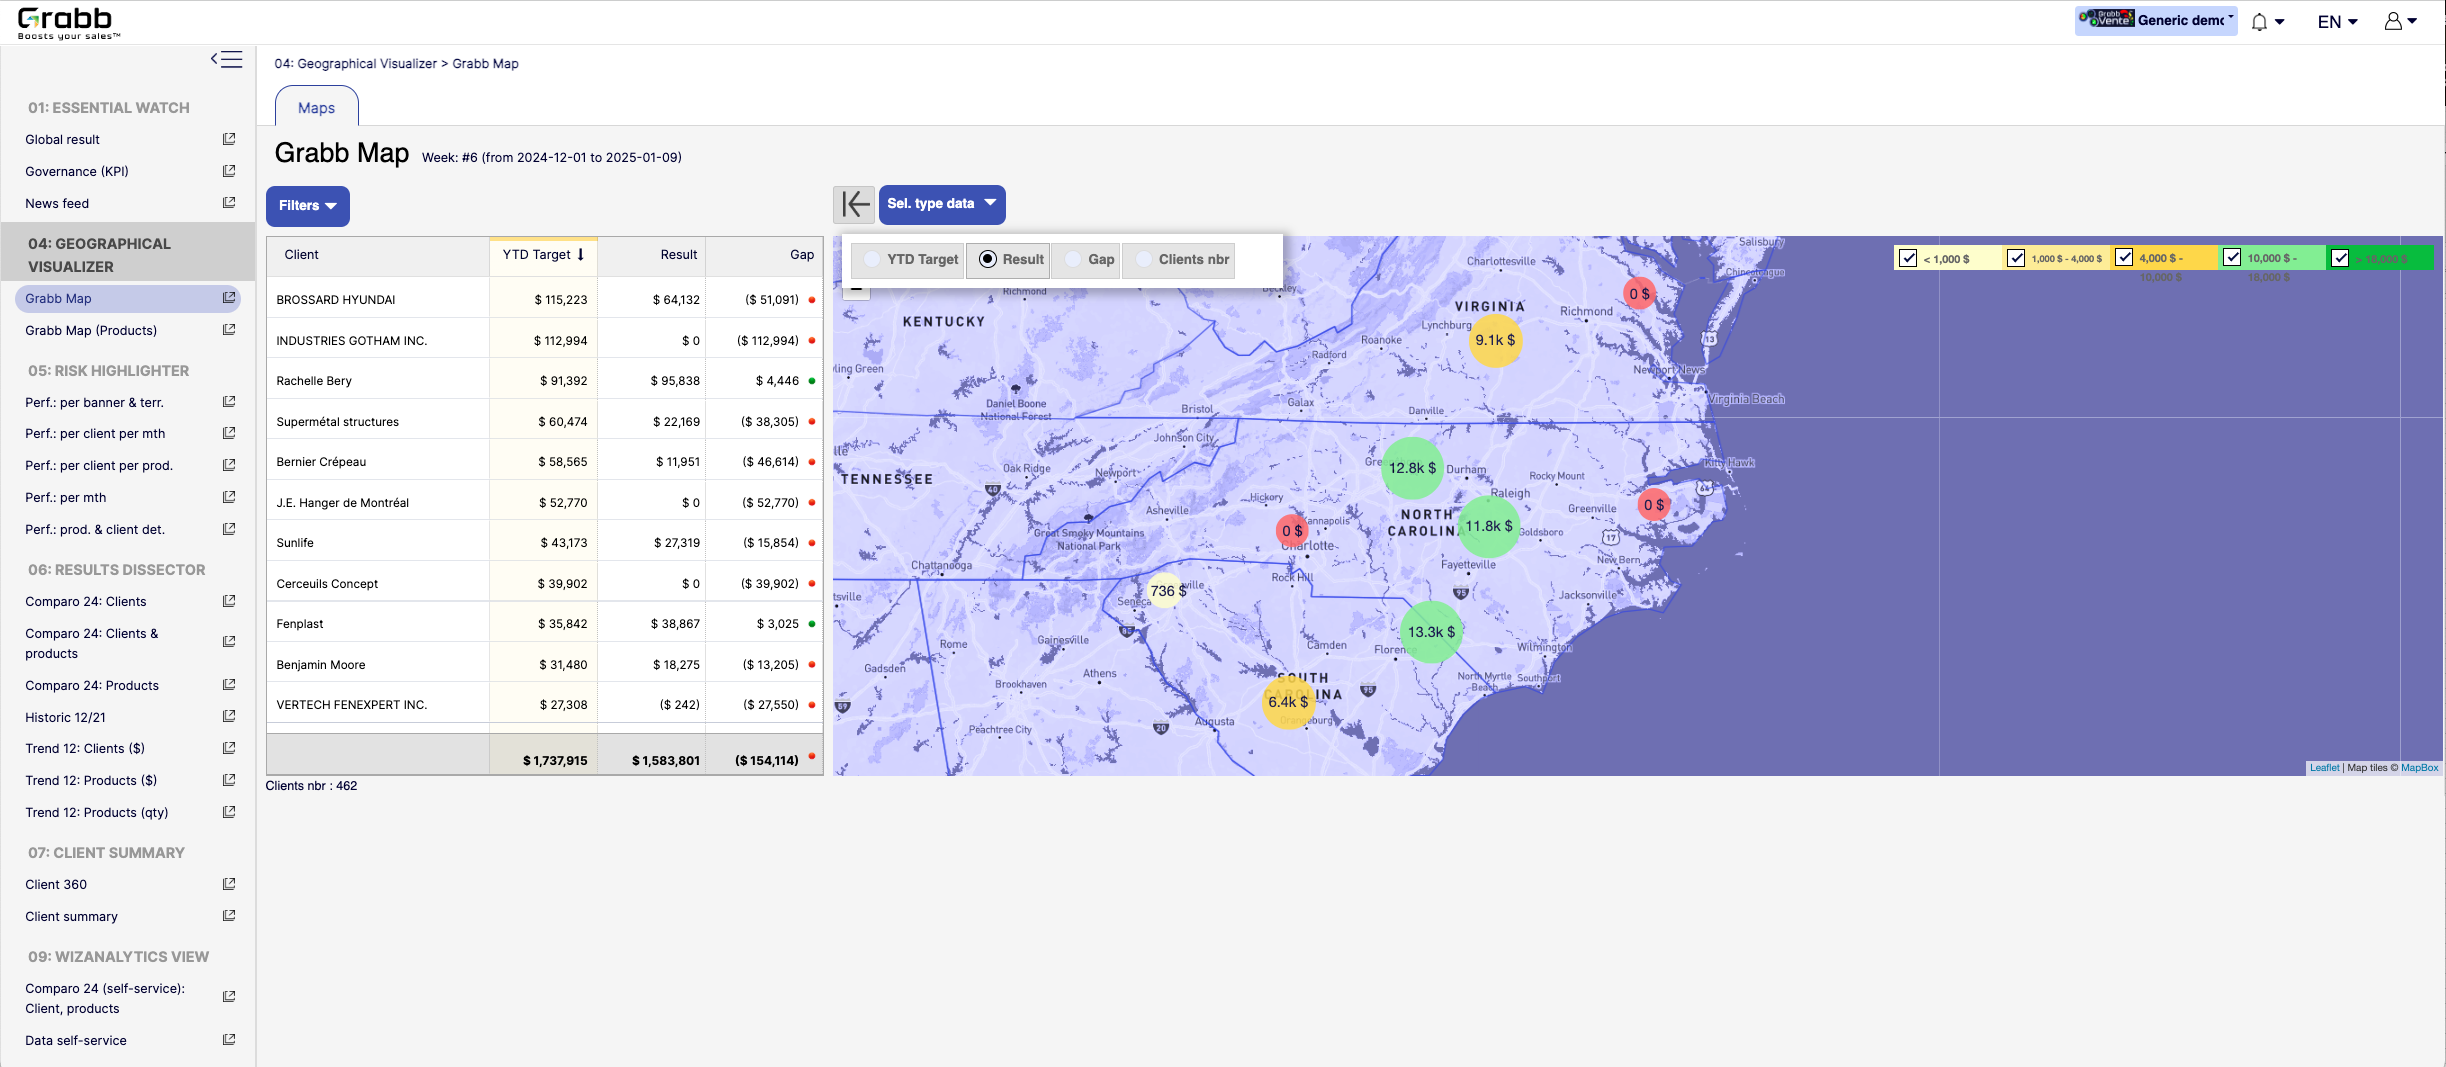
By centralizing these recommended “next steps,” the Suggested Action Flow turns raw data into a practical to‐do list—making each sales call or client interaction more purposeful and timely.Screenshot of a visualization for sales teams that helps them understand how their performance is distributed across different territories or locations. Without geographic context, managers can overlook local trends, regional opportunities, or problem areas.

Solution Provided:

Interactive Territory Overview: Displays each client’s Year‐to‐Date (YTD) target, actual results, and any gap in a color‐coded map, quickly revealing where the biggest mismatches lie.
Client‐Level Details: The list alongside the map allows you to see real‐time data—such as current gap amount or sales performance—sorted by region or client.
Visual Clustering: Bubbles on the map show consolidated sales amounts or gaps for clusters of clients, making it easier to spot hot‐spots or underperforming zones.
Target & Result Comparison: By toggling between metrics (e.g., “YTD Target,” “Result,” “Gap,” “Clients nbr”), managers can instantly pivot the view to see how the team is tracking.
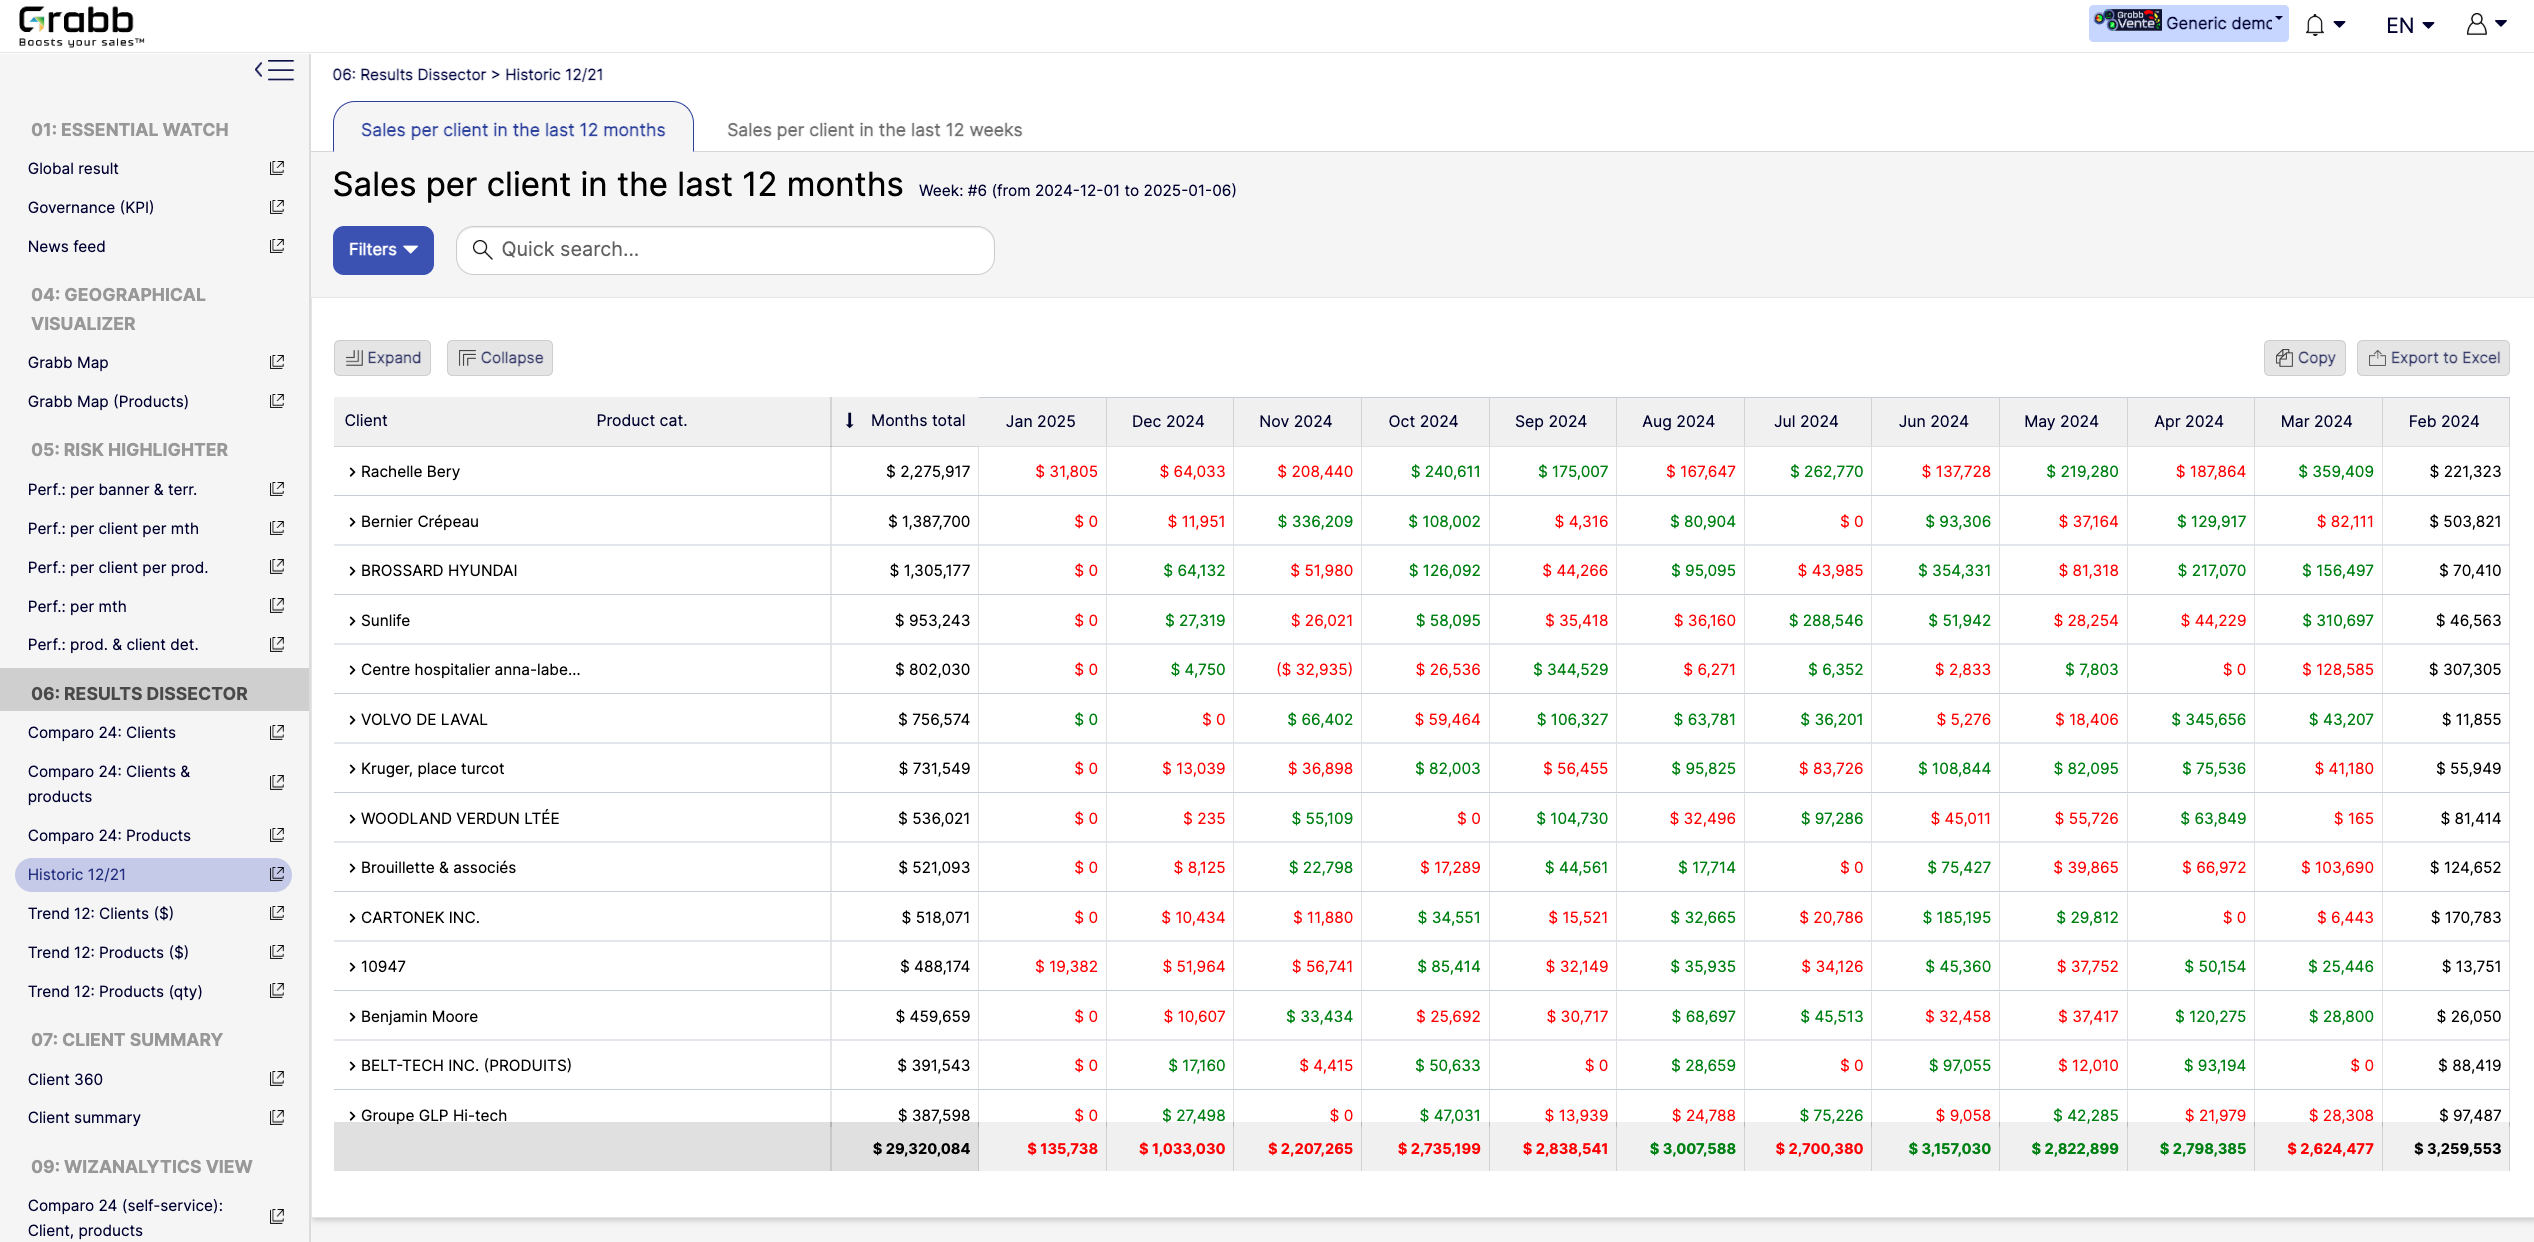
With this map‐based dashboard, leaders can optimize travel routes, allocate resources effectively, and prioritize outreach in areas where the potential impact is greatest.Screenshot of monthly sales trends at the individual‐client level. The visualization provides:

Month‐by‐Month Breakdown: Lists each client with color‐coded monthly sales (green and red), allowing you to see exactly when sales surge or drop off.
Total and Monthly Views: A “Months total” column plus each month’s figure helps you quickly gauge each client’s cumulative performance versus their monthly fluctuations.
Trend Spotting & Seasonality: By laying out 12 consecutive months, it becomes easier to see recurring patterns—helpful for forecasting, inventory planning, and targeted campaigns.
Actionable Insights: Identify which clients need re‐engagement (red cells or big drops) and which clients might be ready for expansion (consistently green or strong increases).
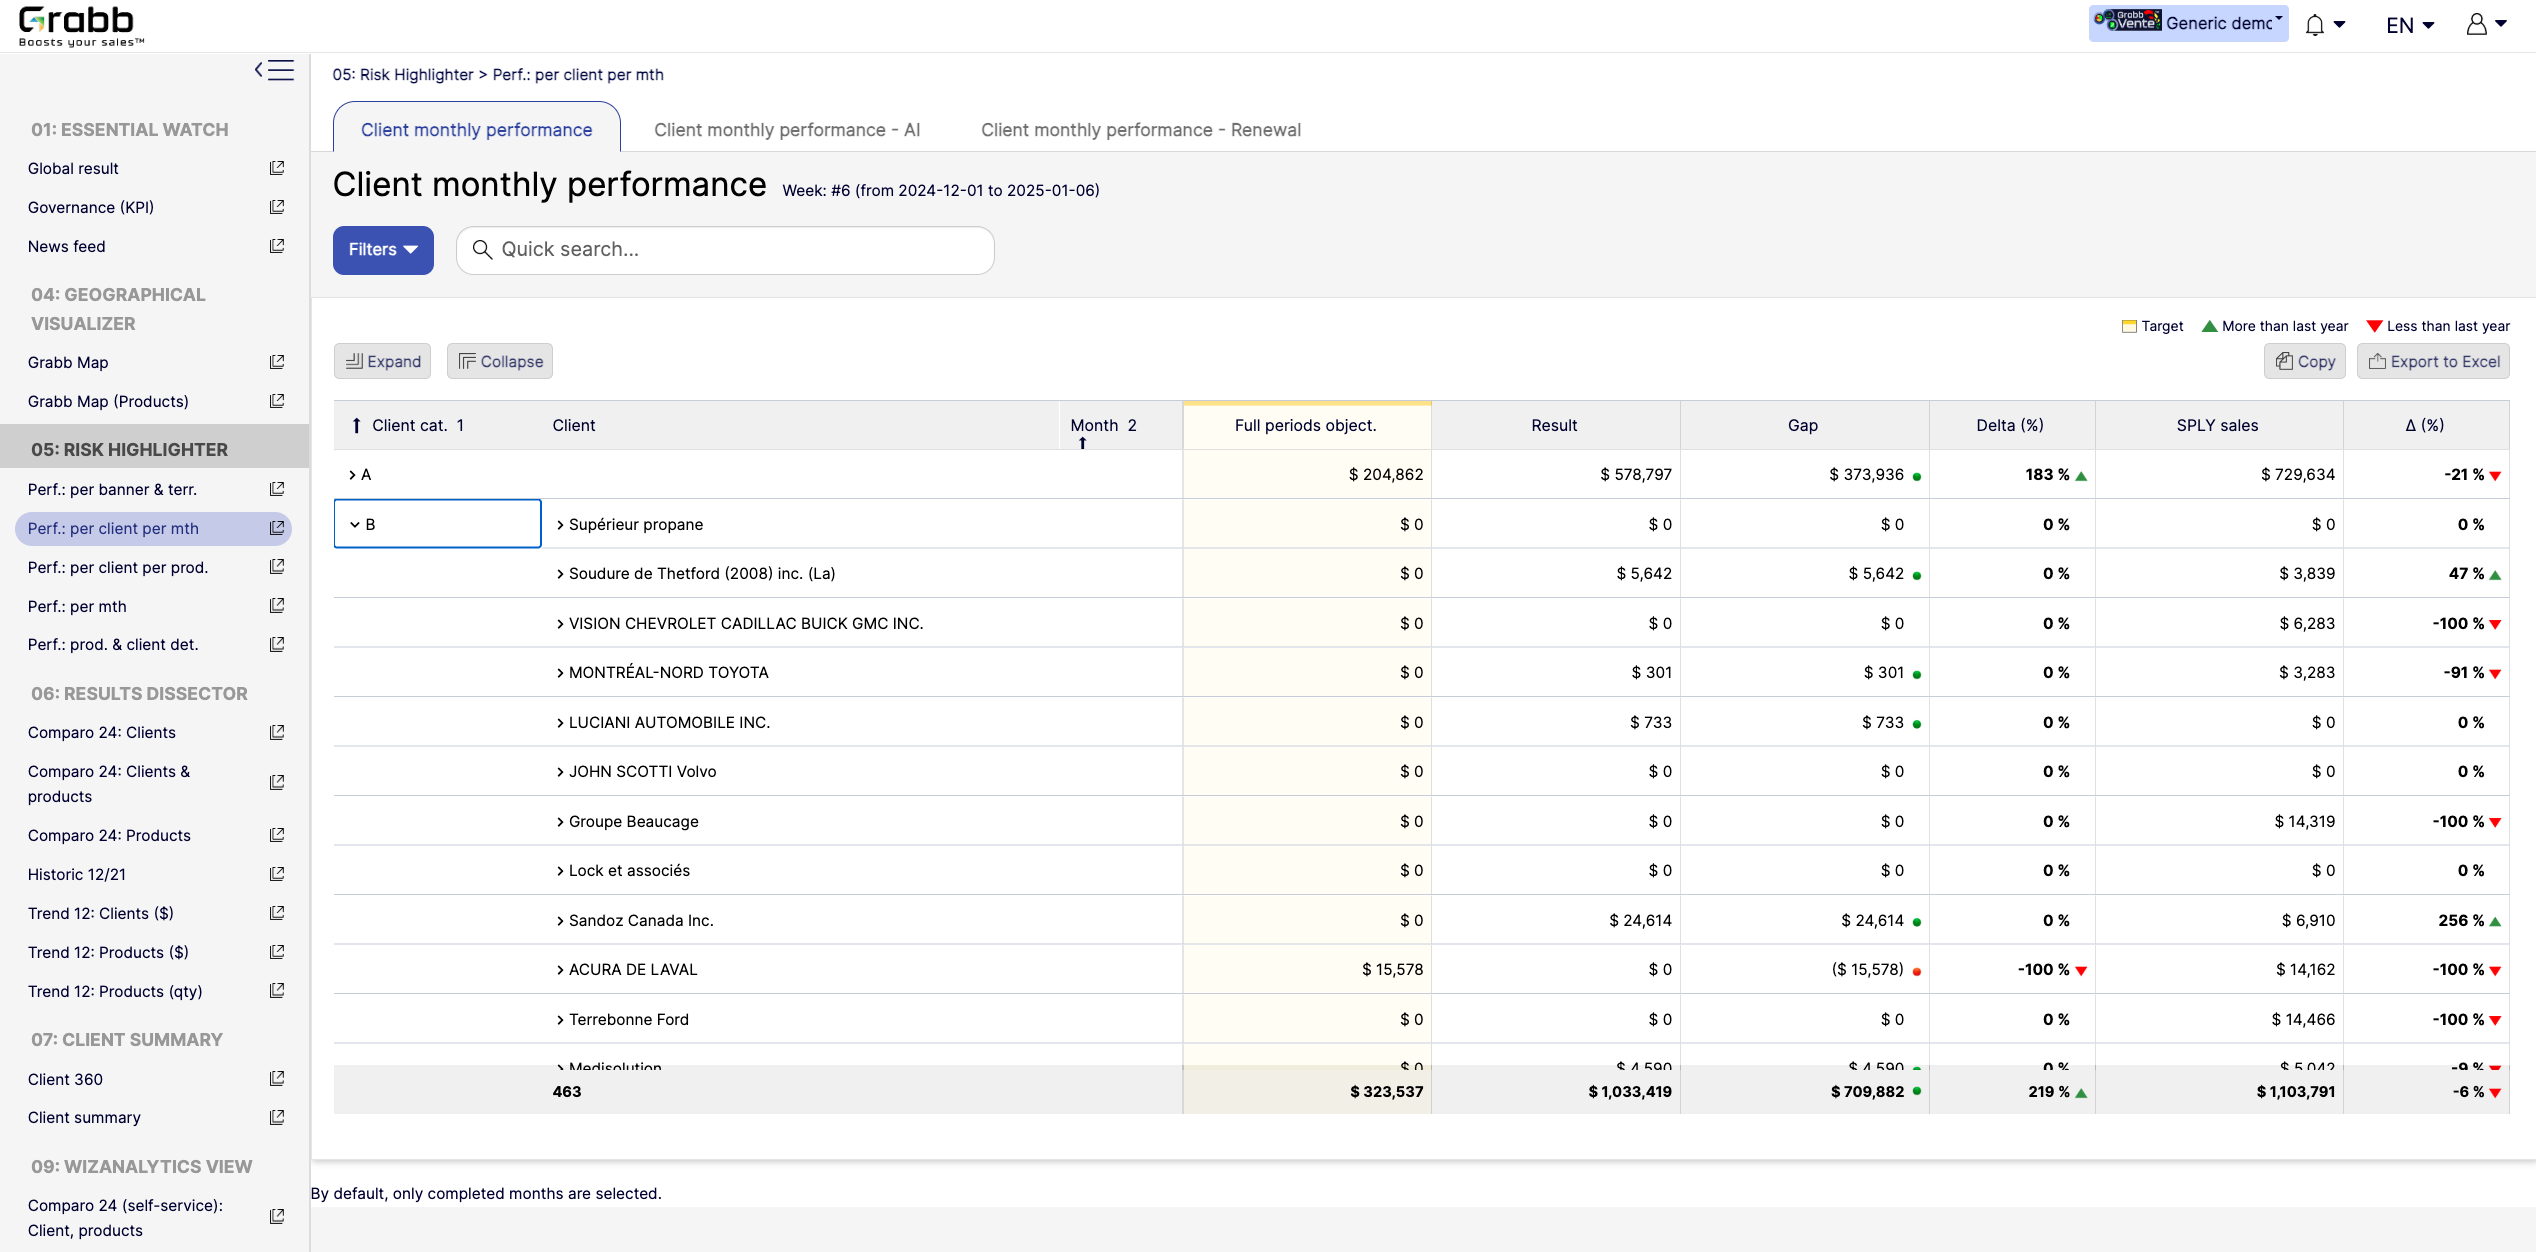
By visualizing an entire year in detail, sales teams can preemptively address potential downturns and capitalize on positive trends.Screenshot of a visualization tracking how each client performs on a month‐to‐month basis, and across accounts. This information provides:

Side‐by‐Side Comparisons: Displays each client’s monthly objectives versus actual results, so sales teams see immediately whether targets are met or missed.
Delta & Gap Analysis: Automatically calculates the variance between the goal and real outcomes—highlighting where shortfalls or over‐performance exist.
Year‐Over‐Year Comparison: “More than last year” or “Less than last year” labels provide quick trend context, guiding strategy for retention or growth.
Easy Filtering & Sorting: Users can filter by client category or name, then expand or collapse details to focus only on accounts that need attention.
With this screen, managers can prioritize which clients need immediate support and which are on track—using precise data rather than guesswork.

    Qualtrics Screenshots

    Product screenshot