Review of Budgyt

Use Cases and Deployment Scope
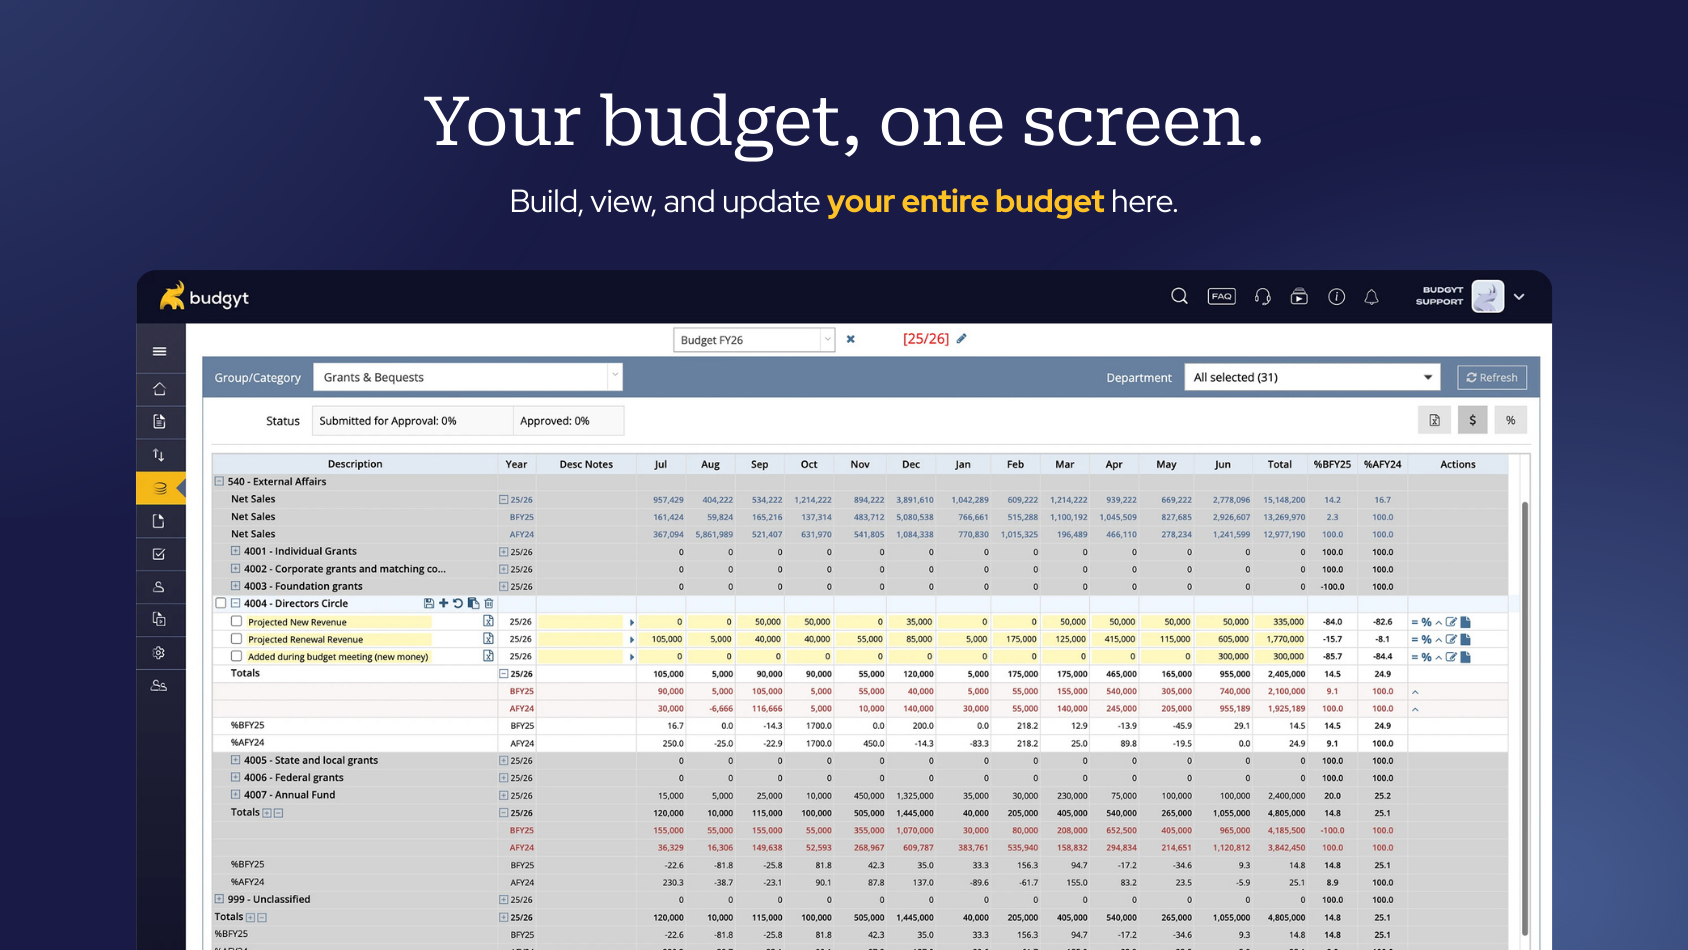
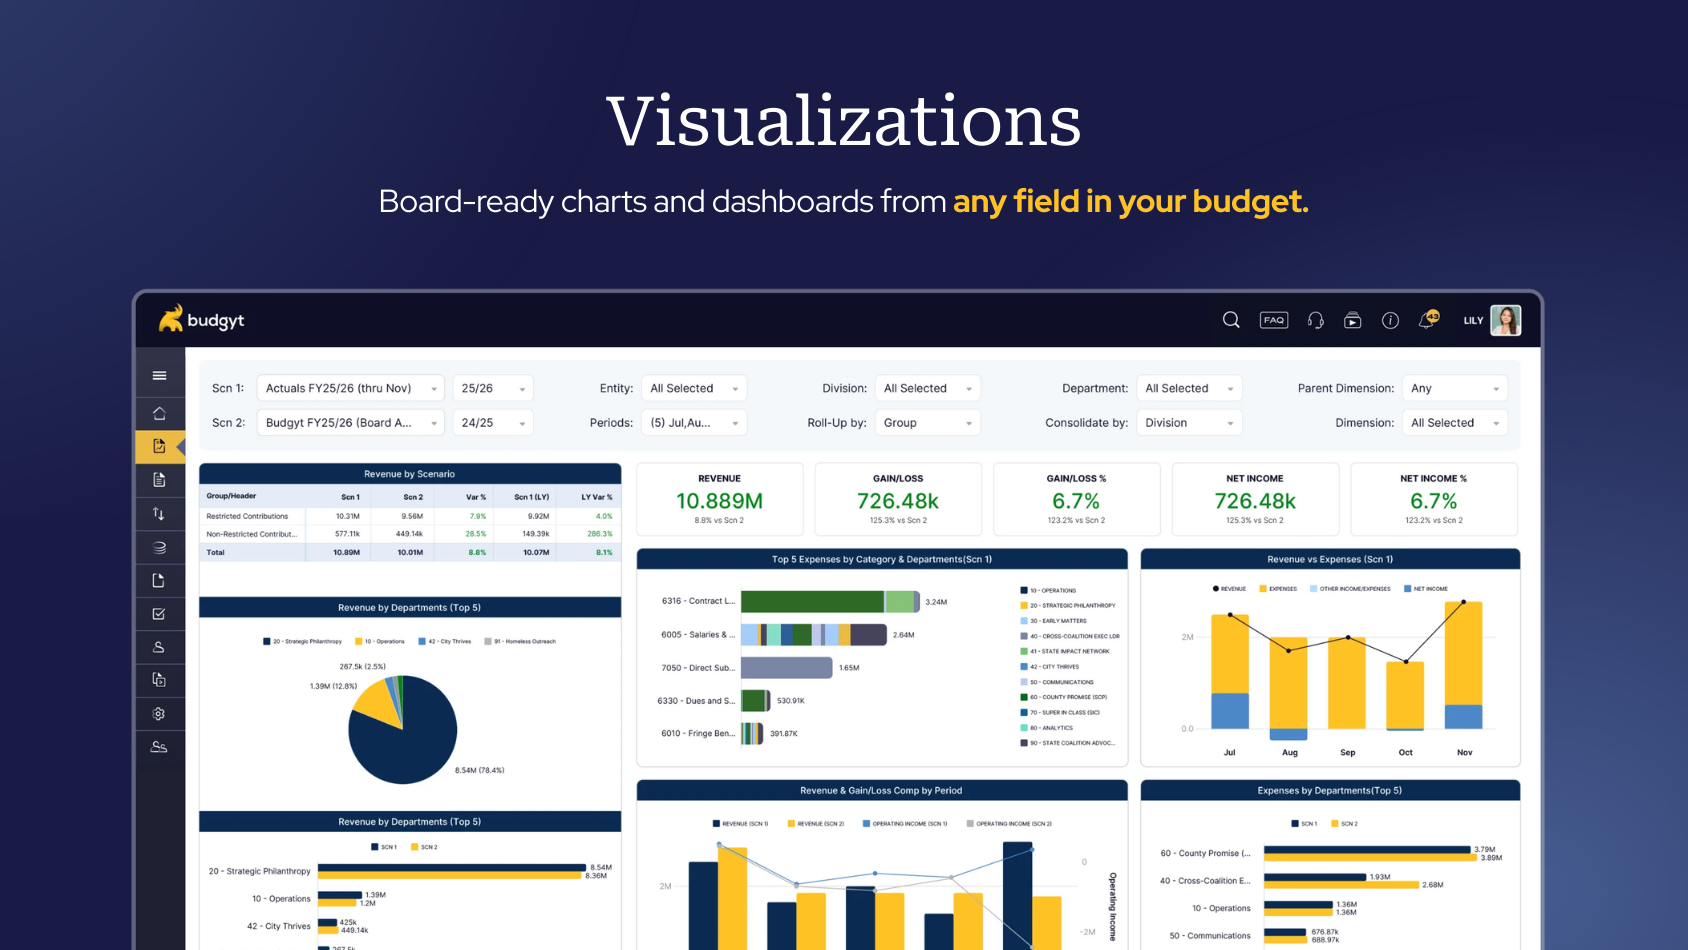
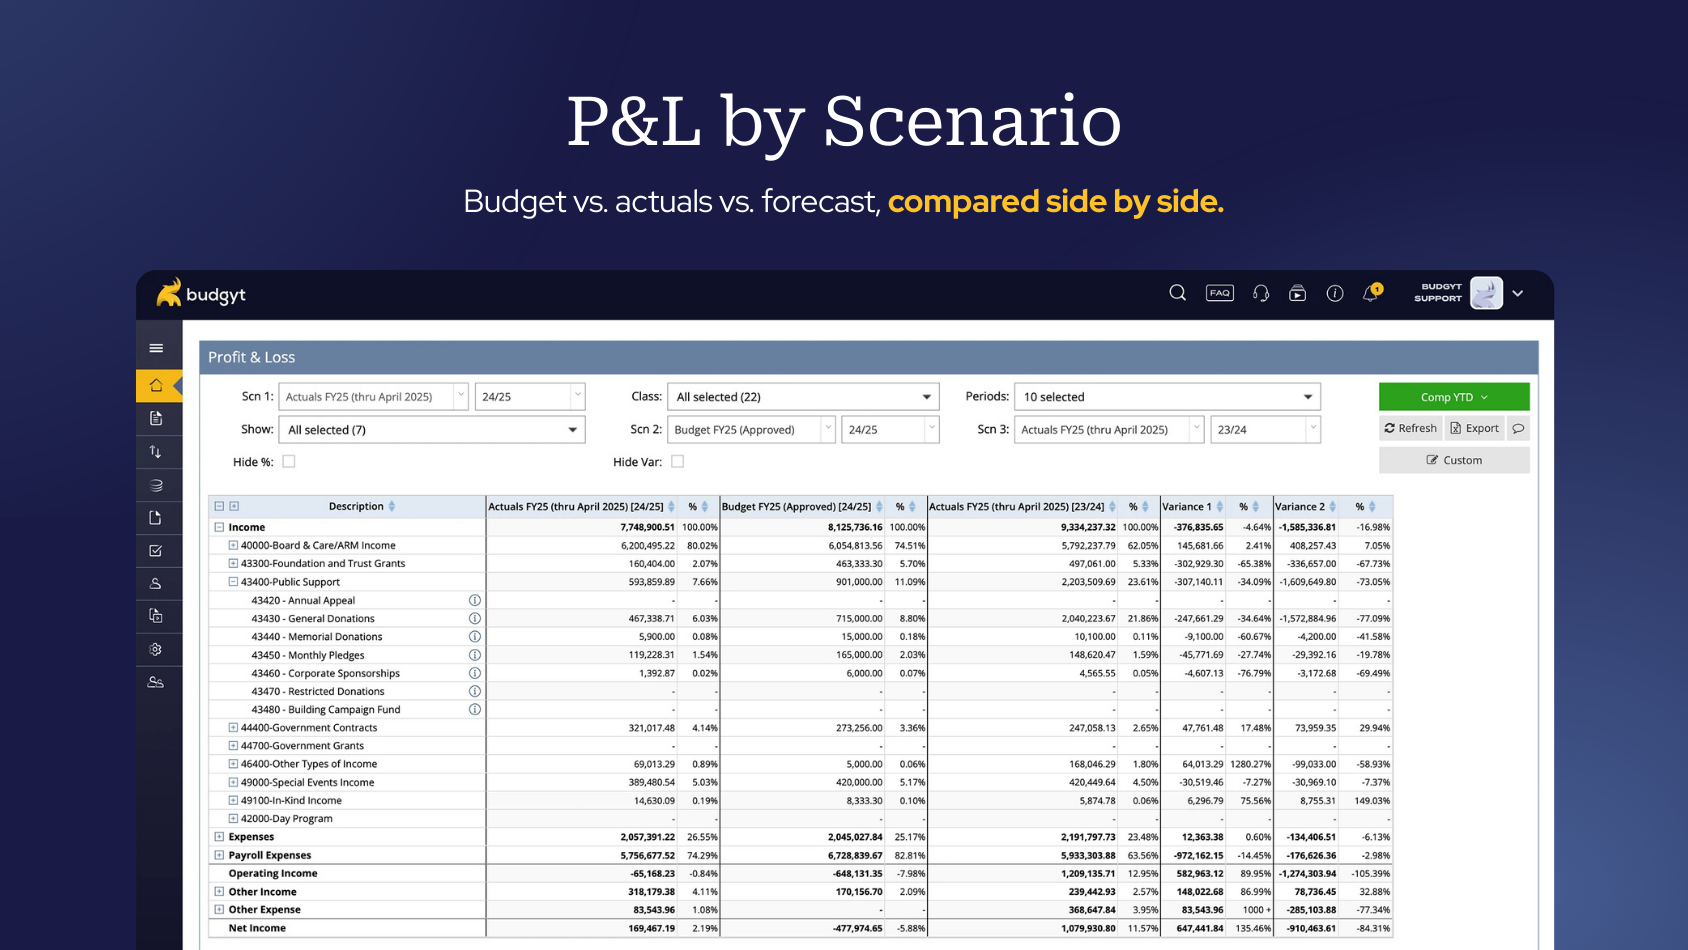
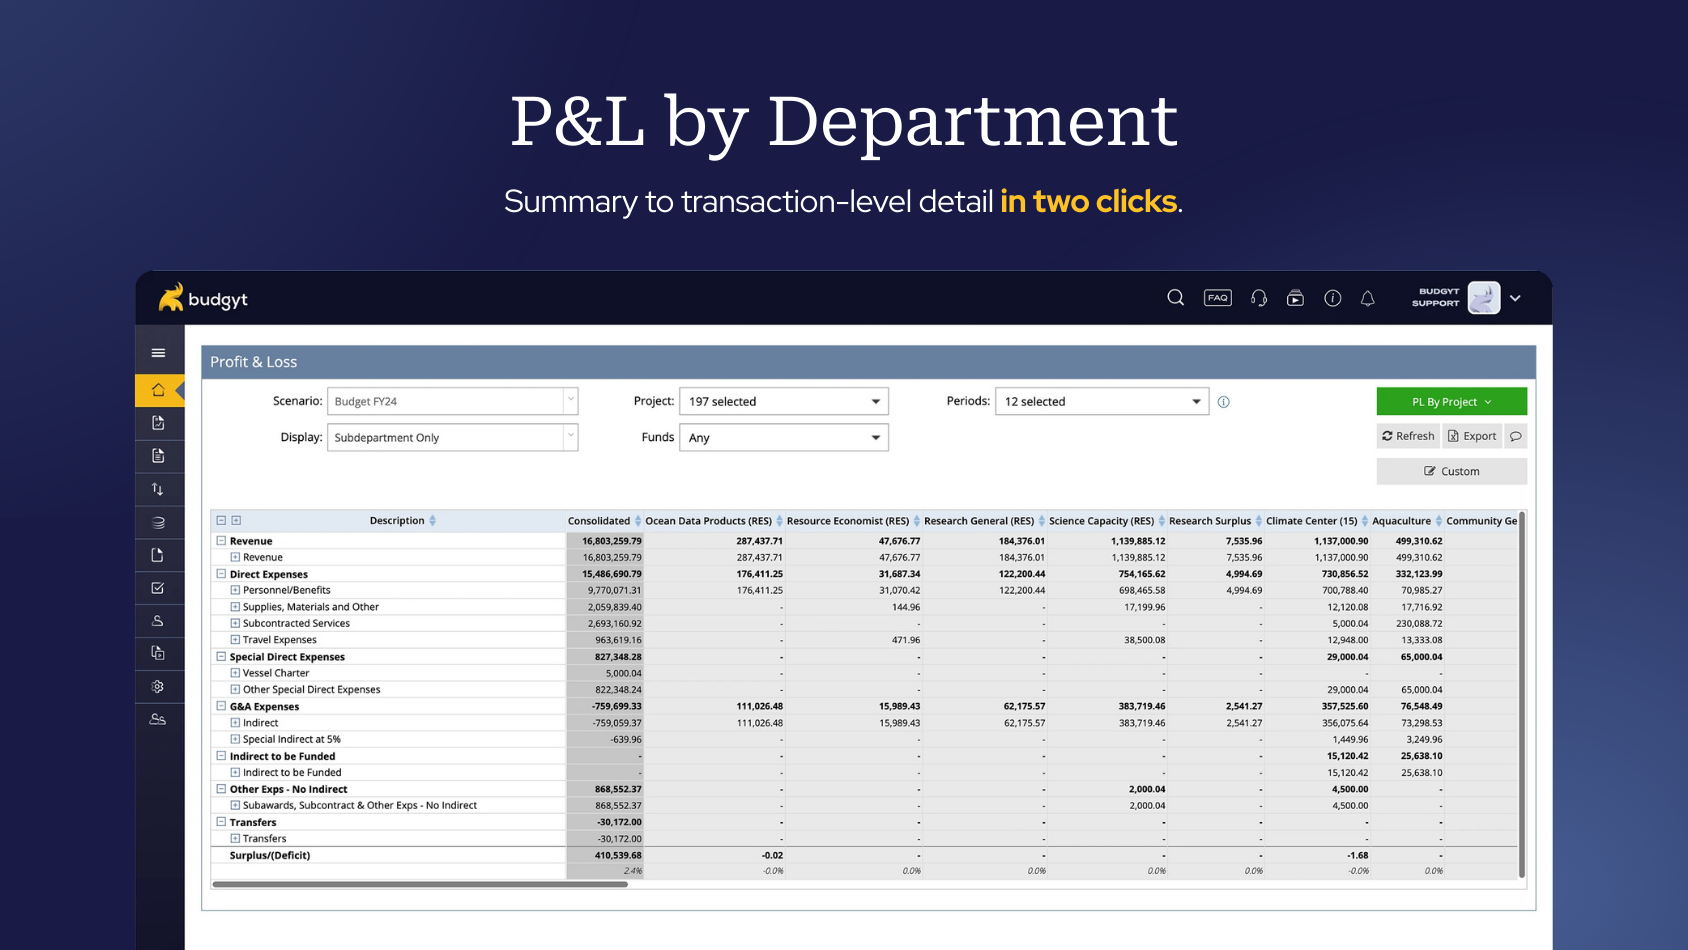
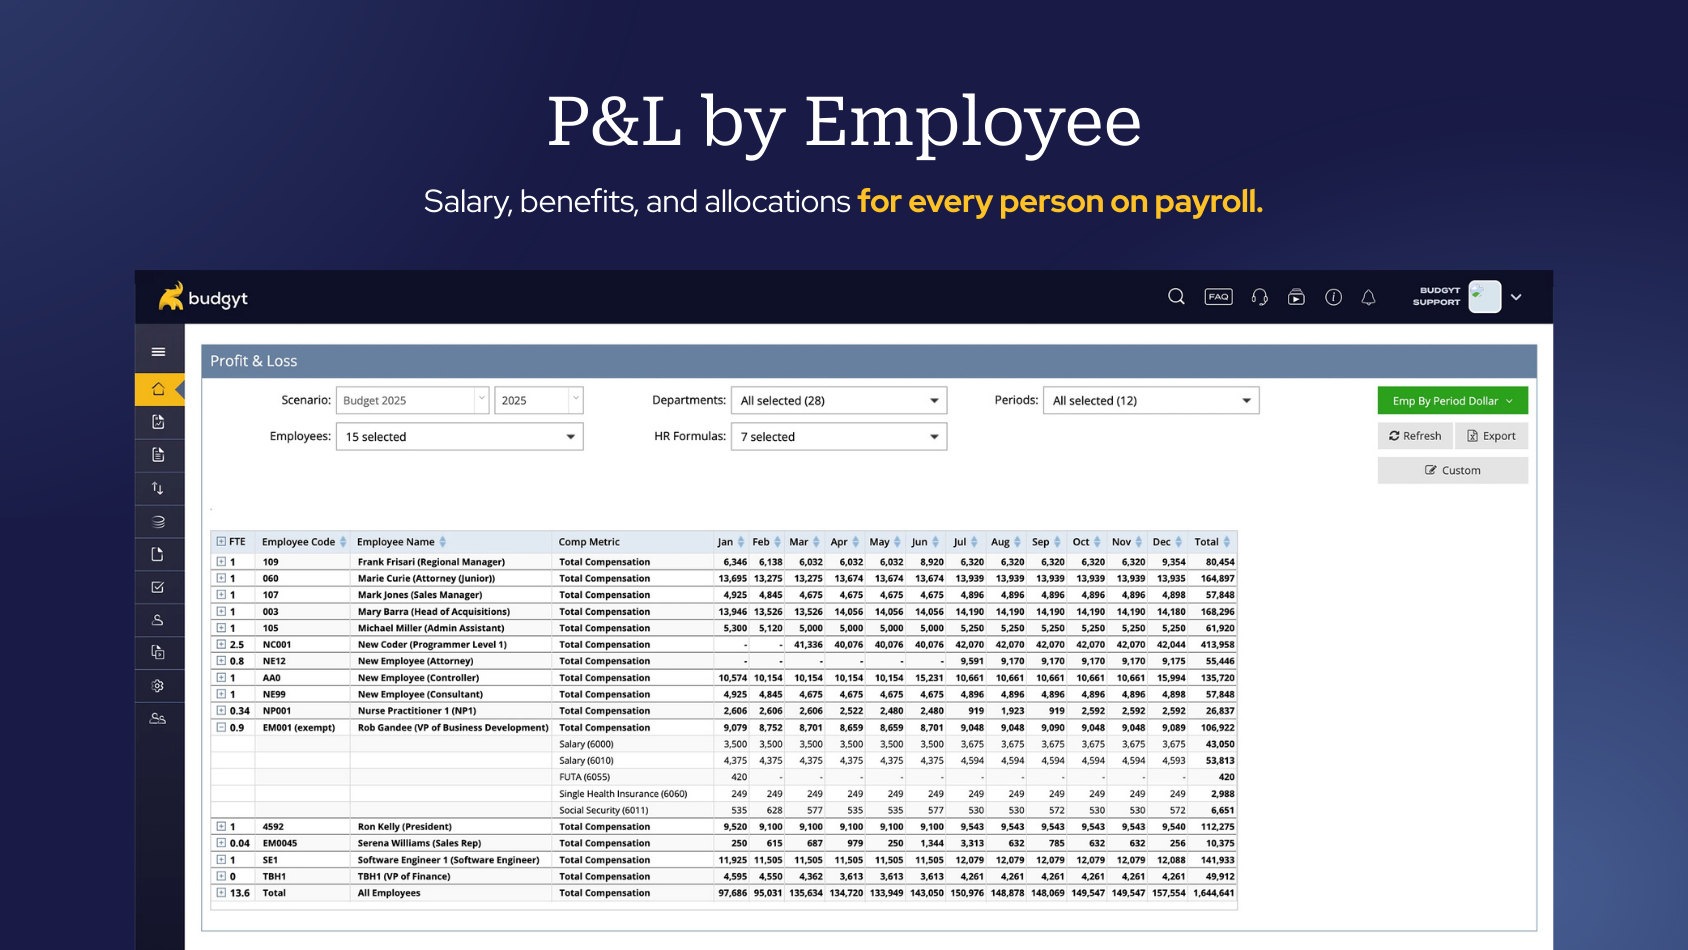
We use Budgyt to create easy to read reporting from data downloaded from QuickBooks Online. Before Budgyt my leadership team and board not have clean and easy to access financial data available. It also took us hours to prepare monthly reports - now it takes only about an hour each month.
Pros
- QBO import
- Clean reporting
- Access to those that need to know
Cons
- Entering/changing data on the backend
Return on Investment
- Ease of use
- Time savings
- Reporting clarity
Usability
Other Software Used
QuickBooks Online, Rippling, Microsoft 365