Big fan of Chartbeat
Use Cases and Deployment Scope
Pros
- Live statistics
- Historical data
- Traffic direction/generation
Cons
- Can load too slowly
Return on Investment
- Positive - all staff can see how any content is performing in real time
1 / 7
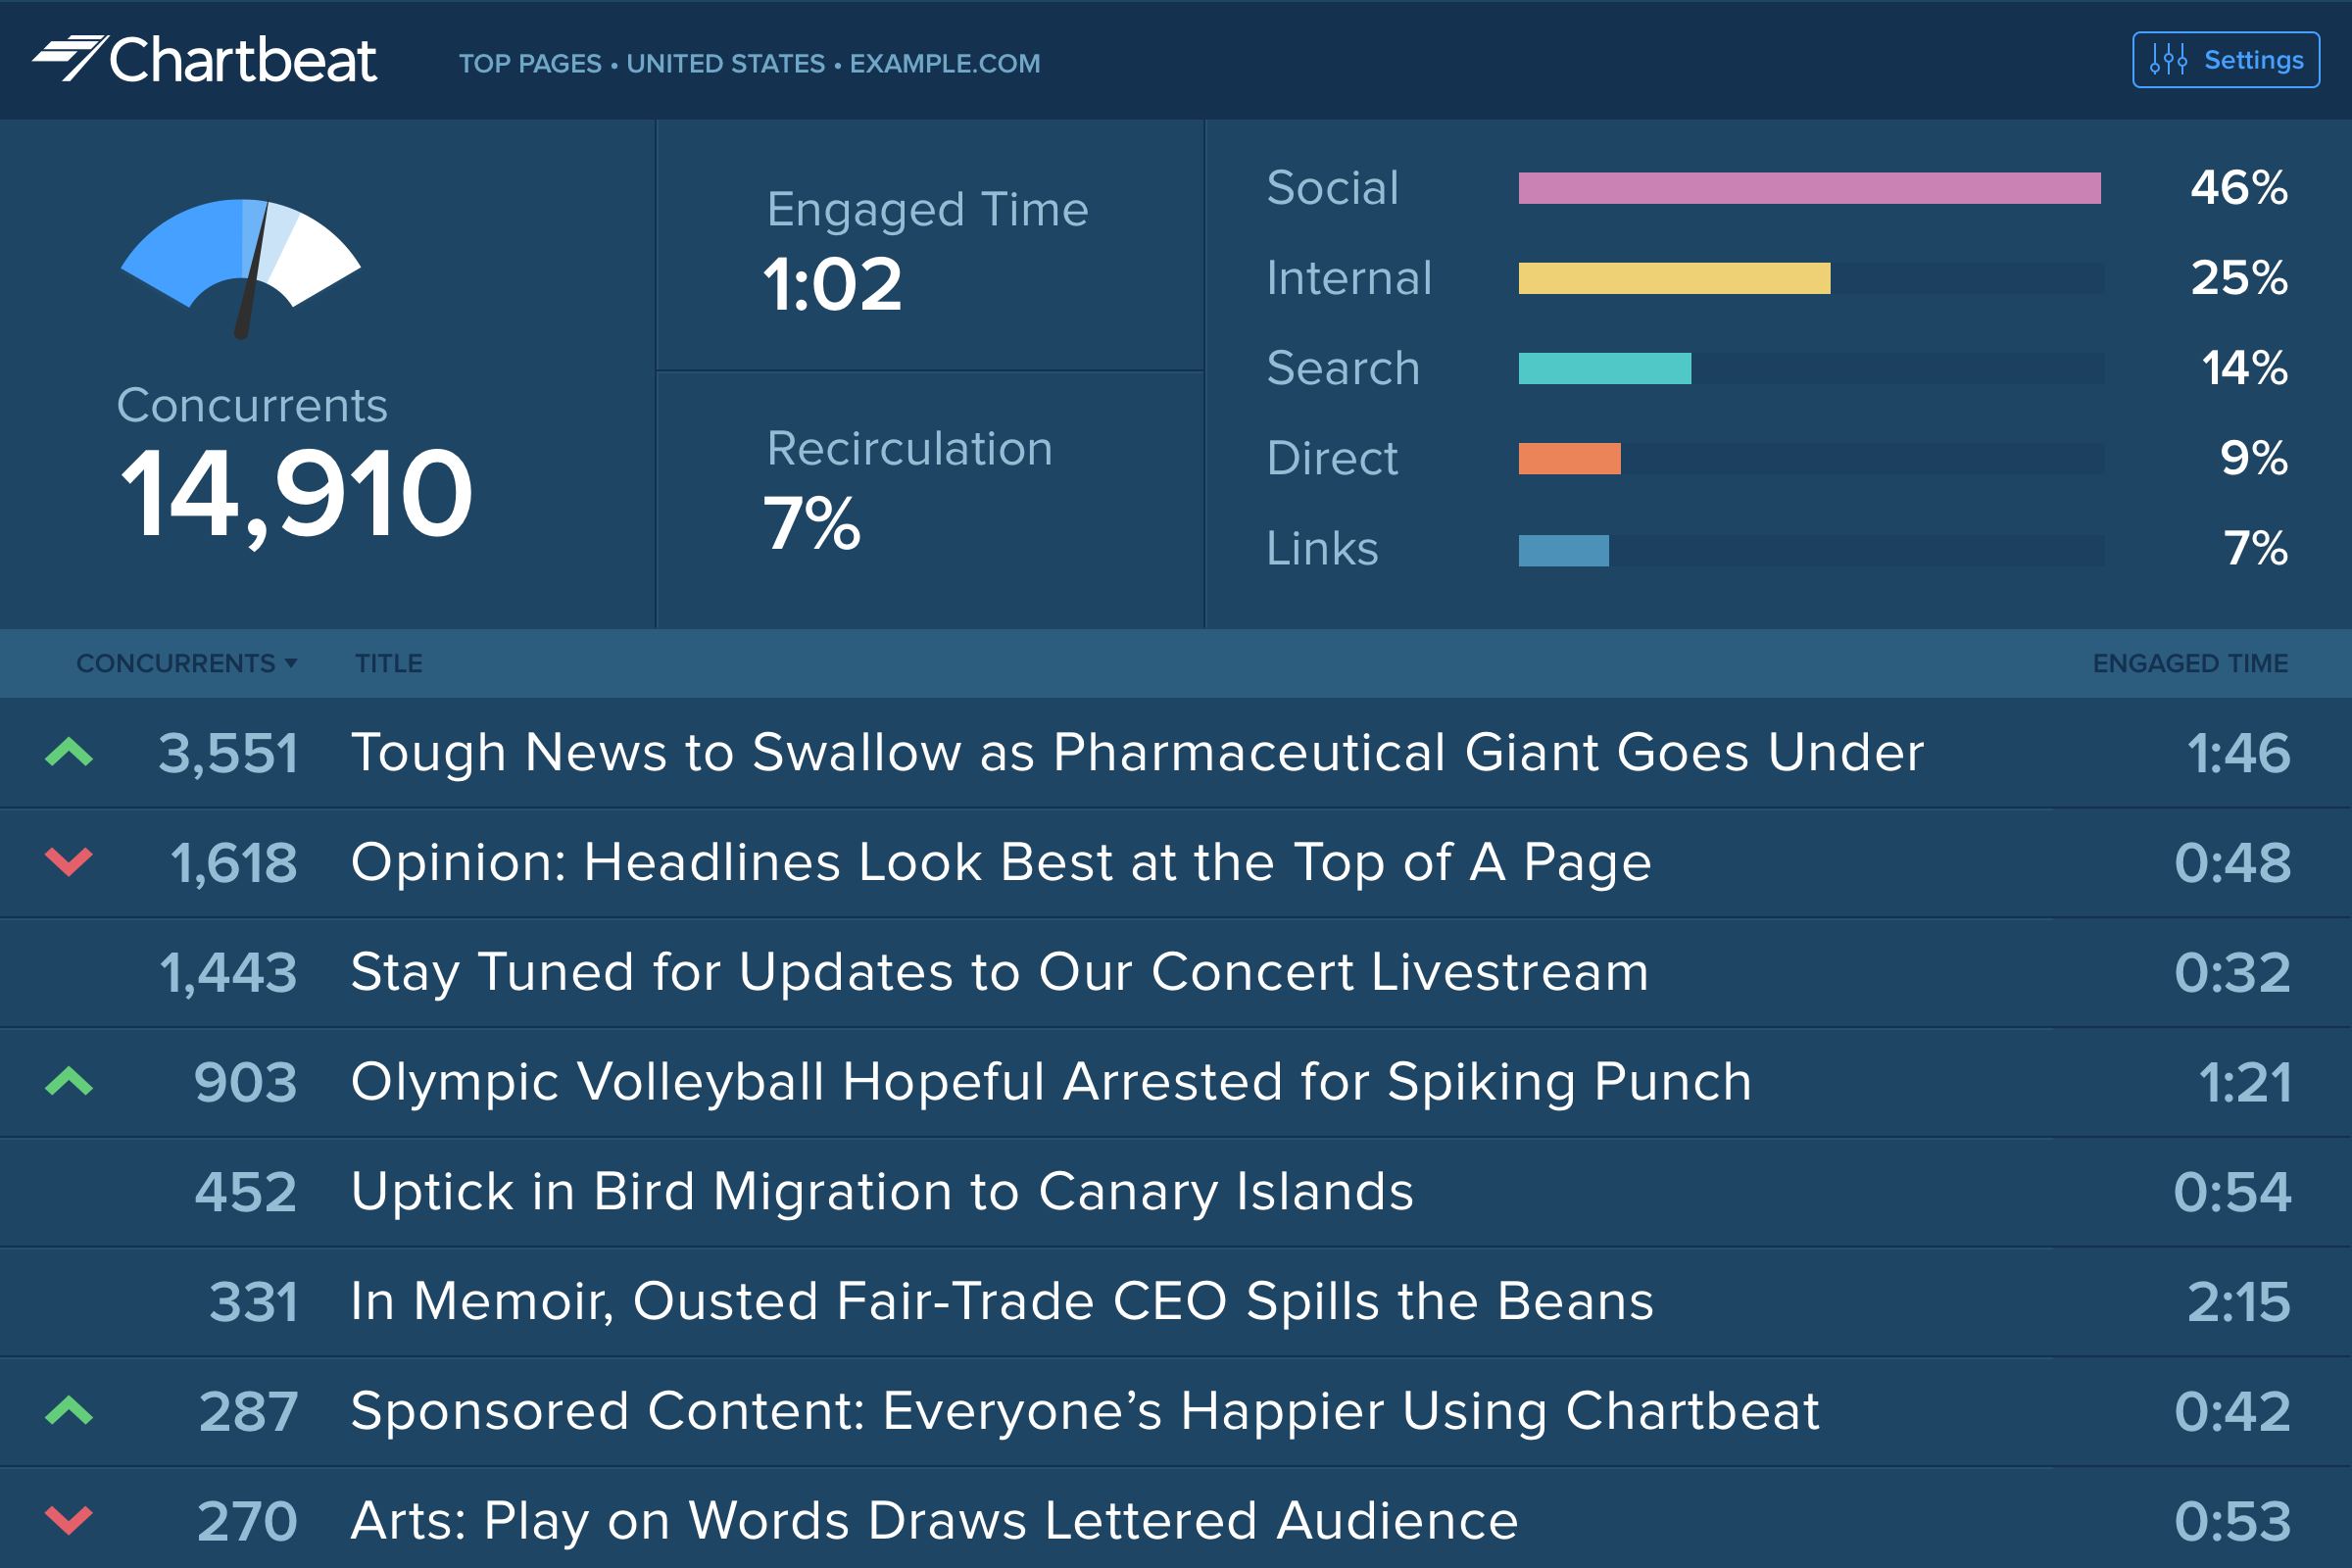
Screenshot of Big Board: For newsrooms, the leaderboard-style visualization shows the top stories on the biggest screen.
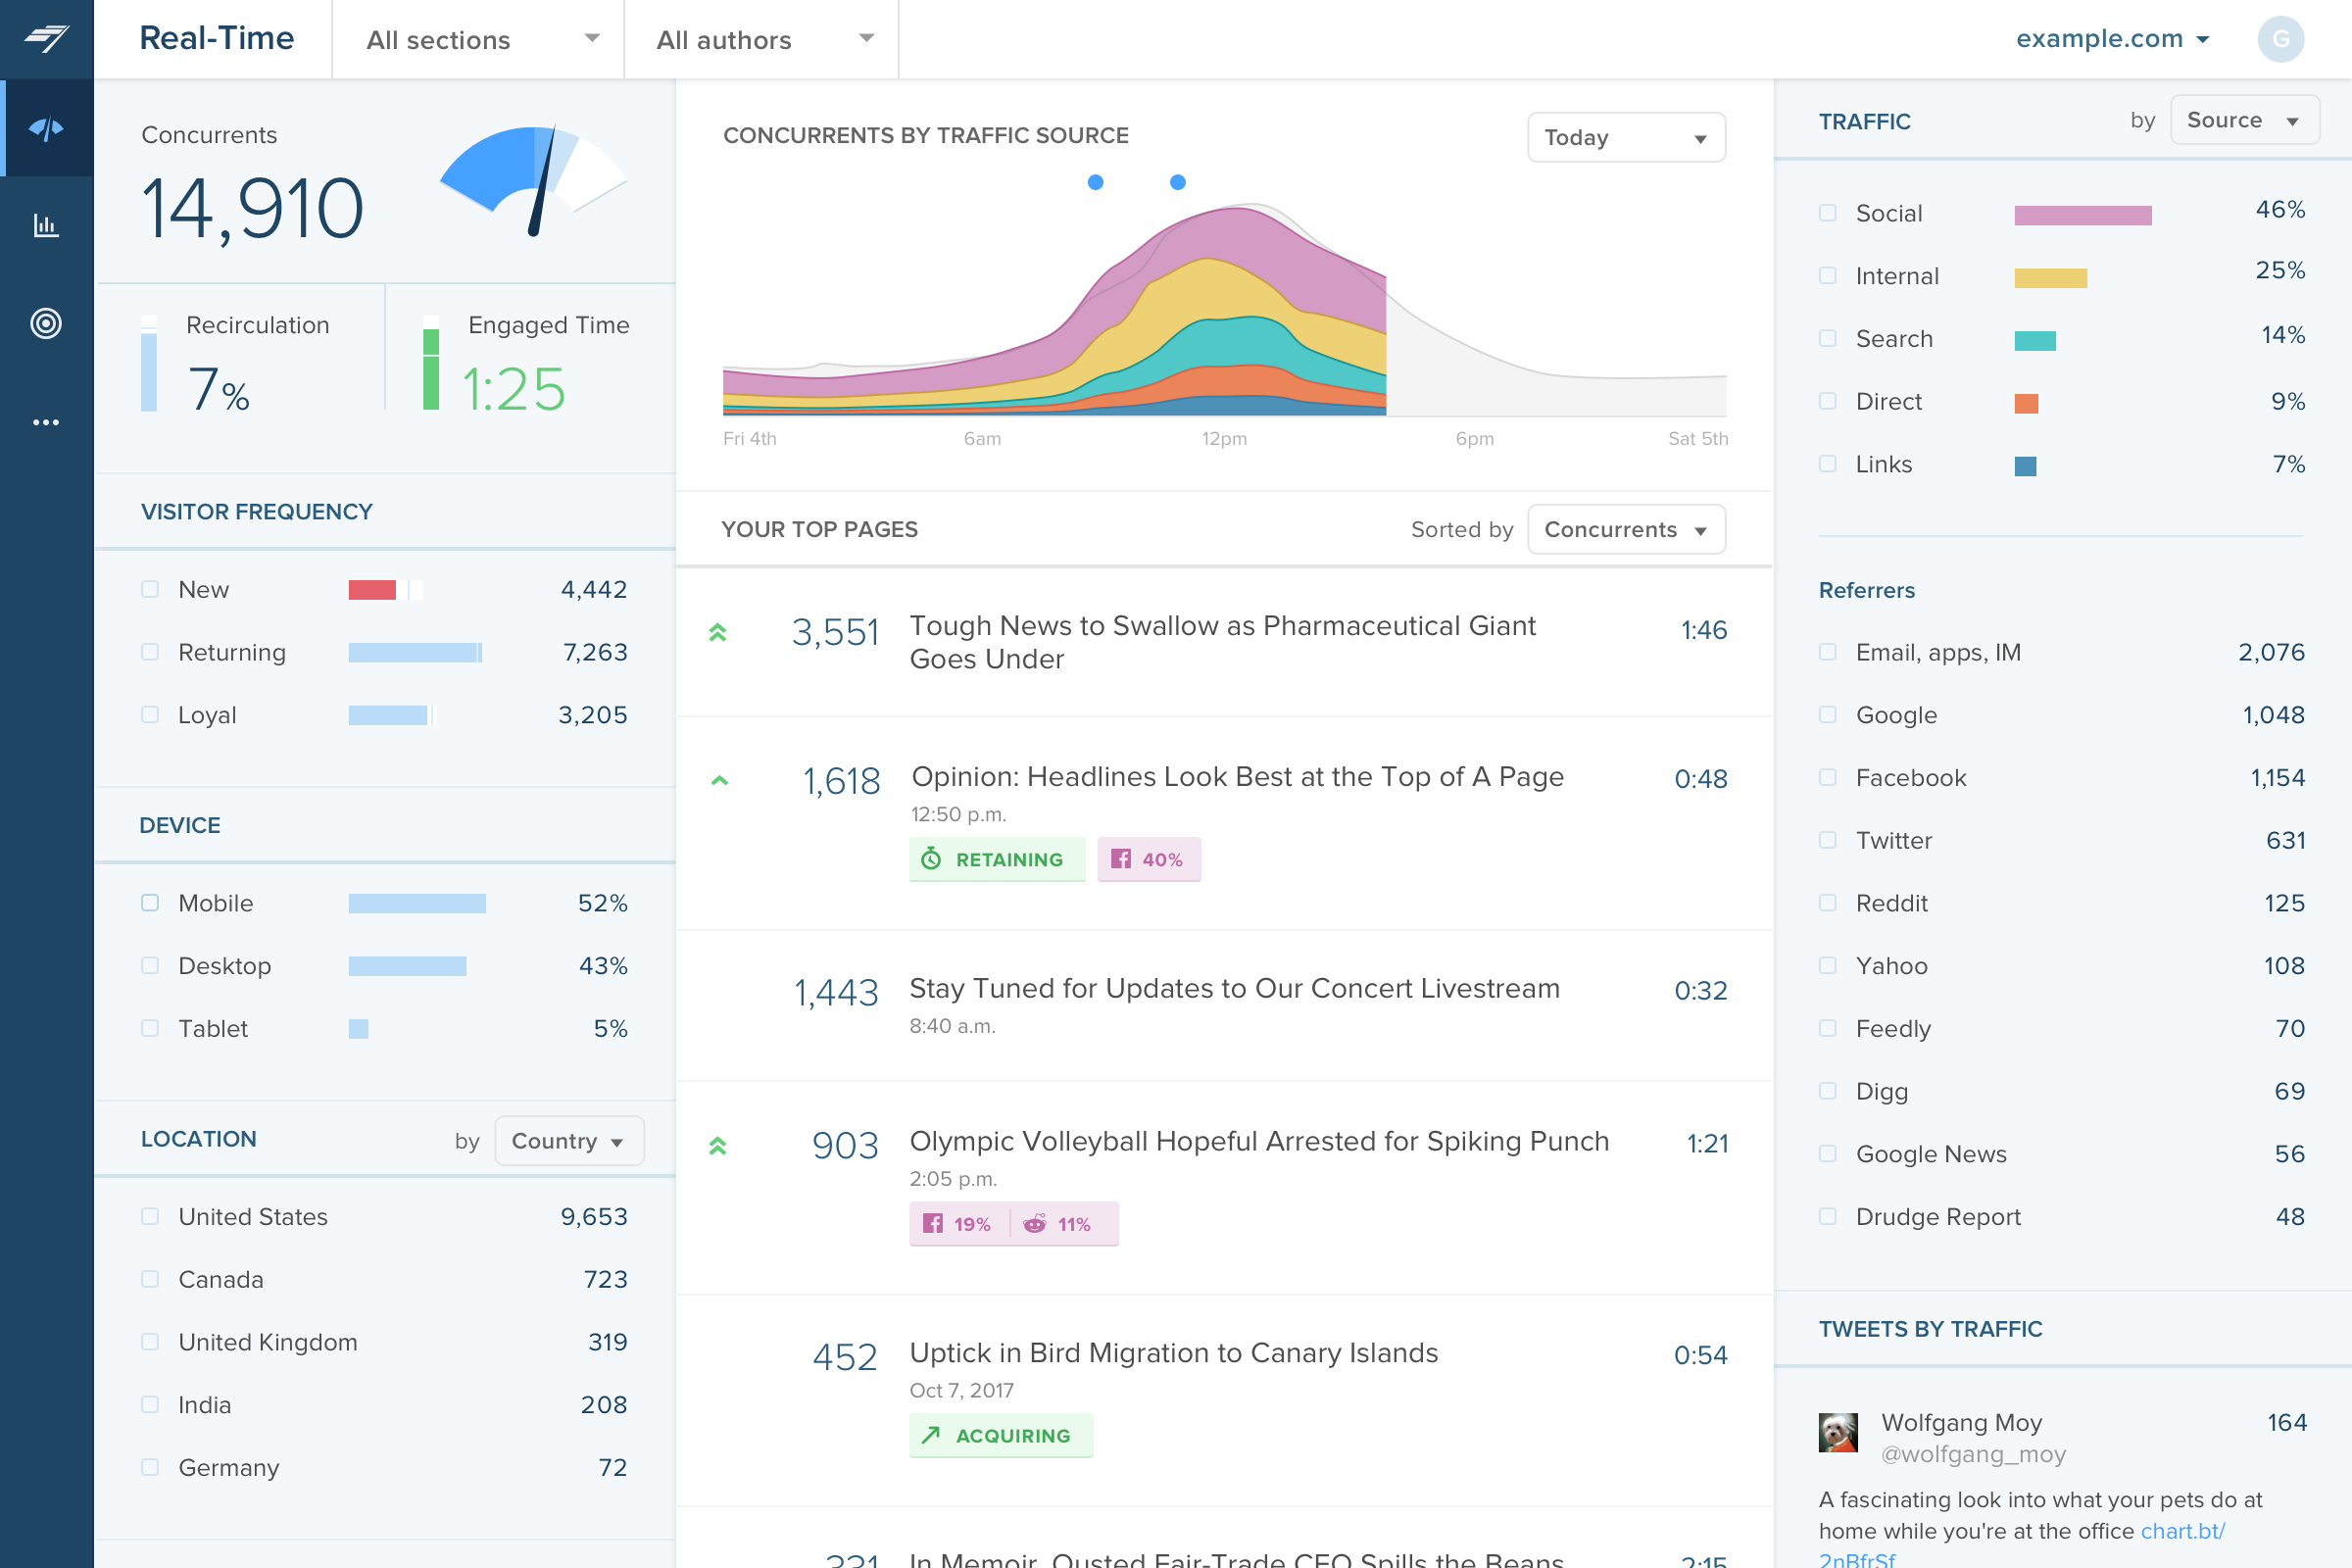
This feature provides immediate data and analysis about web traffic and user behavior, facilitating real-time decision making.
Category average: 7.9
A feature that records and provides data on a specific page's popularity and the number of times it has been viewed by users.
Category average: 8.7
This enables the tracking of specific actions or 'events' on your website, such as button clicks, form submissions, and engagement with other interactive elements.
Category average: 8.4
This feature measures the number of users who visit only one page on your website before leaving, helping to identify issues with content quality or website design.
Category average: 7.9
This feature allows users to personalize their view of data and reports to focus on specific metrics that best fit their business needs.
Category average: 8.3
This tool allows you to follow a user's path through your website until they complete a certain action, like making a purchase or signing up for a newsletter, enabling you to understand what leads to conversions.
Category average: 7.8