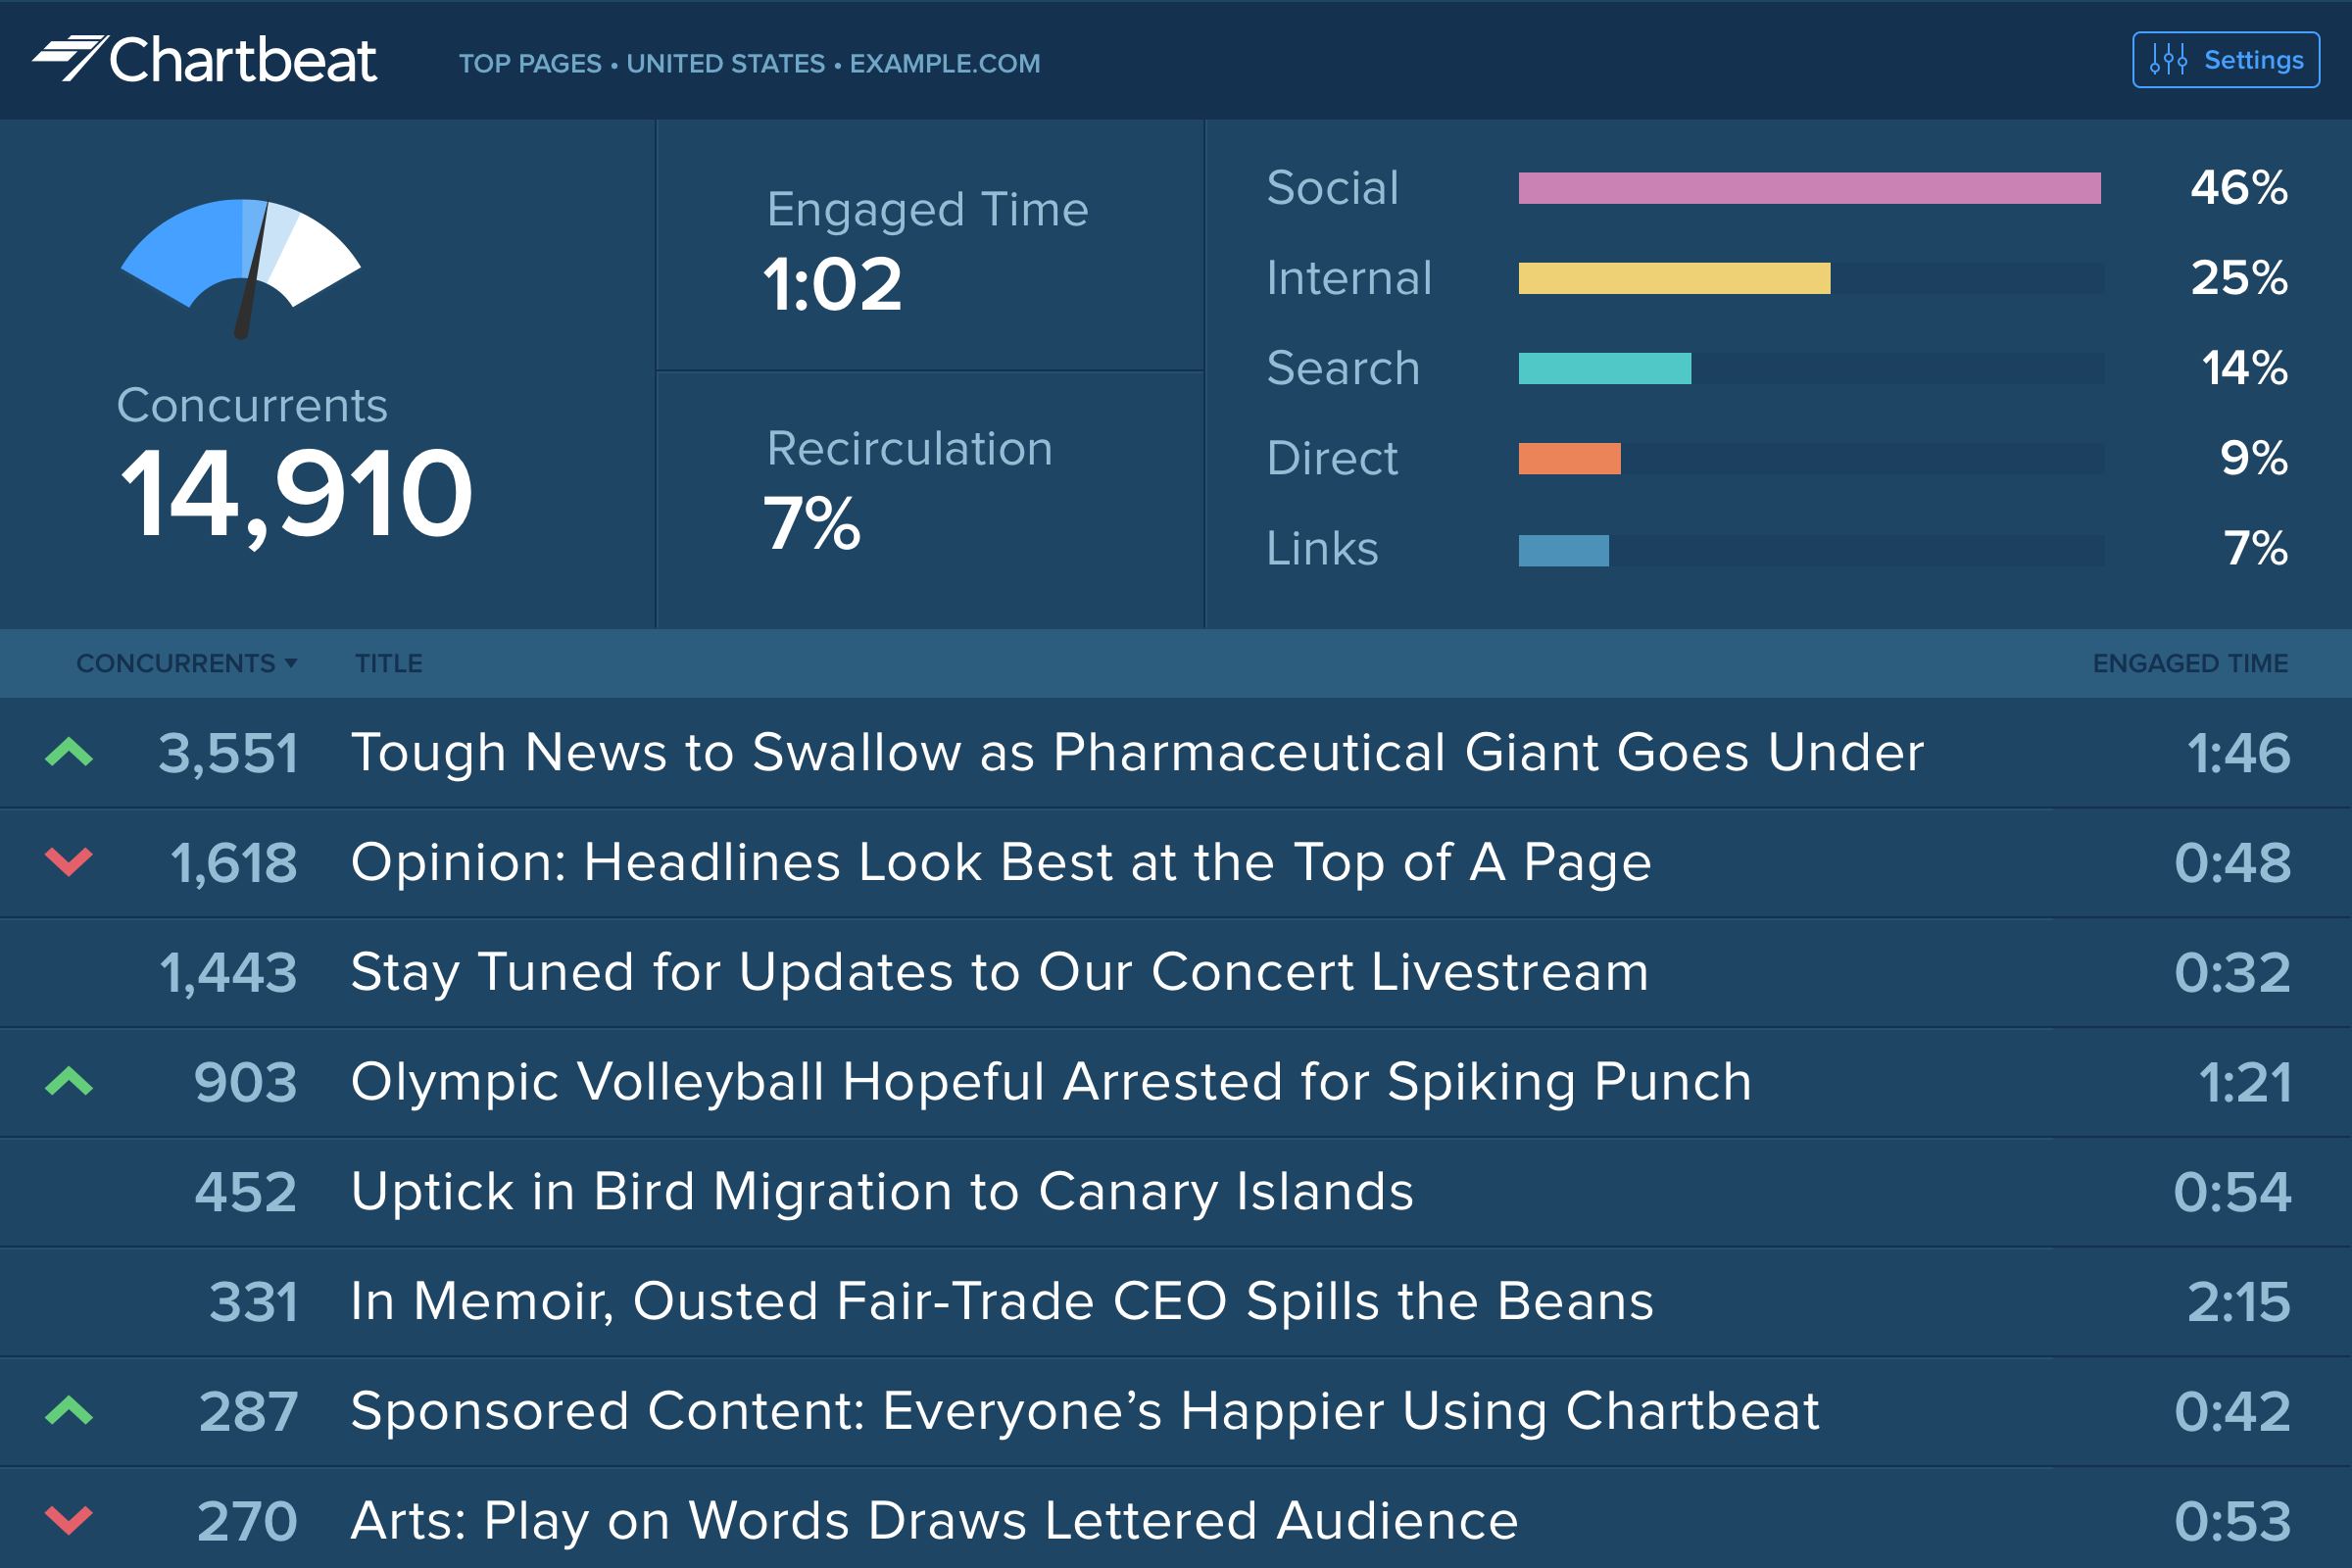
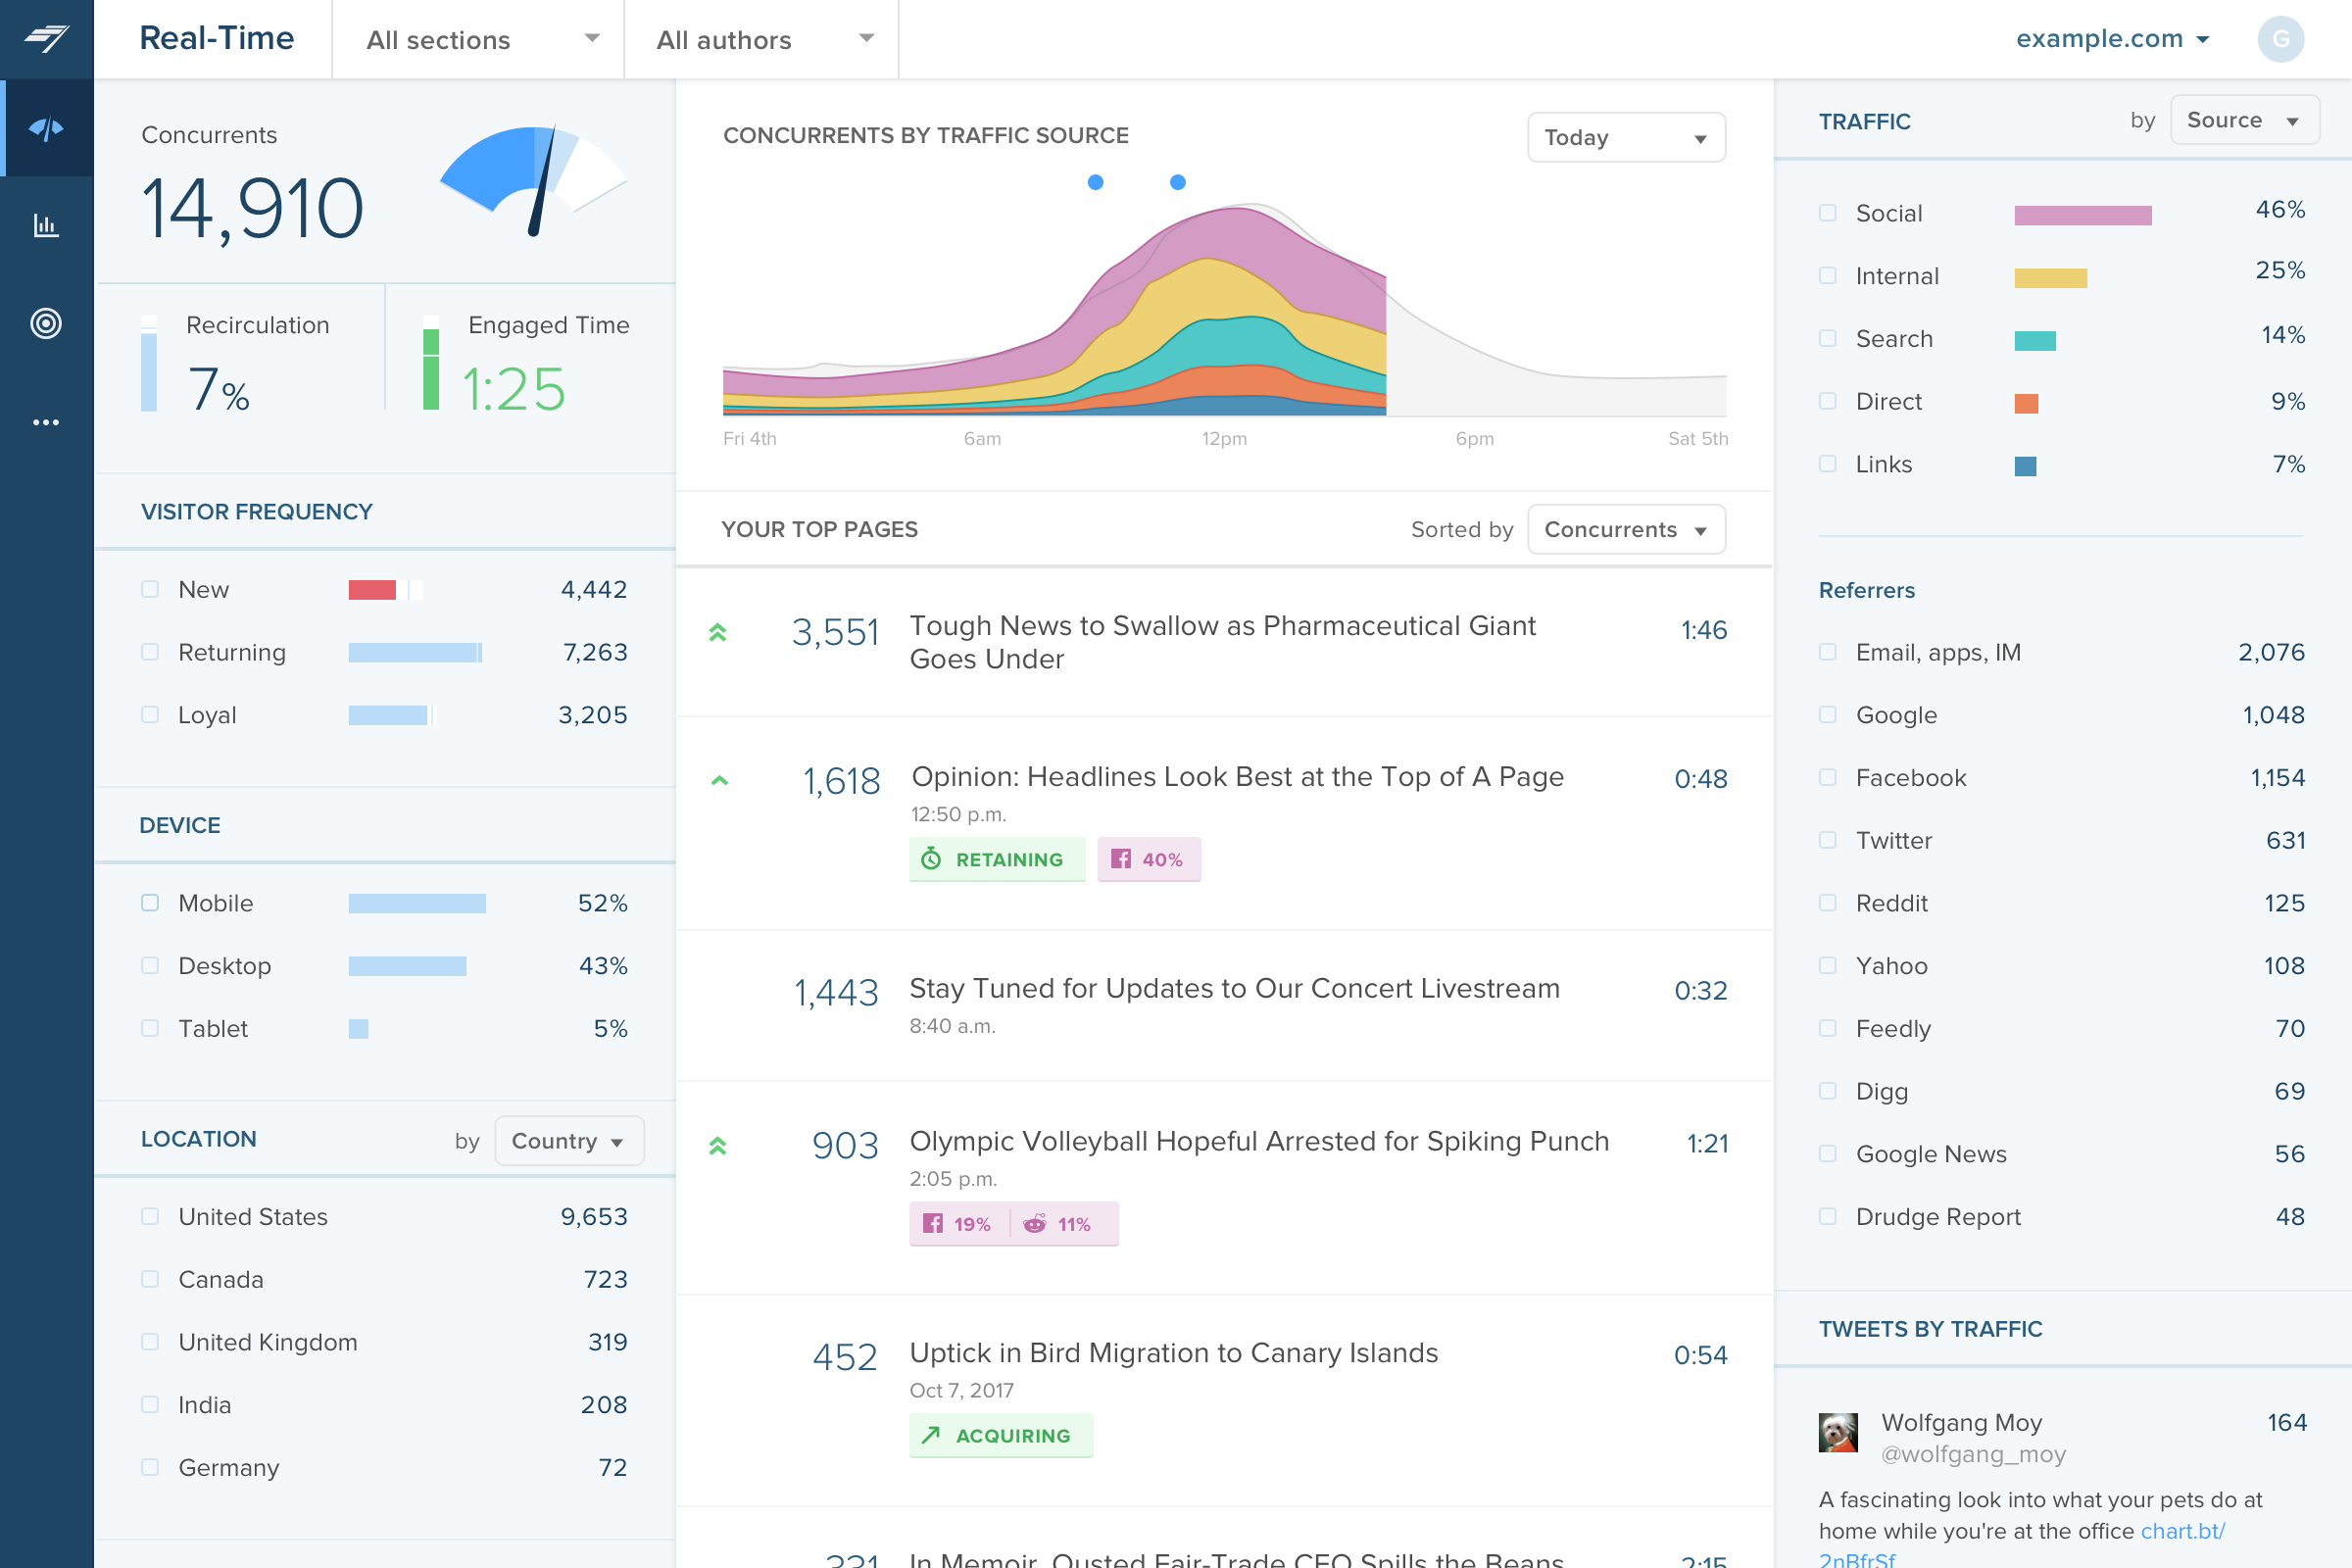
Chartbeat delivers real-time analytics, insights, and transformative tools for content teams around the world, to help improve audience engagement, inform editorial decisions, and increase loyalty.
N/A
Contentsquare
Score 7.3 out of 10
N/A
Contentsquare is an enterprise experience intelligence and Digital Analytics platform designed to track, visualize, and optimize user journeys across websites and mobile applications. The platform captures digital interaction telemetry—such as clicks, scrolls, hovers, and page drop-offs—without manual event tagging to power Web Analytics, session replays, funnel visualization, and experience monitoring.
N/A
Pricing
Chartbeat
Contentsquare, now with Hotjar
Editions & Modules
No answers on this topic
No answers on this topic
Offerings
Pricing Offerings
Chartbeat
Contentsquare
Free Trial
Yes
No
Free/Freemium Version
No
Yes
Premium Consulting/Integration Services
Yes
No
Entry-level Setup Fee
No setup fee
No setup fee
Additional Details
Chartbeat pricing is based on monthly site page views. Discounts are applied to multi-year contracts. The Basic Plan includes the Real-time Dashboard, Historical Dashboard, Heads Up Display, Reports, Big Board, iOS and Android app, and Real-time API endpoints.
The Plus Plan includes all of the Basic Plan features, plus ONE of the following Premium features: Headline Testing, Advanced Queries, or Multi-Site View.
The Premium Plan includes all of the Basic Plan features, plus ALL Premium features: Headline Testing, Advanced Queries, Multi-Site View, and enterprise-level support and custom trainings.
The main point of benefit is the realtime data. This is vital to our team as we are publishing a lot of content per day, so we have a busy homepage to manage and it's important to know which content is performing well. We also like to get an understanding as quickly as possible - which Chartbeat offers - of where traffic is coming from. Often we will see an example where a page is getting high traffic from Google, for example, and we know that might not need to be placed so prominently on the homepage because the traffic is arriving to us externally anyway. Without that depth of understanding what is performing best and why - updated immediately, unlike in Google Analytics now - our homepage would not be as well optimised for users coming to us direct
Hotjar is good for a first pass at understanding user sentiment or locating potential usability issues. There are features such as "rage clicked" which shows recordings or instances when a user rage clicked or had an issue with your site. Hotjar has also been helpful to launch intercept surveys on mobile, desktop, and app, which not all competitor software allow. Hotjar recordings are fun to watch. "Watching Hotjar like Netflix" is a favorite pastime at work.
Heat mapping is great on Hotjar. It is a good place to start when you are looking at the UX & CRO on your website. You can see the % of people clicking on elements on a page, how far they scroll, and mouse movements.
Hotjar is great for session recordings. These record the mouse movements, clicks, pages and scrolls of a user in video format. You can watch these to investigate what works well on a site and identify potential roadblocks and bugs.
Hotjar is great as it ensures that users details are anonymous; for instance, if you are watching a session recording, you cannot see what a user types in a form field, as Hotjar blanks this out.
Hotjar has a poll function, so you can have polls on your website.
Source of traffic needs improvement. Search and social make sense, but "internal" and "links" is a grey area. It would be helpful to define those with an organization and provide an information icon so users can easily remember what each of those buckets is tracking.
More ways to customize the real-time board. For example, with video content, that's great that I can see a user has started a video, but what is the completion rate, was that only on O&O or can that track Facebook, too?
Would like to see demo (age) information included as a way to slice the data so I can see what's working with my older and younger demo.
I gave Chartbeat a 5 for a renewal rating, because, while it delivers clear and understandable content, Google Analytics also provides many of the same features for free. For a small to medium website, I believe it would be more cost effective to use Google Analytics. A website with a high amount of traffic, however, could merit spending the money on Chartbeat to maximize their potential.
For small companies with limited user testing budgets, ClickTale serves as a useful user testing tool. When I cannot get the funds for in depth user testing, I always know that I have a baseline of information I can rely on
I am able to "set it and forget it," keeping it up on my monitor for either constant checking or just keeping an eye on the numbers during the day. I'm also able to keep track of what times are perfect to post a story and which stories rack up the most traffic.
It is fairly easy to use, easy to explain, and easy to learn even for a non-techie like me. I admit I was a little intimidated when it was recommended by my developers, but I learned afterwards that there really was nothing to worry about. My experience has been awesome so far!
I have had limited experience of support for Chartbeat but whenever I have needed help it has been there. Recently there was an issue of seeing different forms of data in real time - app and otherwise effectively, and the issue was being clearly dealt with and communicated back to us.
Hotjar is a SaaS-based company, and as such has a good support service. Users can quickly submit support tickets through Hotjar's online portal. Enterprise customers get access to additional support members and have SLAs to support their larger, more complex needs. Overall, Hotjar is extremely reliable and I've never had to reach out to customer support.
Omnilytics is more robust, detailed, and catered for an intermediate media user, while I think Chartbeat is a more user-friendly and beginner-oriented piece of technology. That being said, there is an impressive amount of lift for Chartbeat, and it's evident that simplicity is the key to using a software daily (which is absolutely the point in the content world).
ContentSquare [(Clicktale)] is going deeper on UX understanding than traditional web analytics tools. You can truly understand how a page is used (where users click or even miss click, on which part of the page they are spending most of their time, if some links are clicked but bad positioned on the page...), and that's a thing you can't really measure trough a traditional web analytics tool.
Our UX team can now use hard data to back up and validate design decisions that we make. Our role as usability experts is becoming more respected and integral to business objectives because we now have data that can back up our field of study and prove that our roles are demonstrably useful and necessary.
HotJar allows our small team of 3 UX designers to get research data as if we were a much larger team. Instead of painstakingly using our time to do guerrilla research, endless user observations, and other types of manual testing, we can now get a significant portion of our data from HotJar.
Using HotJar is actually giving our team a sense of excitement and enjoyment in our day-to-day usability work. Instead of seeing UX as a chore, HotJar is making data gathering and analyzing more fun, because we can see tangible results from a much larger pool of user/user-data than we could in the past.