TrustRadius: an HG Insights company

Quantrix

Score7.4 out of 10

16 Reviews and Ratings

What is Quantrix?

Quantrix is designed to allow users to address the limitations and risks inherent to spreadsheets when developing business-critical models. According to the vendor, this solution offers unmatched capability for forecasting, planning, budgeting, risk modeling and visual analytics, and also allows users to develop ‘what if’ scenarios and model the financial and operational impact of business decisions. Additionally, the vendor says sharing insight is made easier through the creation of interactive presentations, reports and dashboards. Quantrix Modeler, our cutting-edge financial modeling platform, addresses the limitations and risks inherent in traditional spreadsheets. Quantrix Modeler provides a robust modeling environment for professionals to intuitively model financial and operational scenarios, using our proprietary multi-dimensional calculation engine.

Media

1 / 3

Top Performing Features

  • Forecasting

    Combining actuals and budgets, rolling forecasts, driver-based models.

    Category average: 8.6

  • KPIs

    Select from a library of more than 6,000 key performance indicators, and incorporate KPIs into your planning process.

    Category average: 7.9

  • Key Performance Indicator setting

    Ability to set key performance indicators for measuring progress towards goals.

    Category average: 8.3

Areas for Improvement

  • Personalized dashboards

    Create custom dashboards and reports without the help of IT or administrators.

    Category average: 8.1

  • Detailed Audit Trails

    Tracing changes to data and processes that were run.

    Category average: 8.2

  • Color-coded scorecards

    Track and analyze performances with interactive, color-coded balanced scorecards.

    Category average: 8.3

Flexible, accurate, and cost-effective

Use Cases and Deployment Scope

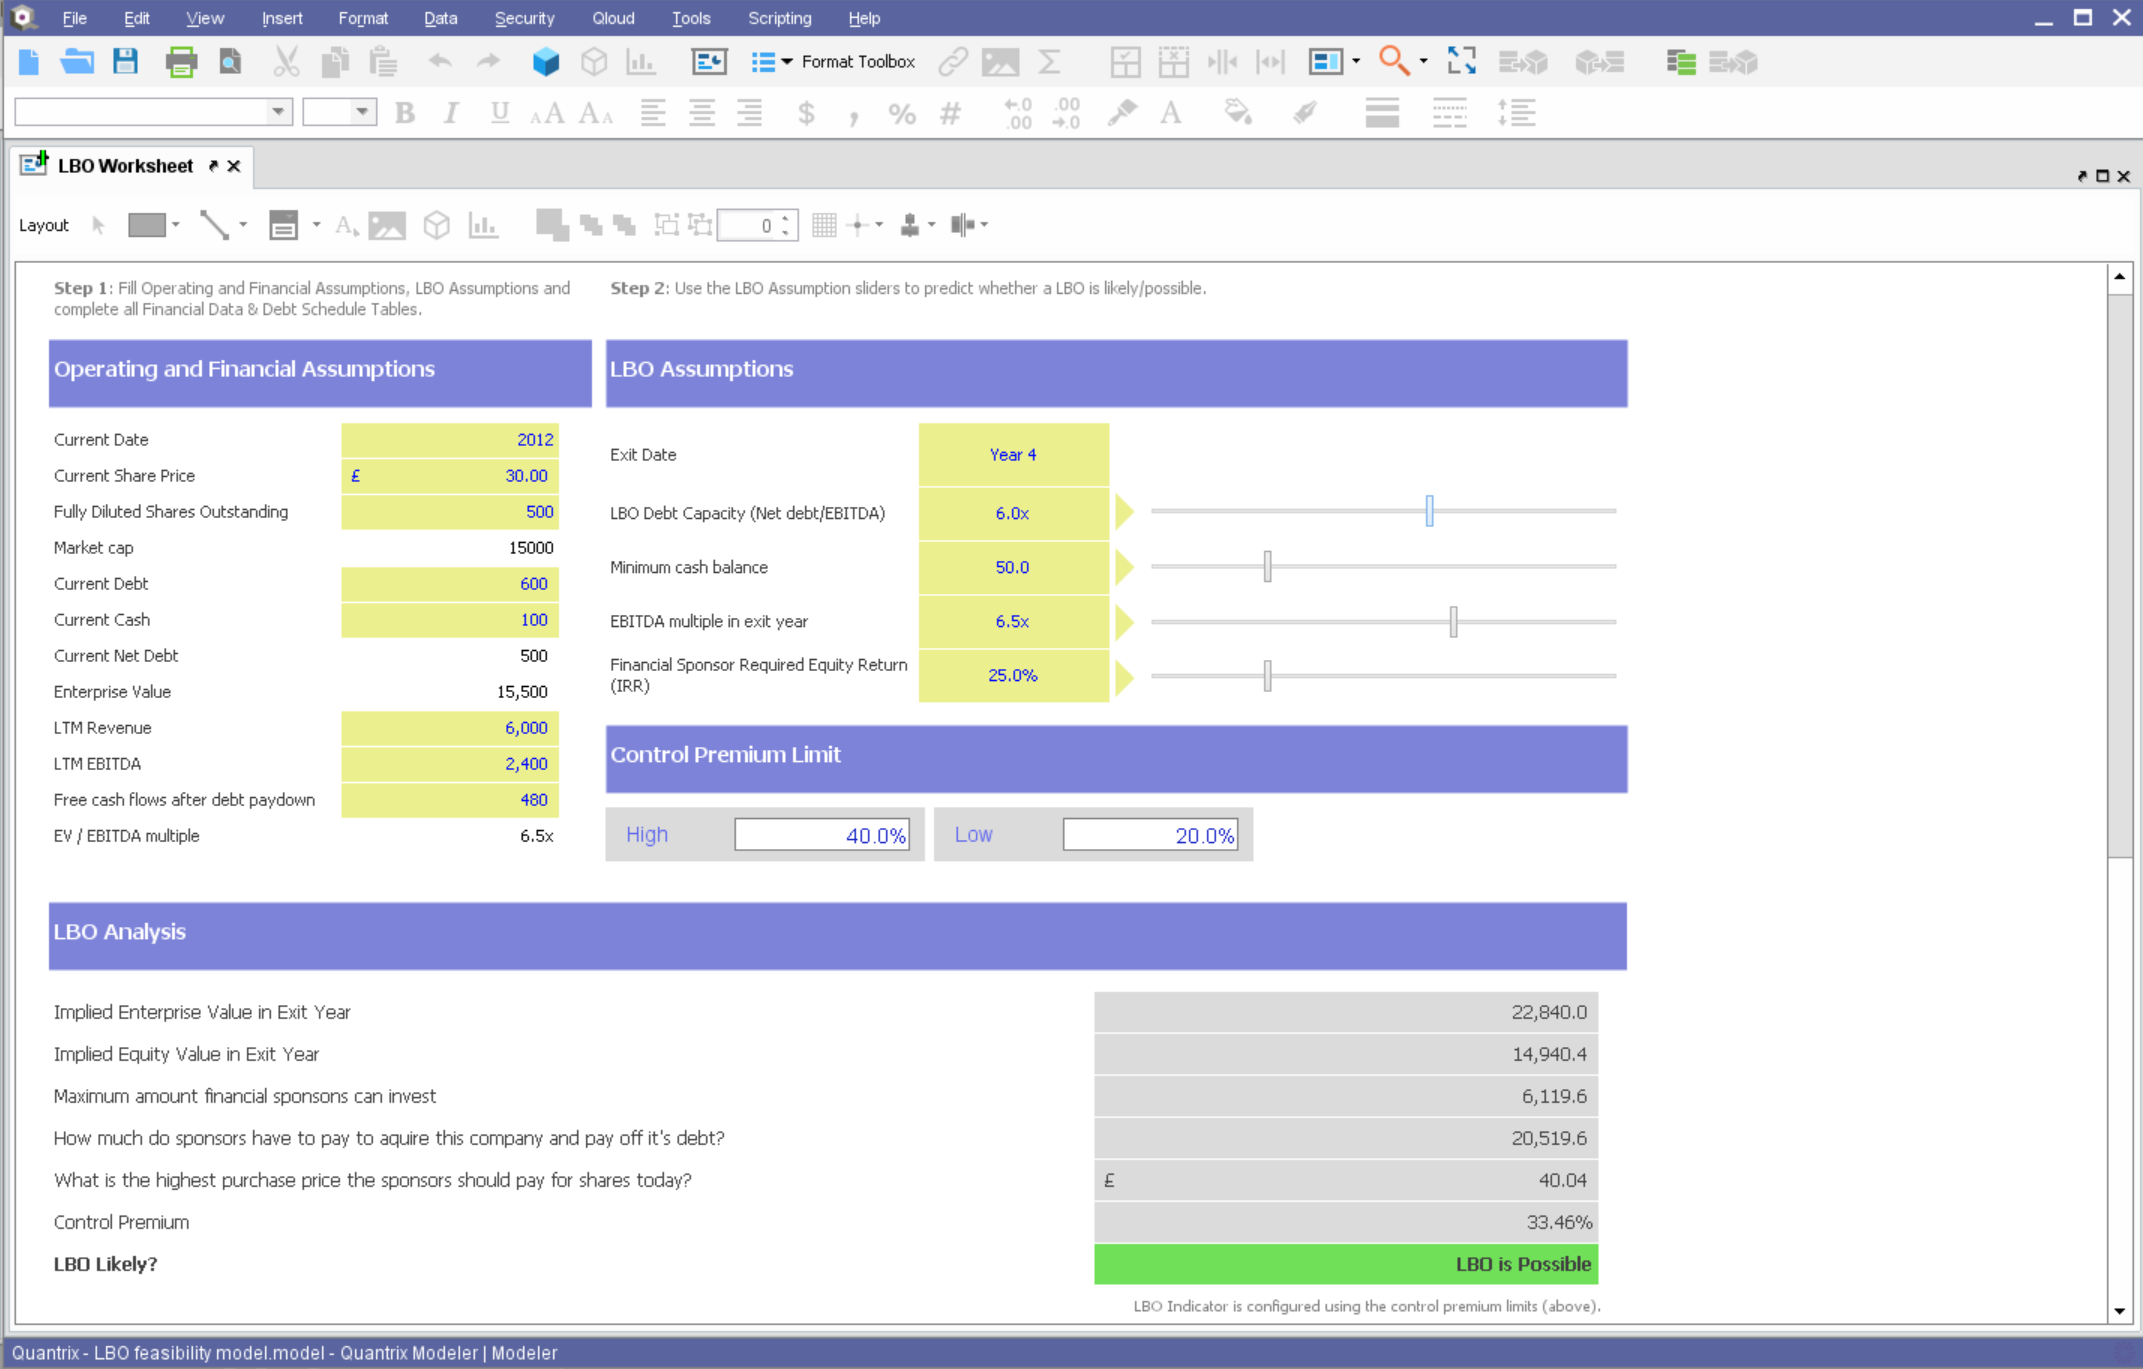
The team utilize Quantrix for calculating sales forecasts, financial calculations, and to keep track of different types of purchases. Our sales team, finance team, and asset management team (and some in HR who oversee that) use it for these different items. Prior to this I just used Excel for this type of data tracking so this is heads and shoulders above our previous methods.

Pros

  • Quick turnaround times
  • People can modify their data through the cloud
  • Robust and timely alert system

Cons

  • Visuals could be better presented and have more of them
  • Not a lot of training materials provided for new users
  • Support never answered in a timely manner
  • Looking up data from a different sheet was fairly difficult

Return on Investment

  • Saves tons of time when it coms to forecast and modification calculations
  • Very accurate, which has reduced the amount of rework and double checking we've had to do
  • Allowed us to have higher confidence in our models and has empowered individuals to take on related tasks/data themselves

Alternatives Considered

Tableau Desktop

Other Software Used

Tableau Server, The Okta Identity Cloud, Greenhouse

Quantrix, taking you into the future of data analysis

Pros

  • Quickly turn out modified reports with prospective sales
  • Alerts you if there are errors in your calculation/formulas
  • Allow users to have modified access through the Qloud to do their own modifications without risk of their changes impacting the main model

Cons

  • Formulas can be tough to come up with if you do not have a deep grasp of SQL
  • It is graphically challenged when a visual depiction is needed

Return on Investment

  • Capacity forecasting used to take hours to calculate with a ton of manual modifications. Quantrix has automated that so a model can be updated at any time with a click of a button
  • The accuracy of the models is incredible. It took some tweaking to add in data scubbers, but now it runs almost flawlessly
  • The confidence the management teams have in the output of the model is amazing. Before, people would question the output, have you rebuild it, and then compare. Now the report comes out and the output has high confidence.

Other Software Used

Tableau Desktop

Need a cost-effective planning, budgeting tool? Tired of inflexible solutions or error-prone spreadsheets? Here is a solution

Pros

  • Lets say you need to model your expenses over years and you have 10 products. If you use Excel you would need to create 10 tables for each product. Instead of creating separate tables of yearly expenses for each product, in Quantrix you create a 3-dimensional cube with all expenses/products/years inside. That means you do not need to repeat the same work for each product: no need for copy-paste of same data to new sheets, no need to repeat formulas. If modification required, no need to add new item to each table, simply add it once and that is it! Even better: if you add a new product, you do not even need to write any formula. Because one existing formula, written in natural language applies to the whole range of products, not to the particular cell. Your presentations, reports, dashboards and graphs are also multidimensional. Simply select dimension or item for instant visualisation.
  • Great advantage of multidimensional models is the Linked structure. You simply drag and drop existing dimensions and build a structure, which means
  • much faster modeling. If you add a new year or a new product in CF it will be added in P&L immediately , or vice versa. It helps to maintain structure across models and makes possible effective data integration.
  • Add more dimensions and actually multiply our efficiency. You can easily add more dimensions like: Regions, Services, Price Scenarios, Production Scenarios, Projects, or any other dimension relevant to your organization.
  • Quantrix Qloud is a great tool for sharing models and collaboration. Imagine dynamic reporting to your management including scenario simulations options. Access from all over the world, no need for software installation. Organize data flow by giving controlled by you access for collecting input data from your colleagues.
  • Overall result: Time-saving and cost reduction, Elimination of errors, Excellent business insight for management.

Cons

  • There is a need for more enhanced visualisation tools. Graphs, widgets, etc. should be more appealing for decision-makers
  • Would be great to have fully functional Web/Cloud version of Quantrix. Currently, Qloud is designed only for sharing and collaboration but does not let users to write formulas, actually model the data.
  • Quantrix should make more efforts to popularize its products, make its brand known, especially outside of North America.

Return on Investment

  • My client replaced 150 Excel Spreadsheets, 10 interlinked files for 60 facilities in 6 regions with only one Quantrix Multidimensional Model
  • 1 Quantrix Formula replaced about 1500 Excel Formulas
  • They reduced budgeting time from 3 months to one week
  • Quantrix training and creating a large and complex budget in only 10 days

A powerful and accessible solution to build financial planning models

Pros

  • Building complex financial planning model availing of a multidimensional data structure coupled with a powerful formula language, with the immediacy and intuitiveness typical of spreadsheets
  • Implement quickly model modifications (new products, new scenarios, new time periods) simply adding new "items" to "categories" (corresponding to dimensions in a multidimensional data model)
  • Scale up models to very large datasets with very fast computation times
  • Easily import data from text files, other Quantrix models and external databases via DataLink and DataNAV
  • Save snapshots of tables computed in Quantrix to external databases via DataPush

Cons

  • The user can develop user defined functions and automated tasks via the scripting language based on Groovy. Such functionality has room for further development both in terms of what a user can achieve, and the ease of use of the tools for script editing and debugging
  • Charting is available. Typical business charts are easily obtained from data in Quantrix matrices but configuration could be simpler and chart modifications more predictable in their effects
  • Users can designed composite views of model elements (tables, charts, text, images) via "Canvas" objects. Canvas features have greatly improved over time, but editing remains a bit complicated

Return on Investment

  • I work in a not for profit organization, so the ROI concept isn't applicable to us. However, Quantrix has allowed us to become more productive in modeling and data management activities related to research
  • The adoption of Quantrix Modeler in our classes has become a major factor of innovation and differentiation of our undergraduate programmes

Alternatives Considered

Microsoft Excel and Apple Numbers

Quantrix: What Excel Should Have Been

Pros

  • Develop robust, data intensive models with minimal (relative to competing alternatives) formulaic or coding infrastructure.
  • Handle large data sets Excel could only dream about.
  • Professional Qloud environment that only gets better and better. Deliver model output with professional design and customized canvases to deliver a truly unique experience to end users.
  • Qloud administration allows control to specific models and data within models to keep users of all different levels and access authority seeing only what they are supposed to see.
  • Quantrix support team is second to none. They go out of their way to answer questions and find solutions to even the toughest problems in a timely manner.

Cons

  • Hard to be critical of the Quantrix team as I know they strive to produce the best product possible. I suppose the next thing on my wish list would be the application of the new Solver functionality to be available in the Qloud.
  • A big help for new users would be a good book on transitioning from Excel or other environment into Quantrix. I know first hand it can be difficult to transition when having to learn the program through a help guide, forums and tech support. I had a lot of trial and error in my journey to producing the desired models. On one hand it was a valuable method as it taught me a lot of what not to do, but I will admit it was not the most efficient way to do things.
  • Would also love to see local user groups being formed at some point in the future. Quantrix puts on a fantastic conference once a year in beautiful Maine, but it is a big journey for someone in Southern California (and limited to one or two days a year). I would like to see some local chapters formed in different areas of the country so local Quantrix users can get together more often and collaborate (maybe a quarterly or semi-annual meetup?). Our Quantrix community is still relatively small and may be a difficult task for some areas, but is also the very reason why this would be great idea.

Return on Investment

  • Quantrix has boosted profitability and has proven its worth time and again. The platform has put us on the radar doing things even our biggest competitors could only dream of. We are still early in the development and deployment of our Quantrix Qloud based system to clients, but we already have early adopters coming over from competitor systems that cost exponentially more and do significantly less than what we provide. We feel it is only a matter of time for our Qloud driven analytics to become more mainstream in our space.