
Rob Bates
Public & Private Cloud Senior Engineer
Chose Amazon CloudWatch
| Product | Rating | Most Used By | Product Summary | Starting Price |
|---|---|---|---|---|
 Amazon CloudWatch | N/A | Amazon CloudWatch is a native AWS monitoring tool for AWS programs. It provides data collection and resource monitoring capabilities. | $0 per canary run | |
 SolarWinds Server & Application Monitor | N/A | SolarWinds Server & Application Monitor (SAM) delivers application and server monitoring capabilities. SAM allows for self-service for easy setup, 1200+ monitoring templates, and customization options, as well as integrate with other SolarWinds products. | N/A |
| Amazon CloudWatch | SolarWinds Server & Application Monitor | |||||||||||||||
|---|---|---|---|---|---|---|---|---|---|---|---|---|---|---|---|---|
| Editions & Modules |
| No answers on this topic | ||||||||||||||
| Offerings |
| |||||||||||||||
| Entry-level Setup Fee | No setup fee | No setup fee | ||||||||||||||
| Additional Details | With Amazon CloudWatch, there is no up-front commitment or minimum fee; you simply pay for what you use. You will be charged at the end of the month for your usage. | SAM pricing starts at $2,995. | ||||||||||||||
| More Pricing Information | ||||||||||||||||
| Amazon CloudWatch | SolarWinds Server & Application Monitor | |
|---|---|---|
| Considered Both Products | Amazon CloudWatch Rob Bates Public & Private Cloud Senior Engineer Chose Amazon CloudWatch | SolarWinds Server & Application Monitor No answer on this topic |
| Amazon CloudWatch | SolarWinds Server & Application Monitor | |||||||||||||||||||||||||||||||||||||||
|---|---|---|---|---|---|---|---|---|---|---|---|---|---|---|---|---|---|---|---|---|---|---|---|---|---|---|---|---|---|---|---|---|---|---|---|---|---|---|---|---|
| Application Performance Management |
|
| Amazon CloudWatch | SolarWinds Server & Application Monitor | |
|---|---|---|
| Small Businesses |  InfluxDB Score 8.8 out of 10 |  GitLab Score 8.8 out of 10 |
| Medium-sized Companies |  Sumo Logic Score 8.8 out of 10 |  ManageEngine Site24x7 Score 9.5 out of 10 |
| Enterprises |  NetBrain Technologies Score 9.2 out of 10 | ManageEngine Site24x7 Score 9.5 out of 10 |
| All Alternatives | View all alternatives | View all alternatives |
| Amazon CloudWatch | SolarWinds Server & Application Monitor | |
|---|---|---|
| Likelihood to Recommend | 7.7 (40 ratings) | 8.8 (278 ratings) |
| Likelihood to Renew | - (0 ratings) | 8.9 (10 ratings) |
| Usability | 7.0 (3 ratings) | 8.6 (29 ratings) |
| Availability | - (0 ratings) | 9.9 (3 ratings) |
| Performance | - (0 ratings) | 6.0 (3 ratings) |
| Support Rating | 8.4 (8 ratings) | 9.0 (21 ratings) |
| Online Training | - (0 ratings) | 4.5 (1 ratings) |
| Implementation Rating | - (0 ratings) | 4.5 (3 ratings) |
| Configurability | - (0 ratings) | 1.0 (2 ratings) |
| Ease of integration | - (0 ratings) | 4.5 (2 ratings) |
| Product Scalability | - (0 ratings) | 9.9 (3 ratings) |
| Vendor post-sale | - (0 ratings) | 4.5 (2 ratings) |
| Vendor pre-sale | - (0 ratings) | 4.5 (2 ratings) |
| Amazon CloudWatch | SolarWinds Server & Application Monitor | |
|---|---|---|
| Likelihood to Recommend | Amazon AWS
| SolarWinds
|
| Pros | Amazon AWS
 Apurv Doshi Senior Solutions Architect | SolarWinds
|
| Cons | Amazon AWS
| SolarWinds
|
| Likelihood to Renew | Amazon AWS No answers on this topic | SolarWinds
 Derek Benson IT, Network Administrator |
| Usability | Amazon AWS
| SolarWinds
|
| Reliability and Availability | Amazon AWS No answers on this topic | SolarWinds
|
| Performance | Amazon AWS No answers on this topic | SolarWinds
|
| Support Rating | Amazon AWS
 Ramindu Deshapriya Lead Consultant - Technology | SolarWinds
 Ryhlen Schoeberl System Administrator |
| Online Training | Amazon AWS No answers on this topic | SolarWinds
 Joe Parlett Programmer Analyst |
| Implementation Rating | Amazon AWS No answers on this topic | SolarWinds
|
| Alternatives Considered | Amazon AWS
| SolarWinds
|
| Scalability | Amazon AWS No answers on this topic | SolarWinds
Joe Parlett Programmer Analyst |
| Return on Investment | Amazon AWS
 Rob Domenico Senior Systems Administrator | SolarWinds
|
| ScreenShots | Amazon CloudWatch Screenshots     | SolarWinds Server & Application Monitor Screenshots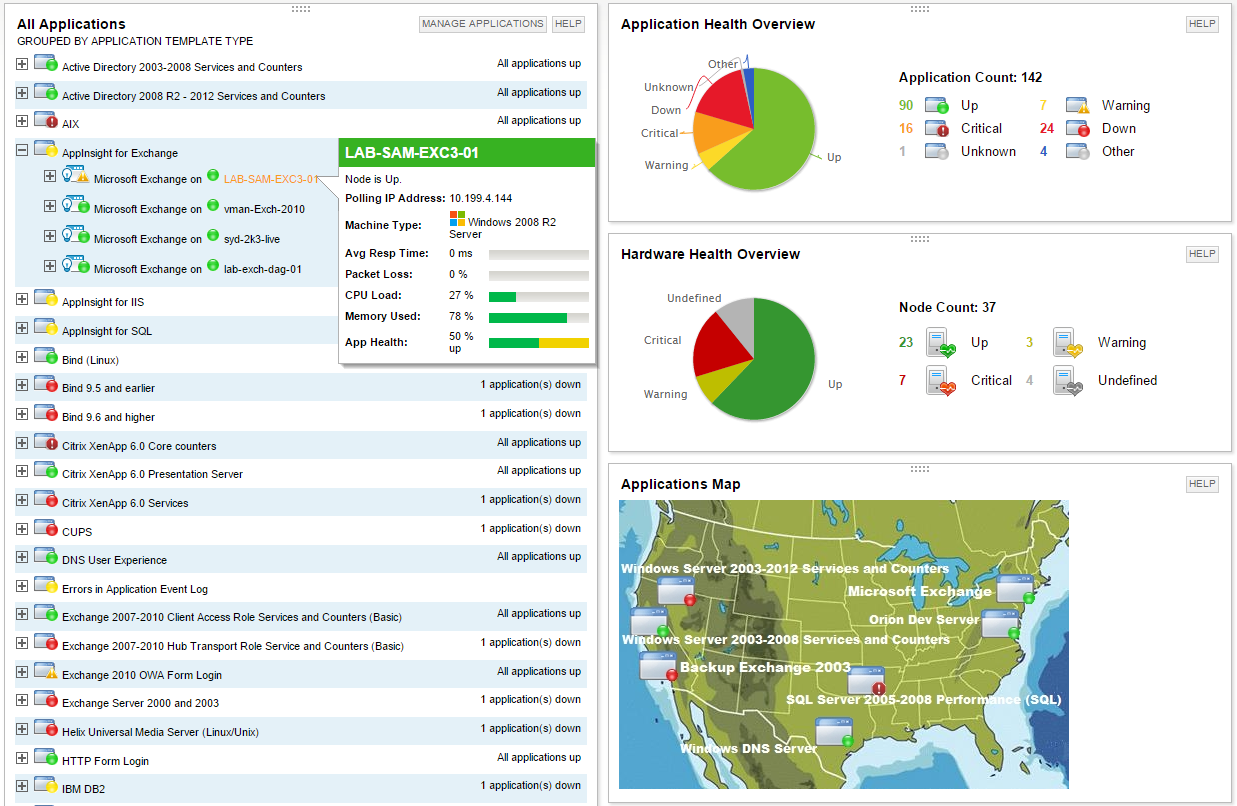      |