
Pedro Ribeiro
Web and Graphic Designer
Chose AppSheet
Engagement and support
| Product | Rating | Most Used By | Product Summary | Starting Price |
|---|---|---|---|---|
 AppSheet | N/A | Acquired by Google in Spring 2020, AppSheet is an intelligent, no-code app platform for everyone. Users can create apps to transform the workplace. Common use cases include field service, transportation, customer surveys, incident reports, field data capture, compliance reports, delivery tracking, and property surveys. Used by the Fortune 500 & Industry Leaders Customers include Clearlink, Enterprise Holdings, ESPN, Pepsi, the University of Michigan, and the State of… | $5 per user/per month | |
 Microsoft Power BI | N/A | Microsoft Power BI is a visualization and data discovery tool from Microsoft. It allows users to convert data into visuals and graphics, visually explore and analyze data, collaborate on interactive dashboards and reports, and scale across their organization with built-in governance and security. | $168 per year per user | |
 QlikView | N/A | QlikView® is Qlik®’s original BI offering designed primarily for shared business intelligence reports and data visualizations. It offers guided exploration and discovery, collaborative analytics for sharing insight, and agile development and deployment. | N/A |
| AppSheet | Microsoft Power BI | QlikView | ||||||||||||||||||||||
|---|---|---|---|---|---|---|---|---|---|---|---|---|---|---|---|---|---|---|---|---|---|---|---|---|
| Editions & Modules |
|
|
| |||||||||||||||||||||
| Offerings |
| |||||||||||||||||||||||
| Entry-level Setup Fee | No setup fee | No setup fee | Optional | |||||||||||||||||||||
| Additional Details | Personal apps and prototype are always free to build. Don't pay until you're ready to deploy. What can I do for free? Use the complete set of AppSheet features for free while building one or many app prototypes (for as long as you like). Invite up to 10 users for free to use your apps & share feedback. How do Business Subscription pricing work? Business Subscriptions enable a suite of performance & management features for organizations with cross-departmental app creators, and pricing is based on each unique requirements. Connect with the AppSheet team at solutions.appsheet.com/contact to learn more. | Power BI Desktop is the data exploration and report authoring experience for Power BI, and is available as a free download. | On an perpetual license basis, based on server plus number of users. Contact vendor for pricing. | |||||||||||||||||||||
| More Pricing Information | ||||||||||||||||||||||||
| AppSheet | Microsoft Power BI | QlikView | |
|---|---|---|---|
| Considered Multiple Products | AppSheet Pedro Ribeiro Web and Graphic Designer Chose AppSheet Engagement and support  Benjamin Sabbah Directeur général adjoint // Chief operating officer Chose AppSheet Editing is way easier on AppSheet. Plug-ability is wider. | Microsoft Power BI  Galen Mosier Analyst Chose Microsoft Power BI  Rohit Acharya Business Intelligence Manager Chose Microsoft Power BI  Guillermo Villamizar Project Manager Chose Microsoft Power BI Microsoft Power BI was a little more expensive when comparing it to the competition, but it also offers a lot more options and is more flexible as well. Also, the quality and appearance of the reports and charts was more good looking and aesthetically pleasing than the other …  Purav Vaidya Vice President, Mobile technology Chose Microsoft Power BI Microsoft BI tool does a better job than most of the other software. The reason is excellent visualizations and its capability to connect with various other software and data sources. Tableau does a better job when it comes to tutorials and being more user-friendly. Also …  Litzi Saraí Gordils Ortuño Purchasing Coordinator Chose Microsoft Power BI Power BI takes it to another level with the report and dashboard designing for a wide variety of purposes, and always gives you the option to be collaborative within their native sync features, that is also an advantage to set things up, for example, to promote reports into …  Kevin Lee Elder Associate Professor Chose Microsoft Power BI Much easier learning curve and integration with Microsoft Office gives it a leg up. People not knowing they have it, believe it or not, is limiting it's usage. Microsoft really needs to market it!  Quan Khong Practice Lead - Corporate Performance Management Chose Microsoft Power BI Power BI is a lot easier to use. The designs are also much nicer. Costs to implement Power BI (minus the existing data infrastructure) is much lower than other tools commercially available. However, the tool is still relatively new and still lacks many common features that … |  QlikView  Nestor Ramirez Strategic Technical Director Chose QlikView Qlik was less intuitive than Paxata, but less expensive than either microstrategy or PowerBI. Qlik has enough breadth to accommodate most use cases without breaking the bank. |
| AppSheet | Microsoft Power BI | QlikView | |||||||||||||||||||||||||||
|---|---|---|---|---|---|---|---|---|---|---|---|---|---|---|---|---|---|---|---|---|---|---|---|---|---|---|---|---|---|
| Low-Code Development |
| ||||||||||||||||||||||||||||
| BI Standard Reporting |
| ||||||||||||||||||||||||||||
| Ad-hoc Reporting |
| ||||||||||||||||||||||||||||
| Report Output and Scheduling |
| ||||||||||||||||||||||||||||
| Data Discovery and Visualization |
| ||||||||||||||||||||||||||||
| Access Control and Security |
| ||||||||||||||||||||||||||||
| Mobile Capabilities |
| ||||||||||||||||||||||||||||
| Application Program Interfaces (APIs) / Embedding |
|
| AppSheet | Microsoft Power BI | QlikView | |
|---|---|---|---|
| Small Businesses |  Creatio Score 9.0 out of 10 |  Yellowfin Score 8.7 out of 10 | Yellowfin Score 8.7 out of 10 |
| Medium-sized Companies |  Quixy Score 9.9 out of 10 |  Reveal Score 10.0 out of 10 | Reveal Score 10.0 out of 10 |
| Enterprises | Creatio Score 9.0 out of 10 |  Kyvos Semantic Layer Score 9.5 out of 10 | Kyvos Semantic Layer Score 9.5 out of 10 |
| All Alternatives | View all alternatives | View all alternatives | View all alternatives |
| AppSheet | Microsoft Power BI | QlikView | |
|---|---|---|---|
| Likelihood to Recommend | 9.0 (66 ratings) | 8.5 (197 ratings) | 7.7 (88 ratings) |
| Likelihood to Renew | 9.1 (3 ratings) | 9.5 (3 ratings) | 8.8 (29 ratings) |
| Usability | 7.9 (6 ratings) | 8.3 (113 ratings) | 8.0 (15 ratings) |
| Availability | - (0 ratings) | - (0 ratings) | 9.8 (4 ratings) |
| Performance | - (0 ratings) | - (0 ratings) | 8.6 (4 ratings) |
| Support Rating | 6.4 (15 ratings) | 10.0 (52 ratings) | 3.3 (15 ratings) |
| Online Training | - (0 ratings) | - (0 ratings) | 8.0 (3 ratings) |
| Implementation Rating | 9.1 (1 ratings) | 9.0 (1 ratings) | 7.4 (13 ratings) |
| Product Scalability | - (0 ratings) | - (0 ratings) | 8.9 (2 ratings) |
| AppSheet | Microsoft Power BI | QlikView | |
|---|---|---|---|
| Likelihood to Recommend | Google
 Gaston Barcia Advisor | Microsoft
| Qlik
|
| Pros | Google
 David Hopkins Quality Assurance Analyst | Microsoft
| Qlik
 Jake Tolbert Director of Development - Data Services |
| Cons | Google
| Microsoft
| Qlik
|
| Likelihood to Renew | Google
| Microsoft
 David Jensen Operations Manager, Customer Success | Qlik
 Debbie Pyykkonen, MBA Director of Business Analytics |
| Usability | Google
 Ivan Rularte Consultant | Microsoft
| Qlik
|
| Reliability and Availability | Google No answers on this topic | Microsoft No answers on this topic | Qlik
 Bill Chamberlain Partner |
| Performance | Google No answers on this topic | Microsoft No answers on this topic | Qlik
|
| Support Rating | Google
 David Dutton Owner | Microsoft
| Qlik
|
| In-Person Training | Google No answers on this topic | Microsoft No answers on this topic | Qlik
|
| Online Training | Google No answers on this topic | Microsoft No answers on this topic | Qlik
 Robert Goodman Director, Business Intelligence & Analytics |
| Implementation Rating | Google
| Microsoft
 Anuj Sant Senior buyer | Qlik
 David Worrell CFO (Chief Financial Officer) |
| Alternatives Considered | Google
 Miguel Ángel Engracia Zambrano Maintenance Supervisor | Microsoft
| Qlik
|
| Return on Investment | Google
 Ivan Marquez Consultor. | Microsoft
| Qlik
 Mark McHenry Marketing |
| ScreenShots | AppSheet Screenshots 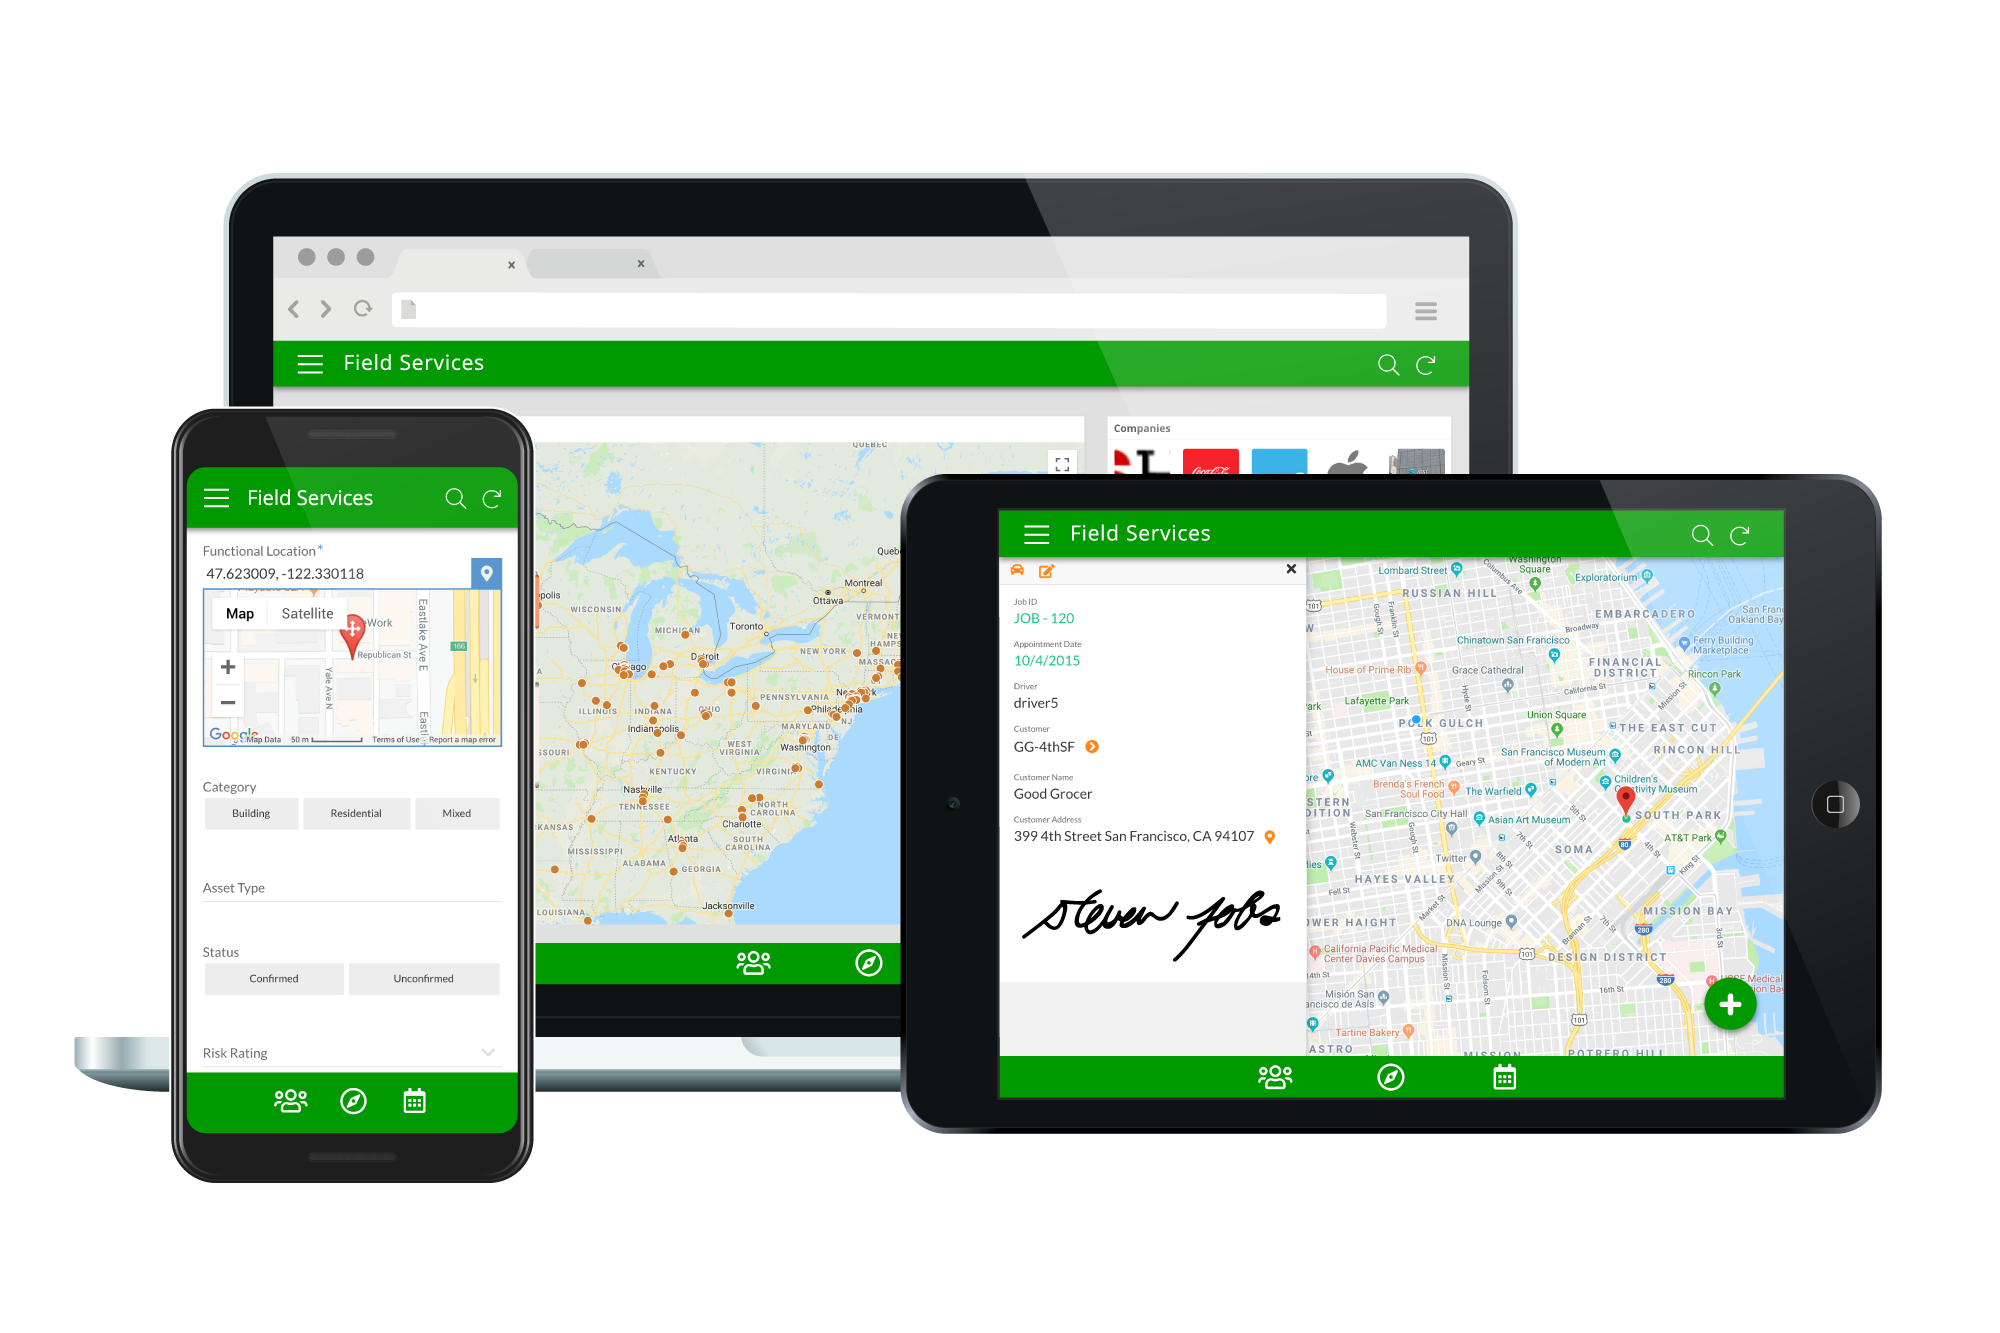   | Microsoft Power BI Screenshots      | QlikView Screenshots   |