Clear Analytics vs. Microsoft Power BI

Overview
ProductRatingMost Used ByProduct SummaryStarting Price
Clear Analytics
Score 8.8 out of 10
Enterprise companies (1,001+ employees)
Clear Analytics is a business intelligence solution that enables non technical end users to perform analytics by leveraging existing knowledge of Excel coupled with a built in query builder. Some key features include: Dynamic Data Refresh, Data Share and In-Excel Collaboration.
$29
Per Seat per Month
Microsoft Power BI
Score 8.4 out of 10
N/A
Microsoft Power BI is a visualization and data discovery tool from Microsoft. It allows users to convert data into visuals and graphics, visually explore and analyze data, collaborate on interactive dashboards and reports, and scale across their organization with built-in governance and security.
$10
per month per user
Pricing
Clear AnalyticsMicrosoft Power BI
Editions & Modules
Personal
$29
Per Seat per Month
Team
$165
upto 10 Seat per Month
Department
$265
upto 25 Seat per month
Organization
$565
Upto 100 per seat per month
No answers on this topic
Offerings
Pricing Offerings
Clear AnalyticsMicrosoft Power BI
Free Trial
YesYes
Free/Freemium Version
NoYes
Premium Consulting/Integration Services
YesNo
Entry-level Setup Fee$800 Initial OnBoardingNo setup fee
Additional DetailsCertain Enterprise level features can be made available to Small Business edition at additional cost. Such services include Scheduler and OLAP connectivity. Custom adapters can also be created to connect to SaaS services.
More Pricing Information
Community Pulse
Clear AnalyticsMicrosoft Power BI
Top Pros
Top Cons
Features
Clear AnalyticsMicrosoft Power BI
BI Standard Reporting
Comparison of BI Standard Reporting features of Product A and Product B
Clear Analytics
9.0
8 Ratings
9% above category average
Microsoft Power BI
7.2
138 Ratings
13% below category average
Pixel Perfect reports9.08 Ratings6.5118 Ratings
Customizable dashboards9.18 Ratings8.0138 Ratings
Report Formatting Templates8.78 Ratings7.2126 Ratings
Ad-hoc Reporting
Comparison of Ad-hoc Reporting features of Product A and Product B
Clear Analytics
8.9
8 Ratings
9% above category average
Microsoft Power BI
7.0
139 Ratings
15% below category average
Drill-down analysis9.28 Ratings7.2138 Ratings
Formatting capabilities8.78 Ratings6.4137 Ratings
Report sharing and collaboration8.98 Ratings7.0134 Ratings
Integration with R or other statistical packages00 Ratings7.5102 Ratings
Report Output and Scheduling
Comparison of Report Output and Scheduling features of Product A and Product B
Clear Analytics
9.0
8 Ratings
7% above category average
Microsoft Power BI
7.8
133 Ratings
7% below category average
Publish to Web9.08 Ratings8.1128 Ratings
Publish to PDF9.17 Ratings8.1121 Ratings
Report Versioning8.98 Ratings7.3101 Ratings
Report Delivery Scheduling8.87 Ratings8.7103 Ratings
Delivery to Remote Servers00 Ratings6.773 Ratings
Data Discovery and Visualization
Comparison of Data Discovery and Visualization features of Product A and Product B
Clear Analytics
9.0
8 Ratings
11% above category average
Microsoft Power BI
7.5
135 Ratings
7% below category average
Pre-built visualization formats (heatmaps, scatter plots etc.)8.98 Ratings7.5130 Ratings
Location Analytics / Geographic Visualization9.18 Ratings7.7121 Ratings
Predictive Analytics00 Ratings7.4101 Ratings
Access Control and Security
Comparison of Access Control and Security features of Product A and Product B
Clear Analytics
9.3
8 Ratings
8% above category average
Microsoft Power BI
8.2
126 Ratings
5% below category average
Multi-User Support (named login)9.48 Ratings8.2120 Ratings
Role-Based Security Model9.08 Ratings8.8102 Ratings
Multiple Access Permission Levels (Create, Read, Delete)9.48 Ratings8.4110 Ratings
Report-Level Access Control00 Ratings7.01 Ratings
Single Sign-On (SSO)00 Ratings8.694 Ratings
Mobile Capabilities
Comparison of Mobile Capabilities features of Product A and Product B
Clear Analytics
8.6
6 Ratings
8% above category average
Microsoft Power BI
7.9
117 Ratings
1% below category average
Mobile Application8.54 Ratings7.493 Ratings
Dashboard / Report / Visualization Interactivity on Mobile8.76 Ratings7.4112 Ratings
Responsive Design for Web Access00 Ratings8.0111 Ratings
Application Program Interfaces (APIs) / Embedding
Comparison of Application Program Interfaces (APIs) / Embedding features of Product A and Product B
Clear Analytics
-
Ratings
Microsoft Power BI
8.4
80 Ratings
6% above category average
REST API00 Ratings8.172 Ratings
Javascript API00 Ratings9.656 Ratings
iFrames00 Ratings8.055 Ratings
Java API00 Ratings7.946 Ratings
Themeable User Interface (UI)00 Ratings8.263 Ratings
Customizable Platform (Open Source)00 Ratings8.444 Ratings
Best Alternatives
Clear AnalyticsMicrosoft Power BI
Small Businesses
BrightGauge
BrightGauge
Score 8.9 out of 10
BrightGauge
BrightGauge
Score 8.9 out of 10
Medium-sized Companies
Reveal
Reveal
Score 9.9 out of 10
Reveal
Reveal
Score 9.9 out of 10
Enterprises
Jaspersoft Community Edition
Score 9.7 out of 10
Jaspersoft Community Edition
Score 9.7 out of 10
All AlternativesView all alternativesView all alternatives
User Ratings
Clear AnalyticsMicrosoft Power BI
Likelihood to Recommend
9.0
(8 ratings)
7.9
(140 ratings)
Likelihood to Renew
-
(0 ratings)
10.0
(1 ratings)
Usability
9.1
(8 ratings)
9.0
(56 ratings)
Support Rating
9.5
(8 ratings)
7.9
(52 ratings)
User Testimonials
Clear AnalyticsMicrosoft Power BI
Likelihood to Recommend
Clear Analytics
Clear Analytics has almost all the features which are mostly required by the organizations for their data analytics and transformation activities. Clear Analytics is built on the support of a parallel query engine which makes it handle large volume requests and also provides optimized results. However, every solution has some limitations, Clear Analytics lacks advanced features such as Predictive Analytics which is a very demanding feature in the market as most organizations are adopting AI/ML automation for their businesses. Also, it needs to add a lot of advanced visualizations so that the user has the choice of selection. Overall a good solution to be recommended.
Read full review
Microsoft
In operations we use the tool for many different topics, from factory quality systems to high level reviews. We have created kind of an internal "App Store" based on Power BI where you have a lot of different dashboards for different solutions (cost, cash, health and safety, sales, factories, distribution centers...) and you as an user just need to get in that "App Store" and enter in whatever tool can be useful for you. It is open to all the operations employees and can use on demand. Also it has raised the imagination of our colleagues, as they are not only working by themselves creating new reports, but also raising fantastic ideas that can be extended for the usage of all the community.
Read full review
Pros
Clear Analytics
  • Quick management of the data through Excel thanks to the tools Clear Analytics provides such as filtering different information for an easier view.
  • Ability to add new KPIs to measure different areas of our business.
  • Drag and drop tool which makes an easier usage of Excel.
  • Cost-effective. I find Clear Analytics to be affordable considering the number of features added and the unlimited sharing and editing it provides.
Read full review
Microsoft
  • Quickly filter and view granular data sets with easily configurable reporting figures.
  • The ability to quickly switch between tabs allows for historical data comparisons and progress tracking.
  • It's helpful to dive into the data and break it down from high levels to small.
  • Achieve actionable insights faster by using real-time data. It's incredible to have online access to reports.
Read full review
Cons
Clear Analytics
  • For Charts and Graphs , getting the Power Point Deck would be helpful. As of now we use the data from Excel Reports
Read full review
Microsoft
  • The desktop app is great but needs a lot of performance improvements
  • No MacOS Version for the Desktop app, this is a big limitation for business since executives prefer Macs
  • Premium Cloud Version of Power BI is awfully expensive
  • On-Premise Version of the Power BI Reports Server is bundled only with SQL Server Enterprise License and cannot be purchased separately and requires Software Assurance Subscription
  • On-Premise Power BI Report Server doesn't support ADFS, AzureAD or any Claims-Based authentication platform, a sad disadvantage for enterprises
Read full review
Likelihood to Renew
Clear Analytics
No answers on this topic
Microsoft
I find it helpful and easy to use
Read full review
Usability
Clear Analytics
I have really enjoyed working with Clear Analytics. This platform has contributed to increased production and reliable data control processes. It has flexible user interface that can be operated by any organization member. Reports are shared on simple and transparent way in the dashboard for easy access. Data analytics from all departments have created manageable working environment that have increased production.
Read full review
Microsoft
At this point, I think we all know who has taken the lead in the business intelligence and analytics market worldwide. With fresh new updates every other day on top of an already robustly built product with all features that one can dream of is a no brainer, I feel. Microsoft will invariably be synonymous with quality and professionalism.
Read full review
Support Rating
Clear Analytics
I have had multiple scenarios where I had to reach out to the support team of Clear Analytics, be it access-related, general queries, during initial implementation, etc. My overall experience has always been good. I got the needed support every time without any delay. I can definitely recommend Clear Analytics simply on the basis of its excellent support team.
Read full review
Microsoft
I can't really speak to the support overall, [but] I will say that in the almost three years I have used the system, I have only needed to contact their support team once. I think the team was helpful, but it did take some time for us to resolve the issues/ request that they had. I guess the good news is that the system is pretty stable, and I personally have rarely needed to contact their technical support team.
Read full review
Alternatives Considered
Clear Analytics
There are other great tools that are out there but Clear Analytics is reasonable for our business and provides a lot of features that we specifically needed
Read full review
Microsoft
[Microsoft] Power BI is practical and effective, like a hammer for a nail, it is easy to use and produces very quickly the results that in most cases are urgently required by clients (nice reports to share on the web). To start using [Microsoft] Power BI you need a business email address, with that you create an account in Power BI Service and in less than 1 hour you will have installed Power BI Desktop, a report will have been created and it will have been published on the web .
Read full review
Return on Investment
Clear Analytics
  • Super useful to get started immediately
  • Didn't have to rely on migrating data
  • Easy to add members
  • Easy to learn and build charts
Read full review
Microsoft
  • It helps us track and achieve company goals.
  • It shows us [our] performance in areas we could not previously track and allows us to see and work on how to improve their performance.
  • Quick easy access for executives to use in helping teams and addressing issues.
Read full review
ScreenShots

Clear Analytics Screenshots

Screenshot of Clear Analytics integrated Excel panel essentially transforms standalone Excel into an enterprise strength, fully auditable, collaborative and centralized business intelligence platform.Screenshot of Users have the ability to dynamically query systems and render that data in any way they like.  No more waiting on IT to create reports.Screenshot of Your firms existing knowledge of Excel enables the firm to be product from day 1. Use the skills already present in your organization and don't pay for outside reporting consultants to create reports for you.Screenshot of Leverage the integration capability of Microsoft's Power BI to extend the reach of your data to web and mobile devices.Screenshot of Leverage all of Excels capabilities, from it's slicers to miniature spark-line charts to create incredibly informative and responsive dashboards.

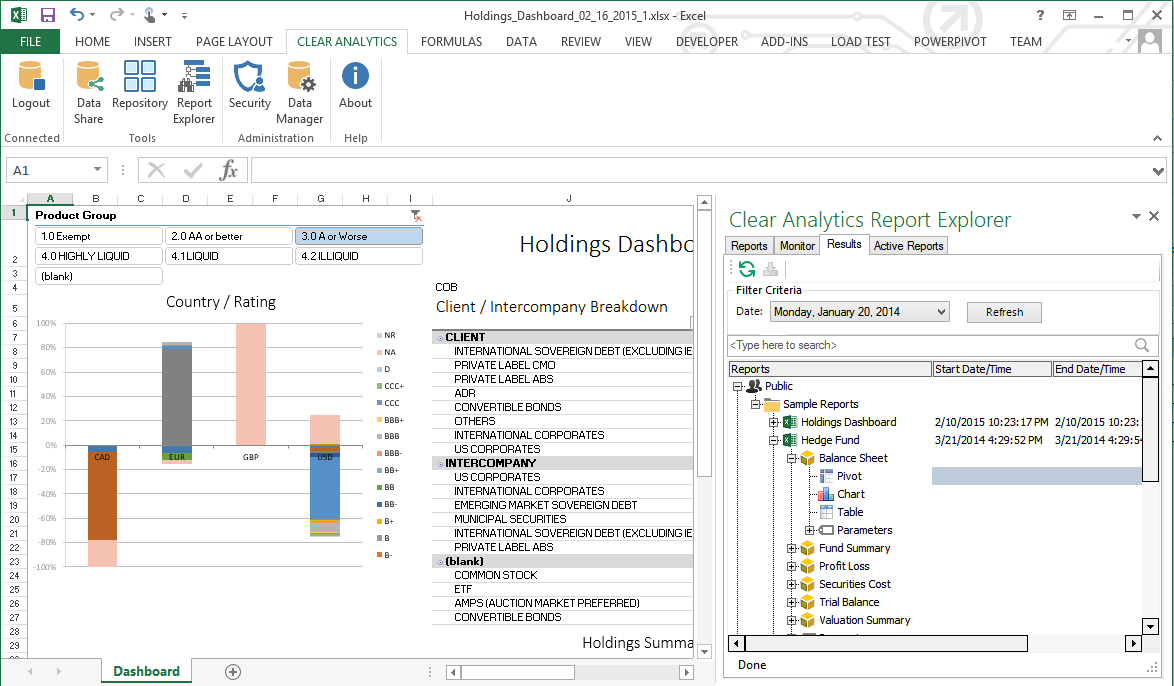
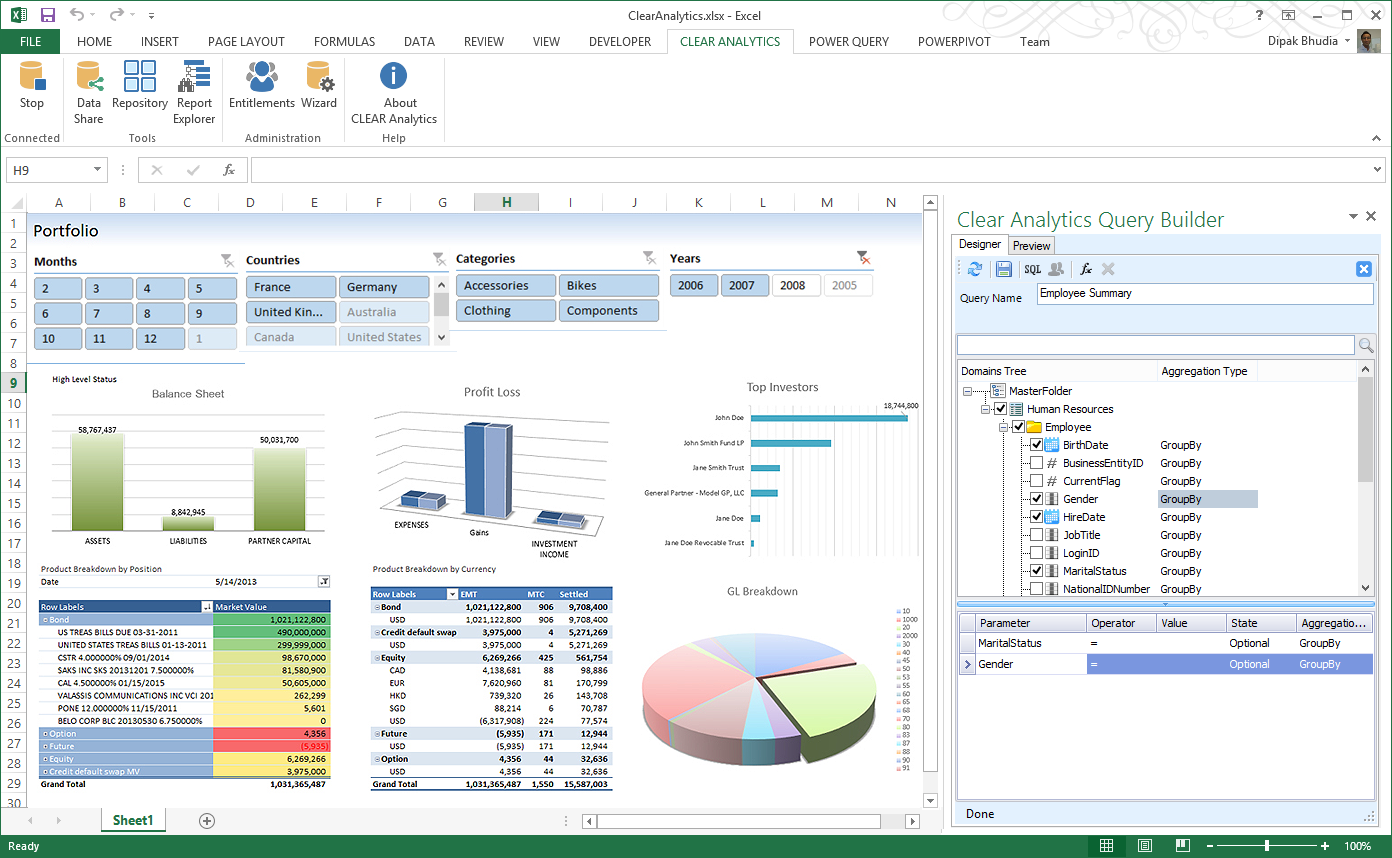
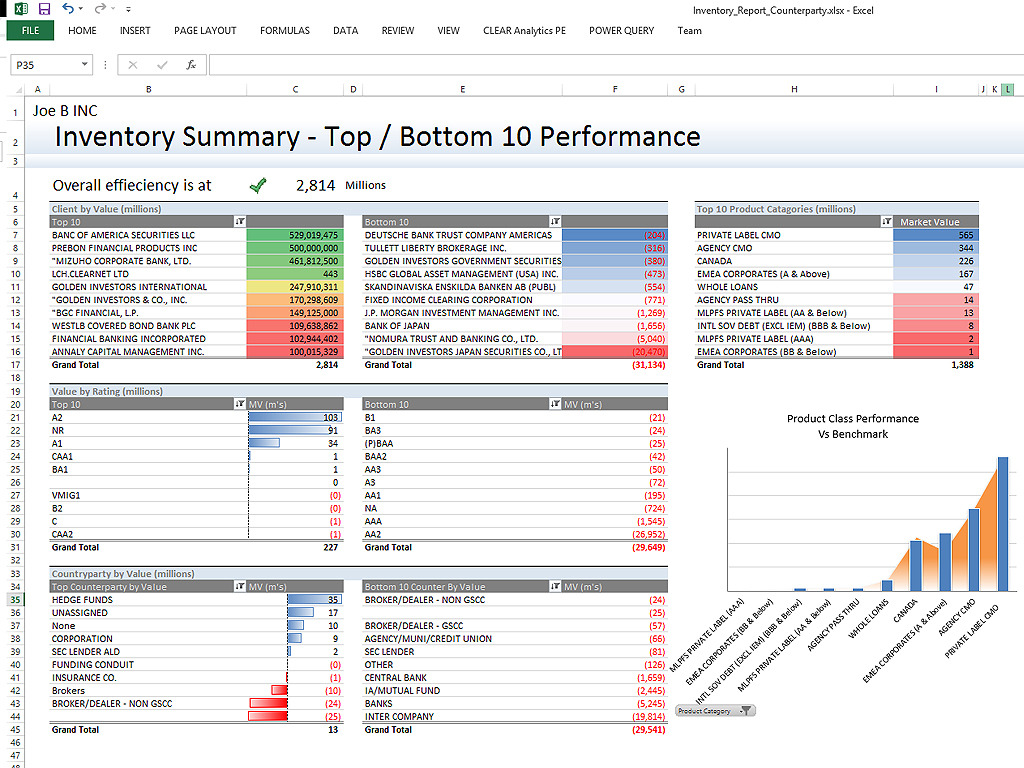
Microsoft Power BI Screenshots

Screenshot of Microsoft Power BI - Turns insights into impact for business usersScreenshot of Power BI integrates easily with Microsoft 365Screenshot of Microsoft Power BI - AI-Powered CapabilitiesScreenshot of Microsoft Power BI - Copilot can be used to create reportsScreenshot of Microsoft Power BI - Data HubScreenshot of Microsoft Power BI - Scales as organizational needs grow