Coralogix headquartered in San Francisco aims to help software companies avoid getting lost in their log data by automatically figuring out their production problems. All plans support all Coralogix features and it is available free (up to 1GB of log data), with pricing tiers available based on volume of log data and log retention time, as well as via an enterprise pricing plan.
N/A
Splunk Observability Cloud
Score8.5 out of 10
N/A
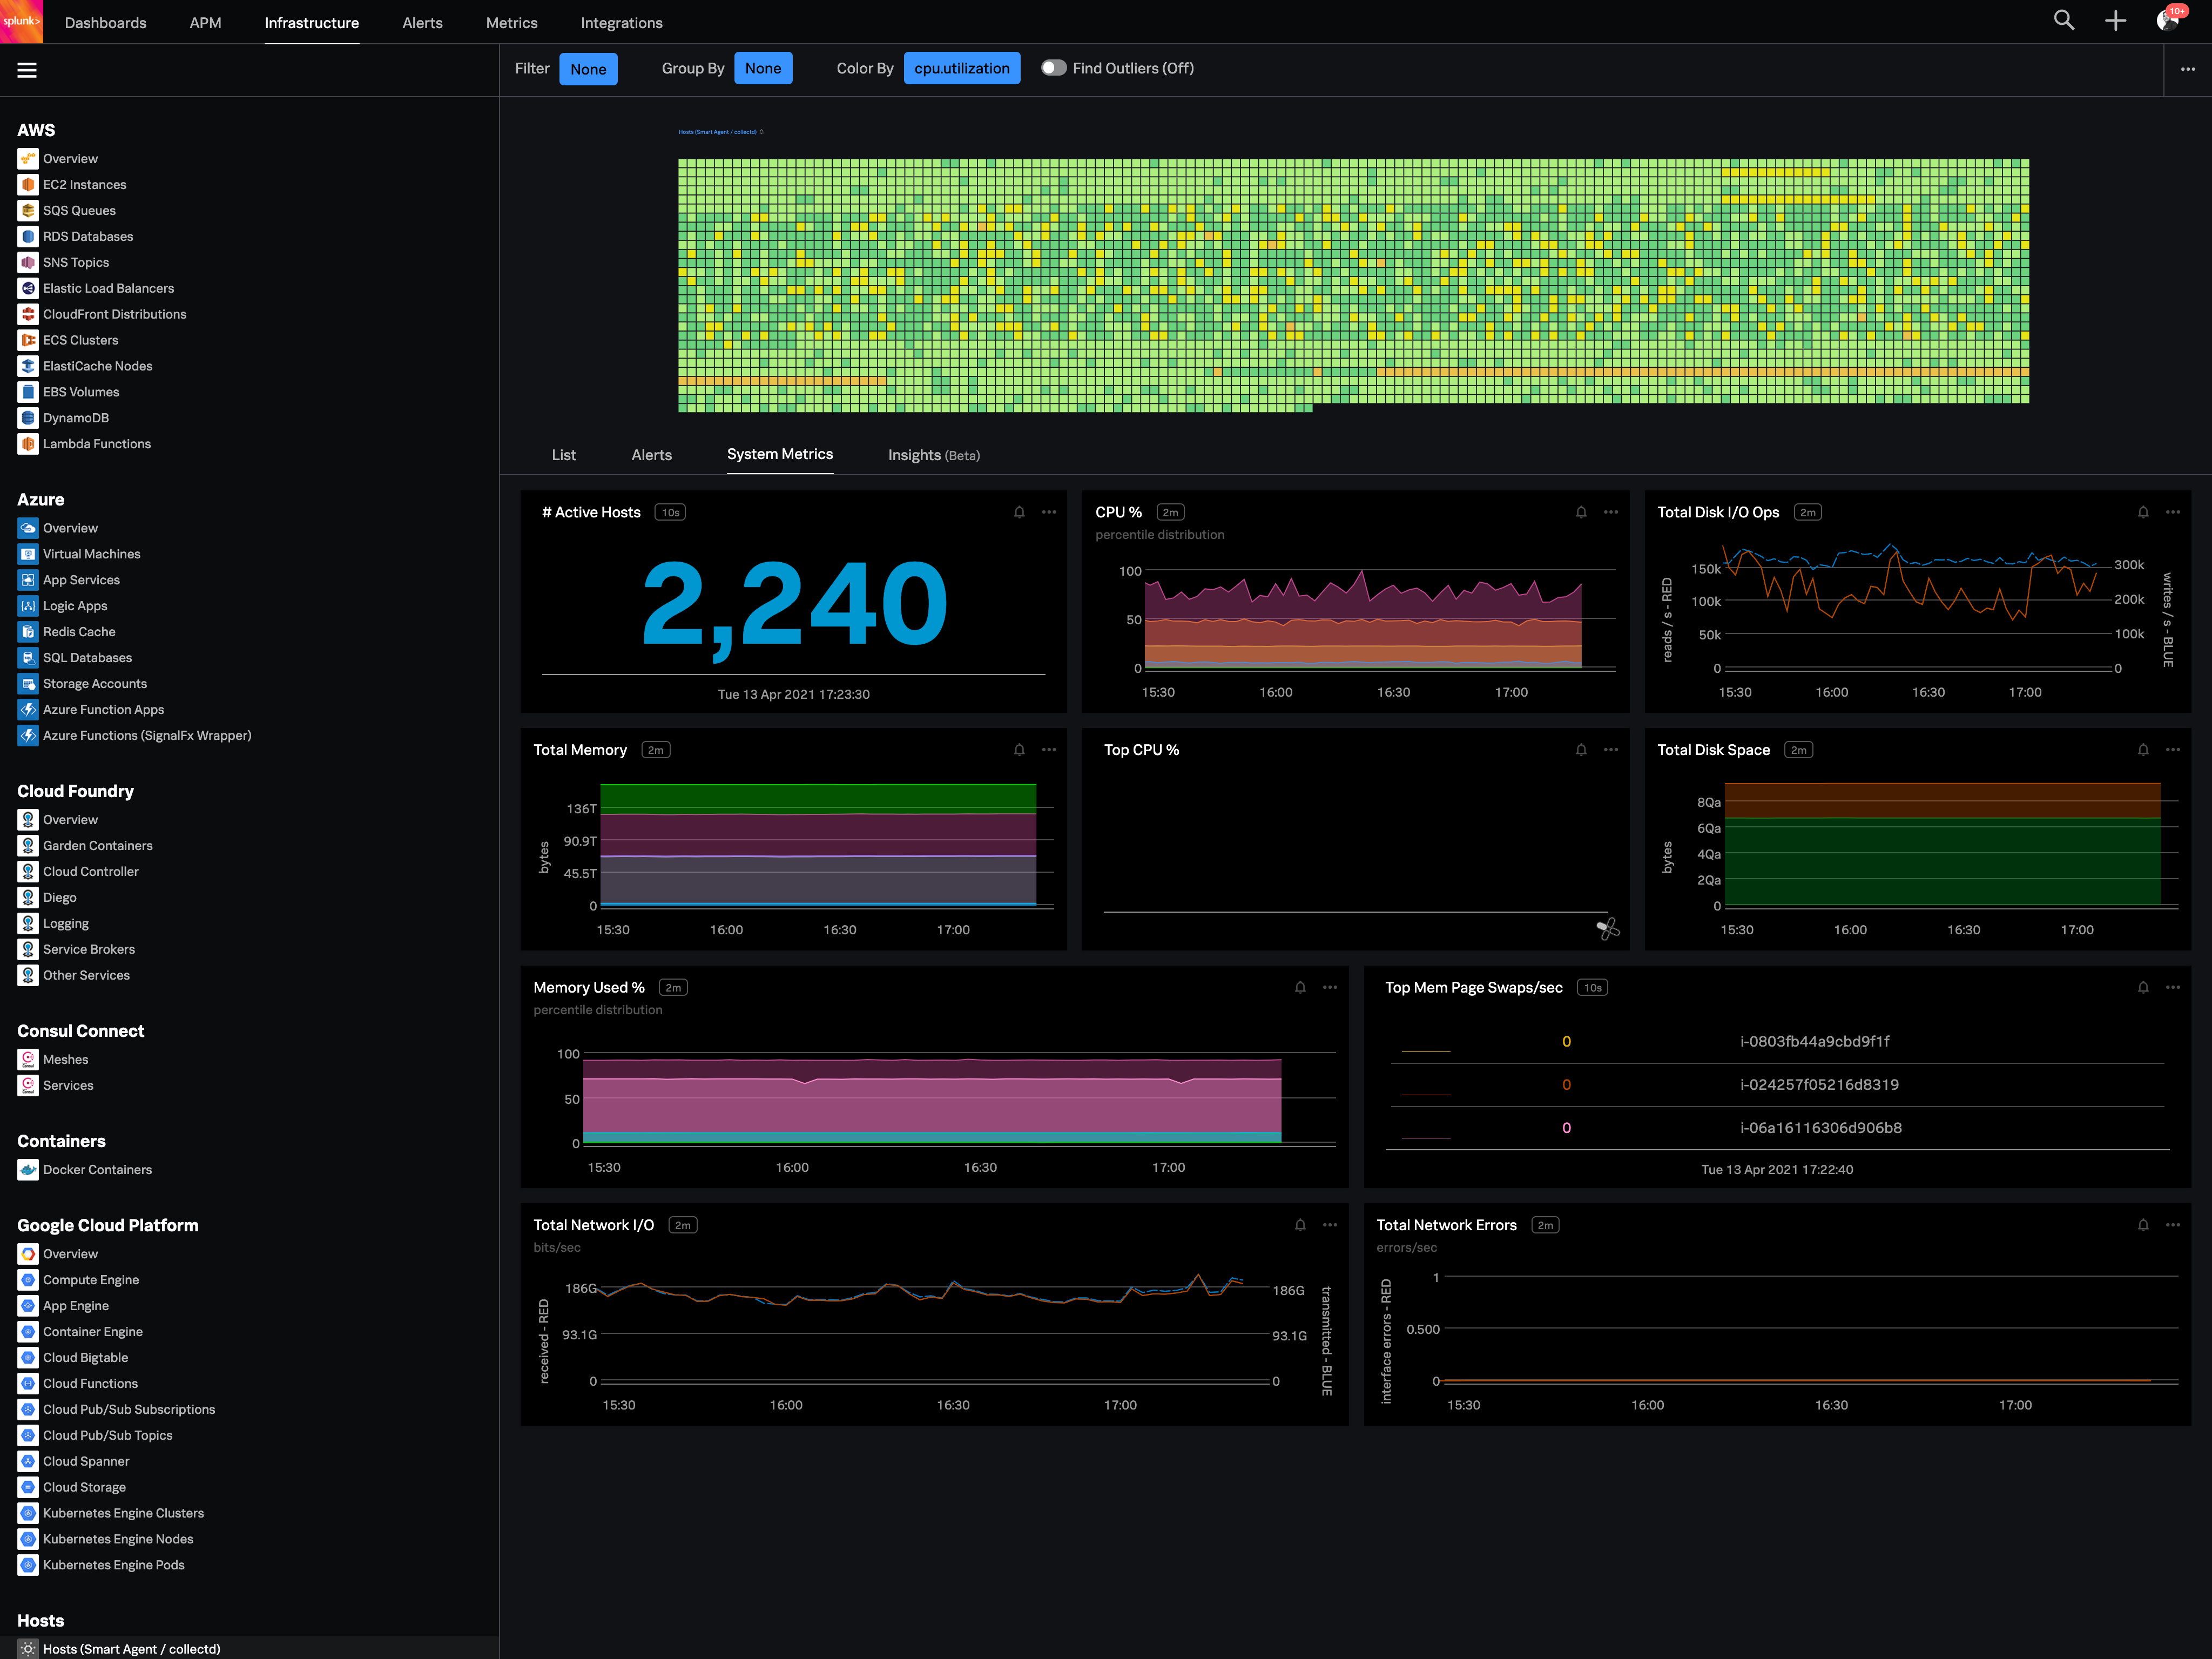
Splunk Observability Cloud aims to enable operational agility and better customer experience through real-time AI-driven streaming analytics allowing accurate alerts in seconds. It is designed to shorten MTTD and MTTR by providing real-time visibility into cloud infrastructure and services.
Most Appropriate: Searching for logs, setting alerts on anomalies, multiple container for logs separated by multiple services. Classification of different types of logs. Tracing of requests involving multiple services. Finding the time between different endpoints in the service layer to identify the choke points. Less Appropriate: Duplication of logs can cause an issue for you.
A de minimis incentive was given to thank the reviewer for their time. The incentive was not used to bias or drive a particular response, nor was the incentive contingent on a positive endorsement. More Info
Its great if you need real-time visibility across complex or regulated environments. Also strong for hybrid or multi-cloud setups where uptime, observability and fast IR are required. It’s probably overkill for smaller teams or environments that don’t have constant changes or compliance reporting needs. It's expensive and has a steep learning curve. Also, in my opinion, do not get yourself into a consumption based model. Costs can certainly get out of control quickly.
A de minimis incentive was given to thank the reviewer for their time. The incentive was not used to bias or drive a particular response, nor was the incentive contingent on a positive endorsement. TR verified that a representative sample of customers was invited. More Info
A de minimis incentive was given to thank the reviewer for their time. The incentive was not used to bias or drive a particular response, nor was the incentive contingent on a positive endorsement. More Info
The first one is its Kubernetes container monitoring.
I really like this features because as we know how much K8s is vast and to manually monitor each part of the Kubernetes it takes so much time but Splunk Observability Cloud makes it easier. And even once we integrate K8s with Splunk Observability Cloud it gives us some prebuilt dashboards which gives holistic view of our Cluster and its nodes, pods, etc.
The dashbaord feature of Splunk Observability Cloud, it gives us full flexibility to customize our dashboard with a wide range of predefined chart types.
Now it also supports OTEL, which is a plus point for observability. As now everyone is moving towards Otel and in current market there are only few tools who supports OTEL based integrations, Splunk Observability Cloud is one out of them.
A de minimis incentive was given to thank the reviewer for their time. The incentive was not used to bias or drive a particular response, nor was the incentive contingent on a positive endorsement. TR verified that a representative sample of customers was invited. More Info
A de minimis incentive was given to thank the reviewer for their time. The incentive was not used to bias or drive a particular response, nor was the incentive contingent on a positive endorsement. More Info
You can use table-like functionality to generate dashboards, but these queries are heavy on the system.
It could be easier to give insight into what type of line parsing is used for specific documents in a company-managed environment and/or show ways to gain the insights needed.
I would like to see ways to anonymize specific data for shared reports without pre-formatting this in a dashboard on which reports could be based.
A de minimis incentive was given to thank the reviewer for their time. The incentive was not used to bias or drive a particular response, nor was the incentive contingent on a positive endorsement. More Info
Good: Stable system with low error rate Easy to use for simple use cases Bad: UI is not very clear for complex usage Mobile view (when logged in from phone) is bad No library for .net
A de minimis incentive was given to thank the reviewer for their time. The incentive was not used to bias or drive a particular response, nor was the incentive contingent on a positive endorsement. More Info
The product is easy to use and integrate. The customer support is at a level of its own. There was never a time we needed help with something, and the support wasn't there to provide all the help needed in a very effective and efficient way. Being proactive, suggesting ways to solve and not just answering questions, and providing more knowledge about how the product should be used.
A de minimis incentive was given to thank the reviewer for their time. The incentive was not used to bias or drive a particular response, nor was the incentive contingent on a positive endorsement. More Info
When there is an issue, it’s a win if one can easily identify the root cause. To do the same, it should allow the user to dig deep with multiple data points and compare the data and identify the anomaly. In this use case, it’s good to drive from Splunk 011y.
A de minimis incentive was given to thank the reviewer for their time. The incentive was not used to bias or drive a particular response, nor was the incentive contingent on a positive endorsement. More Info
A de minimis incentive was given to thank the reviewer for their time. The incentive was not used to bias or drive a particular response, nor was the incentive contingent on a positive endorsement. More Info
A de minimis incentive was given to thank the reviewer for their time. The incentive was not used to bias or drive a particular response, nor was the incentive contingent on a positive endorsement. More Info
Think of Coralogix as a proactive teammate rather than just a passive tool. Unlike Datadog or New Relic, where you often pay a steep "tax" to index noise just to catch one error, Coralogix analyzes logs in-stream—saving you from surprise bills when containers get noisy. Its automatic clustering spots hidden issues without you writing endless rules, giving you instant clarity where others force you to dig.
A de minimis incentive was given to thank the reviewer for their time. The incentive was not used to bias or drive a particular response, nor was the incentive contingent on a positive endorsement. More Info
Splunk Infrastructure Monitoring provides far superior options for anybody using a complex hybrid multi-cloud environment and allows both your SOC and NOC to work together on the same data while driving their own insights. We found other products are still in the old world view of servers and agents residing together within a single data centre, but modern apps are no longer like this.
A de minimis incentive was given to thank the reviewer for their time. The incentive was not used to bias or drive a particular response, nor was the incentive contingent on a positive endorsement. More Info
A de minimis incentive was given to thank the reviewer for their time. The incentive was not used to bias or drive a particular response, nor was the incentive contingent on a positive endorsement. More Info
A de minimis incentive was given to thank the reviewer for their time. The incentive was not used to bias or drive a particular response, nor was the incentive contingent on a positive endorsement. More Info