Datadog is a monitoring service for IT, Dev and Ops teams who write and run applications at scale, and want to turn the massive amounts of data produced by their apps, tools and services into actionable insight.
$18
per month per host
Entuity
Score 8.9 out of 10
N/A
The Entuity network monitoring tool from Park Place Technologies (acquired 2019) automates network discovery and uses workflows that enable users to see when something has gone wrong. Responsive dashboards allow users to take a high-level view to gauge network health or drill down to the component level to fix network problems.
N/A
SolarWinds Engineer's Toolset
Score 7.9 out of 10
N/A
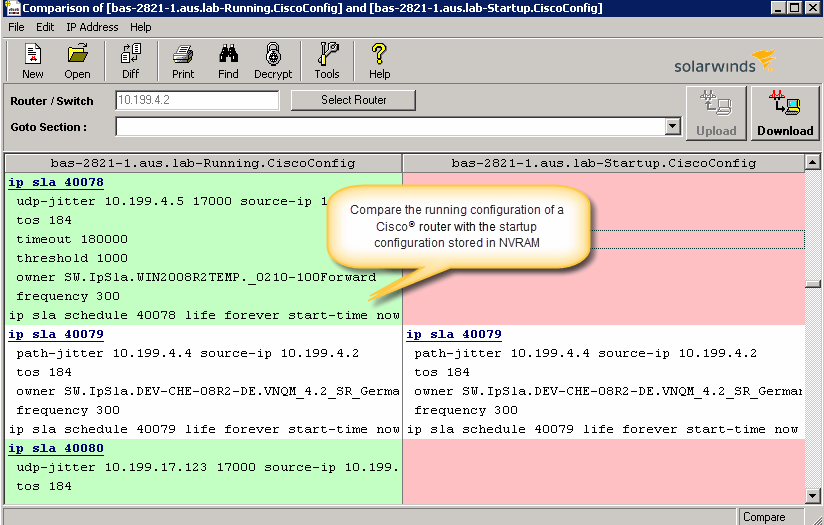
SolarWinds® Engineer’s Toolset (ETS) helps users monitor and troubleshoot a network with over 60 tools for network management. ETS allows users to monitor and receive alerts in real time on network availability and health, and perform network diagnostics for faster troubleshooting and resolution of complex
network issues. With ETS users can deploy an array of network discovery tools including Port Scanner, Switch Port Mapper or advanced Subnet Calculator, manage Cisco®
devices with specialized…
$1,585
Per Instance
Pricing
Datadog
Entuity
SolarWinds Engineer's Toolset
Editions & Modules
Log Management
$1.27
per month (billed annually) per host
Infrastructure
$15.00
per month (billed annually) per host
Standard
$18
per month per host
Enterprise
$27
per month per host
DevSecOps Pro
$27
per month per host
APM
$31.00
per month (billed annually) per host
DevSecOps Enterprise
$41
per month per host
No answers on this topic
One Time Price
$1,585
Per Instance
Offerings
Pricing Offerings
Datadog
Entuity
SolarWinds Engineer's Toolset
Free Trial
Yes
No
Yes
Free/Freemium Version
Yes
No
No
Premium Consulting/Integration Services
No
No
No
Entry-level Setup Fee
Optional
No setup fee
No setup fee
Additional Details
Discount available for annual pricing. Multi-Year/Volume discounts available (500+ hosts/mo).
Datadog may be better suited for teams that have a more out-of-the-box infrastructure, on the primary platforms Datadog supports. You may also have better results if you have a bigger team dedicated to devops and/or a bigger budget. We found that trying to adapt it to our use case (small team, .NET on AWS Fargate) wasn't feasible. We continually ran into roadblocks that required us to dig through documentation (and at times, having to figure out some documentation was wrong), go back and forth with support, and in my opinion, waste money on excessive and unintended usages due to opaque pricing models and inaccurate usage reports, as well as broken/non-functional rate sampling controls.
I think that if your organization is network-oriented (such as telecom or ISP) deploying Entuity should be considered a mandatory step. Big organizations will benefit from the ITSM (ticketing, monitoring and CMDB) integrations.
However, if your goal is to ensure that the server layer is monitored in great level (process and service monitoring, log parsing etc.) then Entuity will not suit your needs.
I have found the toolset especially useful for scanning subnets to discover devices, and for setting up temporary real-time monitors when we are troubleshooting or setting up new connections. The most useful aspect has been the ability to apply the tools to help troubleshoot and pinpoint intermittent issues. More general tools like Orion often do not have the granularity to detect issues like intermittent packet loss which are especially impactful to applications like Voice. The toolset gives us another level of capability to dig into issues.
The thing which Datadog does really well, one of them are its broad range of services integrations and features which makes it one step observability solution for all. We can monitor all types of our application, infrastructure, hosts, databases etc with Datadog.
Its custom dashboard feature which helps us to visualize the data in a better way . It supports different types of charts through those charts we can create our dashboard more attractive.
Its AI powered alerting capability though that we can easily identify the root cause and also it has a low noise alerting capability which means it correlated the similar type of issues.
Alert windows cause lag in notifications (e.g. if the alert window is X errors in 1 hour, we won't get alerted until the end of the 1 hour range)
I would appreciate more supportive examples for how to filter and view metrics in the explorer
I would like a more clear interface for metrics that are missing in a time frame, rather than only showing tags/etc. for metrics that were collected within the currently viewed time frame
The unifying component that is intended to be the initial interface to the tools seems clunky. I prefer to start the tools individually rather than using it.
The port scanner could use some improvements to make it easier to use.
There are so many features that it can be hard to figure out where you need to go for your own use case. For example, RUM monitoring us buried in a "Digital Experience" sidebar setting when this is one of our key use cases that I sometimes struggle to find in the application. It appears that ECS + Fargate monitoring was recently released which is great because we had to build a lambda reporting solution for ephemeral task monitoring. But this new feature was never on my radar until I starting clicking around the application.
The support team usually gets it right. We did have a rather complicate issue setting up monitoring on a domain controller. However, they are usually responsive and helpful over chat. The downside would be I don’t think they have any phone support. If that is important to you this might not be a good fit.
Entuity support has always been quick to respond and the majority of the calls I had were resolved on the first call. In addition, the product documentation is easy to read and goes into great detail of how the product works. This is probably a reason why a support call is literally the last call for Entuity (no pun intended).
Our logs are very important, and Datadog manages them exceptionally well. We frequently use Datadog services for our investigations. Use case: Monitor your apps, infrastructure, APIs, and user experience.
Key features:
Logs, metrics, and APM (Application Performance Monitoring)
Real-time alerting and dashboards
Supports Kubernetes, AWS, GCP, and other integrations
RUM (Real User Monitoring) and Synthetics
✅ Best for backend, server, and distributed systems monitoring.
The list above shows you some of the products that Entuity replaces.
The good product and excellent support behind it make it a better choice from the admin's and EA's perspective. My customers have praised the short learning curve and the swift and professional support staff. From my own experience I can tell that this product is delivered with one of the finest sets of documentation I have ever seen.
I haven't compared any tools similar to SolarWinds Engineer's Toolset. This might be because I'm pretty biased when it comes to monitoring, and reporting solutions. I've found that SolarWinds provides the biggest bang for the buck in my opinion. I'm sure there are other solutions on the market that compete, but I haven't tried any of them because I've been very satisfied with SolarWinds.