Datadog is a monitoring service for IT, Dev and Ops teams who write and run applications at scale, and want to turn the massive amounts of data produced by their apps, tools and services into actionable insight.
$18
per month per host
ManageEngine ADAudit Plus
Score 9.0 out of 10
N/A
ADAudit Plus offers real-time monitoring,
user and entity behaviour analytics, and change audit reports that helps users keep AD and IT infrastructure secure and compliant. Track all changes to Windows AD objects including users, groups,
computers, GPOs, and OUs. Achieve hybrid AD monitoring with a single, correlated view of all
the activities happening across both on-premises AD and Azure AD. Monitor every user's logon and logoff activity, including…
$595
per year
Pricing
Datadog
ManageEngine ADAudit Plus
Editions & Modules
Log Management
$1.27
per month (billed annually) per host
Infrastructure
$15.00
per month (billed annually) per host
Standard
$18
per month per host
Enterprise
$27
per month per host
DevSecOps Pro
$27
per month per host
APM
$31.00
per month (billed annually) per host
DevSecOps Enterprise
$41
per month per host
Standard
$595
per year
Professional
$945
per year
Offerings
Pricing Offerings
Datadog
ManageEngine ADAudit Plus
Free Trial
Yes
Yes
Free/Freemium Version
Yes
No
Premium Consulting/Integration Services
No
No
Entry-level Setup Fee
Optional
No setup fee
Additional Details
Discount available for annual pricing. Multi-Year/Volume discounts available (500+ hosts/mo).
Pricing is dependent on the number of domain controllers and starts at $595/year for the Standard edition, and $945/year for the Professional edition.
Datadog may be better suited for teams that have a more out-of-the-box infrastructure, on the primary platforms Datadog supports. You may also have better results if you have a bigger team dedicated to devops and/or a bigger budget. We found that trying to adapt it to our use case (small team, .NET on AWS Fargate) wasn't feasible. We continually ran into roadblocks that required us to dig through documentation (and at times, having to figure out some documentation was wrong), go back and forth with support, and in my opinion, waste money on excessive and unintended usages due to opaque pricing models and inaccurate usage reports, as well as broken/non-functional rate sampling controls.
ManageEngine is mostly a "check the box" solution for SIEM systems. We needed something that satisfied our customer and was cost-effective. I would highly rate the system on "worth what paid for". Support is eager to please and prompt. My only issue is that it's mostly based outside the US with helpful, but non-native speakers so it's hard to understand them. I wish they would spring for better help "phone lines" so I'm not dealing with difficult to understand and unclear speakers.
The thing which Datadog does really well, one of them are its broad range of services integrations and features which makes it one step observability solution for all. We can monitor all types of our application, infrastructure, hosts, databases etc with Datadog.
Its custom dashboard feature which helps us to visualize the data in a better way . It supports different types of charts through those charts we can create our dashboard more attractive.
Its AI powered alerting capability though that we can easily identify the root cause and also it has a low noise alerting capability which means it correlated the similar type of issues.
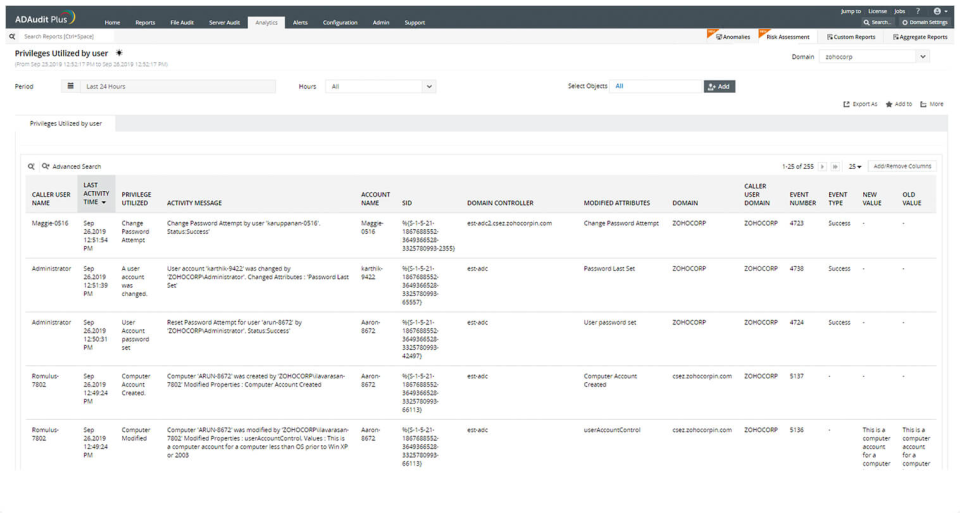
ManageEngine ADAudit Plus changes for user and group management can be looked up in builtin reports
You can build your own reports based on almost every logic you can think of
You have the ability to create alerts based on logic and filters and sendout custom alerts to email, SMS or other means.
First you need to understand the basics of the software, after that the software itself is very helpfull in configuring specific items.
I really love the support that ManageEngine is giving the customer, for all questions I use the chat on their website. This is for me the best remote support I ever saw, and I saw a lot in my 20 years of experience in IT.
Alert windows cause lag in notifications (e.g. if the alert window is X errors in 1 hour, we won't get alerted until the end of the 1 hour range)
I would appreciate more supportive examples for how to filter and view metrics in the explorer
I would like a more clear interface for metrics that are missing in a time frame, rather than only showing tags/etc. for metrics that were collected within the currently viewed time frame
In earlier releases there were quite a few bugs and performance issues. These have since been resolved.
When integrated with the Log360 Suite, it can be confusing on whether EventLog Analyzer or ADAudit Plus are "managing"/"Ingesting" the data from a given endpoint.
It works great for everything we need and use. Any issues in the software are pretty easy to resolve with tech support. And they are very responsive to resolving issues. Even ones where a fix/patch are required. At present, the software does everything we need it to for compliance, audit, and account review.
There are so many features that it can be hard to figure out where you need to go for your own use case. For example, RUM monitoring us buried in a "Digital Experience" sidebar setting when this is one of our key use cases that I sometimes struggle to find in the application. It appears that ECS + Fargate monitoring was recently released which is great because we had to build a lambda reporting solution for ephemeral task monitoring. But this new feature was never on my radar until I starting clicking around the application.
ADAudit with its cloud and on prem install option allows any organization to get in on AD report management. Whether you need to report internally only for for external audit controls its a great tool with flexibility to handle most any user or group report capability. Since this also includes m365 integration it enables IT pros to administer usage, license, cost control and permission access to most anything in Microsoft's portfolio. Its a great tool all around for AD integrated access needs.
The support team usually gets it right. We did have a rather complicate issue setting up monitoring on a domain controller. However, they are usually responsive and helpful over chat. The downside would be I don’t think they have any phone support. If that is important to you this might not be a good fit.
The attention to cases or situations with the tool has been exceptional. being able to count on the manufacturer either by mail, call or chat. generate cases directly from the application allows you to have personalized support in order to solve problems that has been able to appear.
The remote setup team helped when i needed it and setup weas very straight forward and easy. The advanced setup for an external db and customizations for our latest version AD environment went pretty easy once they found documentation on customization.
Our logs are very important, and Datadog manages them exceptionally well. We frequently use Datadog services for our investigations. Use case: Monitor your apps, infrastructure, APIs, and user experience.
Key features:
Logs, metrics, and APM (Application Performance Monitoring)
Real-time alerting and dashboards
Supports Kubernetes, AWS, GCP, and other integrations
RUM (Real User Monitoring) and Synthetics
✅ Best for backend, server, and distributed systems monitoring.
In terms of features, ADAudit Plus offers a comprehensive set of features for monitoring and auditing Active Directory, including real-time alerts, detailed reports, and user behavior analytics. The platform also offers support for multiple platforms, including Windows, UNIX, and Linux, as well as integration with other ManageEngine tools.