TrustRadius: an HG Insights company

Data Center Real-User Monitoring (DCRUM), discontinued vs. Retrace (legacy)

Save this comparison

Save this comparison

Add Product

Recommended Comparisons

    Overview
    ProductRatingMost Used ByProduct SummaryStarting Price

    Data Center Real-User Monitoring (DCRUM), discontinued

    Score7.2 out of 10
    N/AData Center Real-User Monitoring (DCRUM), also known as Dynatrace Network Application Monitoring (NAM), was an application monitoring solution focusing on user experience, with an emphasis on how the network – especially the WAN – influences user experience. It is a legacy product from Dynatrace, and is no longer sold or supported.N/A

    Retrace (legacy)

    Score8 out of 10
    N/AStackify Retrace provides application performance management across the entire stack. Coupled with aggregated logs from common logging frameworks, find every exception in code. Retrace code with lightweight code profiling and track and monitor all key application and server metrics. The vendor states that with coverage for full lifecycle development, the Stackify Retrace software offering is tailored to be inclusive for multiple role types, and presents everything your team needs to know about…

    $99

    up to 3 servers, 500,000 traces, and 1,000,000 logs

    Pricing
    Data Center Real-User Monitoring (DCRUM), discontinuedRetrace (legacy)
    Editions & Modules
    No answers on this topic
    Essentials
    $99
    up to 3 servers, 500,000 traces, and 1,000,000 logs
    Standard
    249+
    2,000,000+ traces and 5,000,000+ logs
    Enterprise
    Custom
    Customer number of traces and logs
    Offerings
    Pricing Offerings
    Data Center Real-User Monitoring (DCRUM), discontinuedRetrace (legacy)
    Free Trial
    NoYes
    Free/Freemium Version
    NoNo
    Premium Consulting/Integration Services
    NoNo
    Entry-level Setup FeeNo setup feeNo setup fee
    Additional DetailsPricing is based on trace and log usage.
    More Pricing Information
    Features
    Data Center Real-User Monitoring (DCRUM), discontinuedRetrace (legacy)
    Application Performance Management
    Comparison of Application Performance Management features of Data Center Real-User Monitoring (DCRUM), discontinued and Retrace (legacy)
    Feature
    Data Center Real-User Monitoring (DCRUM), discontinued
    7.2
    3 Ratings
    9% below category average
    Retrace (legacy)
    6.4
    1 Ratings
    20% below category average
    Application monitoring7.03 Ratings7.01 Ratings
    Database monitoring6.03 Ratings6.01 Ratings
    Threshold alerts7.03 Ratings00 Ratings
    Predictive capabilities8.01 Ratings00 Ratings
    Application performance management console8.03 Ratings00 Ratings
    Collaboration tools8.03 Ratings00 Ratings
    Out-of-the box templates to monitor applications7.03 Ratings6.01 Ratings
    Application dependency mapping and thresholding8.03 Ratings7.01 Ratings
    Virtualization monitoring6.03 Ratings00 Ratings
    Server availability and performance monitoring7.03 Ratings6.01 Ratings
    Server usage monitoring and capacity forecasting7.01 Ratings00 Ratings
    IT Asset Discovery7.02 Ratings00 Ratings
    Best Alternatives
    Data Center Real-User Monitoring (DCRUM), discontinuedRetrace (legacy)
    Small Businesses
    No answers on this topic
    No answers on this topic
    Medium-sized Companies
    SolarWinds AppOptics
    Score7.6 out of 10
    SolarWinds AppOptics
    Score7.6 out of 10
    Enterprises
    Splunk AppDynamics
    Score8.5 out of 10
    Splunk AppDynamics
    Score8.5 out of 10
    All AlternativesView all alternativesView all alternatives
    User Ratings
    Data Center Real-User Monitoring (DCRUM), discontinuedRetrace (legacy)
    Likelihood to Recommend
    7.0
    (3 ratings)
    8.0
    (2 ratings)
    Usability
    10.0
    (1 ratings)
    -
    (0 ratings)
    Support Rating
    9.0
    (1 ratings)
    -
    (0 ratings)
    User Testimonials
    Data Center Real-User Monitoring (DCRUM), discontinuedRetrace (legacy)
    Likelihood to Recommend
    Discontinued Products
    Dynatrace Network Application Monitoring (NAM), formerly DCRUM, has improved greatly compared to when it was DCRUM; however, it still needs a lot of improvement in end-to-end flow capture with regards to network monitoring. Its alerting and integration capabilities are very good and easy to use. But it still needs a lot of tweaking in usability.
    Incentivized
    Read full review
    Discontinued Products
    If I need to change a logo design on the invoice, the new logo is slightly larger or smaller so the type below the logo is in a different area than before. In this case, you would need to load the new version of the document into APM Plus and redo the mapping of the field areas to properly grab the information needed to process the document. Without doing this, the document could fail or go to the wrong archive based on the fields.
    Incentivized
    Read full review
    Pros
    Discontinued Products
    • Dynatrace DCRUM can monitor legacy application protocols that are still used in a lot of organizations worldwide who still trust in those technologies.
    • DCRUM monitors client-server architectures very well and can pinpoint issues along an infrastructure stack.
    • Dynatrace DCRUM can analyze a wide spectre of protocols: Corba, DNS, DB2, Exchange, TCP, HTTP, IBM MQ, Citrix, ICMP, Informix, Tuxedo, SMB, LDAP, MSRPC, MySQL, NetFlow, Net8, Oracle Forms, RMI, SAP GUI, SAP HANA, SAP RFC, SMB, SOAP, XML.
    Read full review
    Discontinued Products
    • Integration of performance management with log management so you get the parameters sent
    • In-line log and error data in trace
    • Integration of error and log data, so in one click you can see all the logs recorded when an error was thrown
    • Very reasonably priced
    Read full review
    Cons
    Discontinued Products
    • Major upgrades process is sometimes unpredictable.
    • The use of SQL Server should be evaluated for something else.
    • Easier SSL key handling.
    Read full review
    Discontinued Products
    • To set up the fields that APM Plus monitors, you need to map each field area on each document.
    • APM Plus could use a way to link the documents back into the finance or business software so you can find the document under the PO, Sales Order, Invoice, etc.
    • APM Plus setup is only for the professionals. There are many areas that need tweaking on setup, having a better default setup would lessen the learning curve to set it up for use.
    Incentivized
    Read full review
    Usability
    Discontinued Products
    Best of breed.
    Read full review
    Discontinued Products
    No answers on this topic
    Support Rating
    Discontinued Products
    The only thing missing for a 10, would be if they texted or called you back.
    Read full review
    Discontinued Products
    No answers on this topic
    Alternatives Considered
    Discontinued Products
    Nagios can't trace real user transactions from a front-end tier through a backend-tier,;with Nagios you only can monitor server availability and hardware issues. Riverbed is commonly used to determine networking issues without considering real user transactions impact on an application stack.
    Read full review
    Discontinued Products
    It is a very impressive tool which doesn't overwhelm you with unnecessary data. They have combination of tools that haven't seen by any other company which makes it a very powerful tool
    Read full review
    Return on Investment
    Discontinued Products
    • Dynatrace Network Application Monitoring (NAM), formerly DCRUM, helped us get a lot of info on an ongoing issue.
    • It helped us figure out network bottlenecks in our environment.
    • It is a very costly tool and a lot of other cheaper tools give same kind of info.
    Incentivized
    Read full review
    Discontinued Products
    • APM Plus has freed up users from having to manually attach documents to each place they are sending it. APM Plus will do it automatically.
    • APM Plus provides a searchable archive to re-visit sent documents with customers and vendors. Having to reprint a document you risk the potential that something has changed since it was last printed.
    • APM Plus does need IT staff for adjustments and to review sending problems. Not for an average user.
    Incentivized
    Read full review
    ScreenShots

    Retrace (legacy) Screenshots

    Screenshot of Detailed stack trace with inline error and logsScreenshot of Web Apps Dashboard:
The Apps Page gives you a high-level overview of all applications found and monitored across all servers in each environment. Click on any app to take you to the App Dashboard to view more information for a particular app.Screenshot of Apps Dashboard:
The App Dashboard is a powerful monitoring and troubleshooting perspective that gives you a view of application health across one or more environments.Screenshot of Performance (APM+) Dashboard:
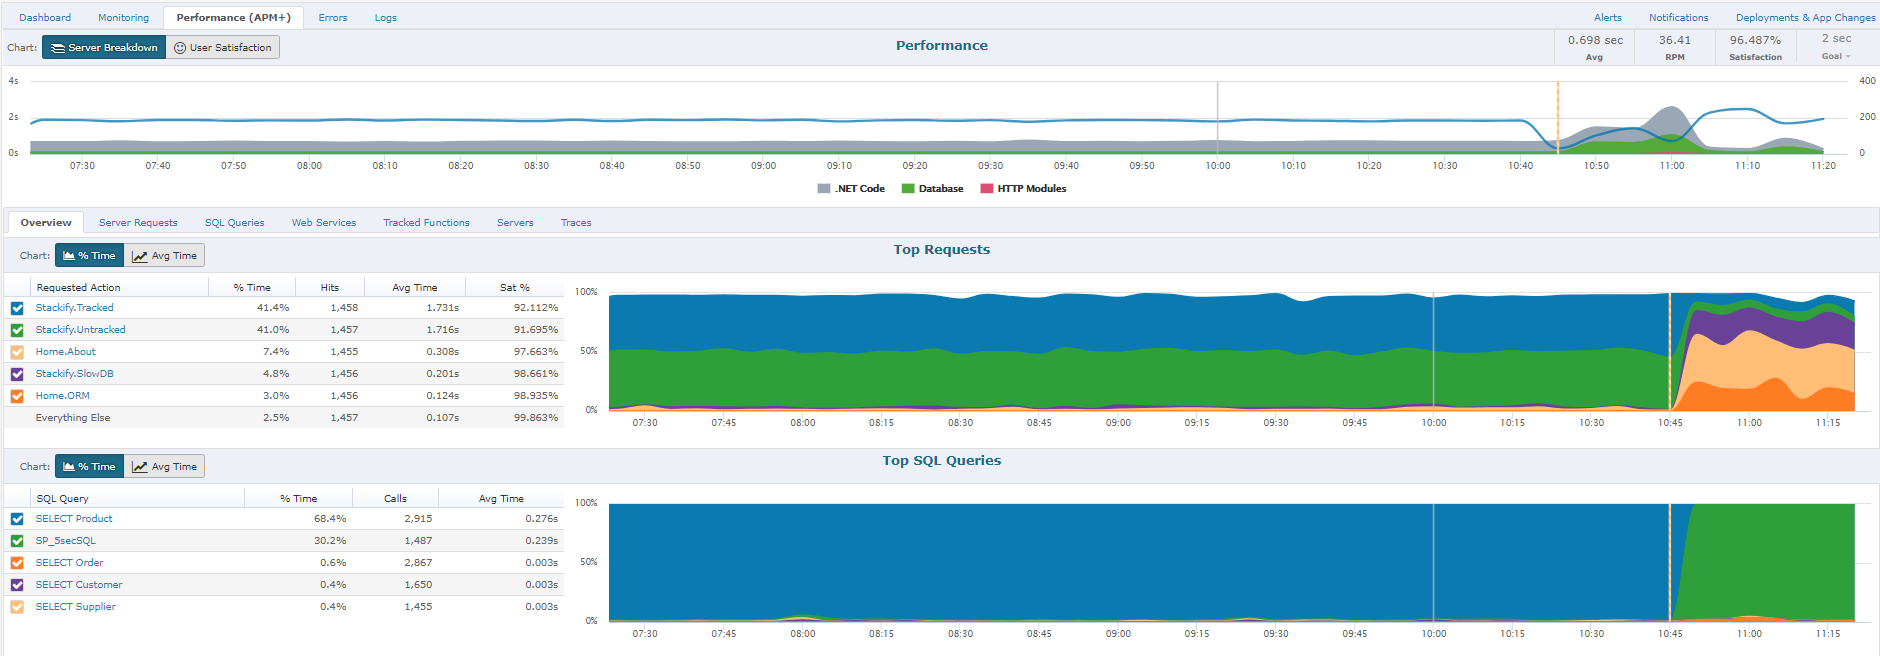
The Performance section will give you a report of how well the application is performing overall, as perceived by your users.  A graph will allow you to view all requests by Satisfaction by viewing "Fast", "Sluggish", "Too Slow", or "Failed" types of requests.  Another report includes graphs of HTTP Error%, Satisfaction Score%, and Page Load Time.  Lastly, you will have the ability to sort each page request of your App by different categories: Satisfaction, Slowest page, Failed pages, pages hit, and total load time.  By clicking on an individual page a Performance Details page with further information about that specific page's health, performance, and errors will be displayed.Screenshot of Performance Traces:
One of the ways we strive to deliver relevant insights is to only collect traces around interesting requests. Some examples of these request types that are interesting would be faster than normal, slower than normal, new web requests, requests introducing new SQL, requests introducing new exceptions, or abnormal satisfaction scores. Under performing requests will be profiled more often than fast requests. As long as the app is getting steady traffic Retrace should be saving a trace every 5 to 15 minutes.Screenshot of Errors Dashboard:
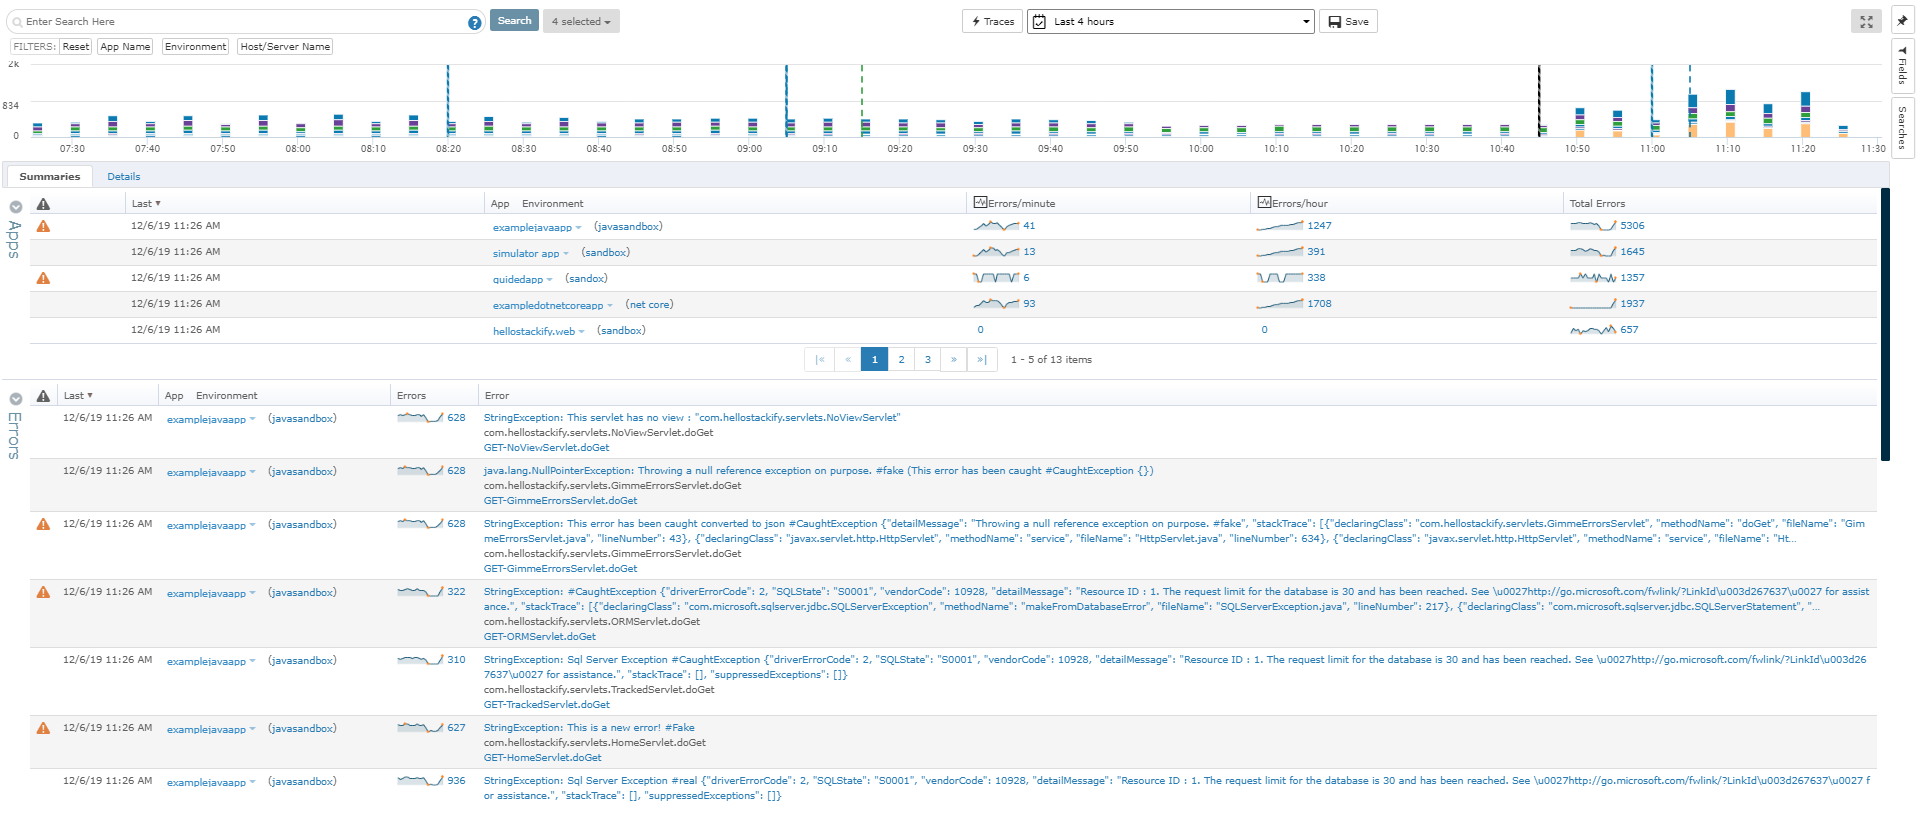
From the Errors Dashboard, you can get an overview of all the exceptions of all your applications across different environments. It gives you a central location to view details about your errors.