Domo vs. Lightning Tools Data Viewer

Overview
ProductRatingMost Used ByProduct SummaryStarting Price
Domo
Score 8.5 out of 10
N/A
Domo is a full self-service business intelligence software that combines several data analysis and reporting tools into one platform. It helps users connect to multiple data sources, create robust visual reports, manage their data, send messages in real-time, manage projects, and develop new apps.N/A
Lightning Tools Data Viewer
Score 9.1 out of 10
Mid-Size Companies (51-1,000 employees)
The Data Viewer provides data visualization in the form of reports or charts that can be created and customized to suit a business's needs. Silos of data exist in most organizations and yet contain valuable insights into how well the organization is performing and where action is needed. Those silos often include Microsoft Excel workbooks, Microsoft SQL Azure databases, On-Premises data sources accessible through OData or Business Connectivity Services and even SharePoint Lists. These data…
$2,200
per year per installation
Pricing
DomoLightning Tools Data Viewer
Editions & Modules
No answers on this topic
Data Viewer OnPrem
$1,000
per year Per installation, 1 x WFE
Data Viewer Online
$2,200
per year per installation
Data Viewer OnPrem Enterprise Edition
POA
per year Per installation, 4+ WFE
Data Viewer Online Enterprise Edition
POA
per year per installation
Offerings
Pricing Offerings
DomoLightning Tools Data Viewer
Free Trial
YesYes
Free/Freemium Version
NoNo
Premium Consulting/Integration Services
NoYes
Entry-level Setup FeeNo setup feeNo setup fee
Additional DetailsPrices stated are minimum per installation for "stock" products. $2.20 per user / year on top of base price. Enterprise editions can be amended to suit business needs if deemed necessary, additional costs incurred and TBD. All packages include free technical support. Free upgrades available to latest versions of tool as they are released. (online version)
More Pricing Information
Community Pulse
DomoLightning Tools Data Viewer
Features
DomoLightning Tools Data Viewer
BI Standard Reporting
Comparison of BI Standard Reporting features of Product A and Product B
Domo
9.6
72 Ratings
16% above category average
Lightning Tools Data Viewer
9.1
1 Ratings
12% above category average
Pixel Perfect reports9.550 Ratings00 Ratings
Customizable dashboards9.872 Ratings9.11 Ratings
Report Formatting Templates9.565 Ratings9.11 Ratings
Ad-hoc Reporting
Comparison of Ad-hoc Reporting features of Product A and Product B
Domo
9.4
71 Ratings
16% above category average
Lightning Tools Data Viewer
8.2
1 Ratings
5% above category average
Drill-down analysis9.370 Ratings6.41 Ratings
Formatting capabilities9.469 Ratings9.11 Ratings
Integration with R or other statistical packages9.01 Ratings00 Ratings
Report sharing and collaboration9.871 Ratings9.11 Ratings
Report Output and Scheduling
Comparison of Report Output and Scheduling features of Product A and Product B
Domo
8.9
69 Ratings
8% above category average
Lightning Tools Data Viewer
-
Ratings
Publish to Web9.854 Ratings00 Ratings
Publish to PDF9.356 Ratings00 Ratings
Report Versioning7.01 Ratings00 Ratings
Report Delivery Scheduling9.565 Ratings00 Ratings
Data Discovery and Visualization
Comparison of Data Discovery and Visualization features of Product A and Product B
Domo
8.8
70 Ratings
10% above category average
Lightning Tools Data Viewer
3.6
1 Ratings
73% below category average
Pre-built visualization formats (heatmaps, scatter plots etc.)9.770 Ratings3.61 Ratings
Location Analytics / Geographic Visualization9.764 Ratings00 Ratings
Predictive Analytics7.01 Ratings00 Ratings
Access Control and Security
Comparison of Access Control and Security features of Product A and Product B
Domo
9.6
71 Ratings
12% above category average
Lightning Tools Data Viewer
-
Ratings
Multi-User Support (named login)9.768 Ratings00 Ratings
Role-Based Security Model9.565 Ratings00 Ratings
Multiple Access Permission Levels (Create, Read, Delete)9.469 Ratings00 Ratings
Report-Level Access Control9.54 Ratings00 Ratings
Single Sign-On (SSO)10.01 Ratings00 Ratings
Mobile Capabilities
Comparison of Mobile Capabilities features of Product A and Product B
Domo
8.9
63 Ratings
14% above category average
Lightning Tools Data Viewer
-
Ratings
Responsive Design for Web Access8.461 Ratings00 Ratings
Mobile Application8.552 Ratings00 Ratings
Dashboard / Report / Visualization Interactivity on Mobile8.560 Ratings00 Ratings
Application Program Interfaces (APIs) / Embedding
Comparison of Application Program Interfaces (APIs) / Embedding features of Product A and Product B
Domo
7.7
1 Ratings
0% below category average
Lightning Tools Data Viewer
-
Ratings
REST API8.01 Ratings00 Ratings
Javascript API8.01 Ratings00 Ratings
iFrames8.01 Ratings00 Ratings
Java API8.01 Ratings00 Ratings
Themeable User Interface (UI)7.01 Ratings00 Ratings
Customizable Platform (Open Source)7.01 Ratings00 Ratings
Best Alternatives
DomoLightning Tools Data Viewer
Small Businesses
Yellowfin
Yellowfin
Score 8.6 out of 10
Supermetrics
Supermetrics
Score 9.8 out of 10
Medium-sized Companies
Reveal
Reveal
Score 10.0 out of 10
Supermetrics
Supermetrics
Score 9.8 out of 10
Enterprises
Kyvos Semantic Layer
Score 9.5 out of 10
IBM Analytics Engine
Score 7.1 out of 10
All AlternativesView all alternativesView all alternatives
User Ratings
DomoLightning Tools Data Viewer
Likelihood to Recommend
10.0
(75 ratings)
9.1
(1 ratings)
Likelihood to Renew
8.0
(2 ratings)
-
(0 ratings)
Usability
9.6
(36 ratings)
-
(0 ratings)
Support Rating
9.2
(14 ratings)
-
(0 ratings)
Implementation Rating
9.1
(21 ratings)
-
(0 ratings)
Vendor pre-sale
7.5
(6 ratings)
-
(0 ratings)
User Testimonials
DomoLightning Tools Data Viewer
Likelihood to Recommend
Domo
I believe that companies that record large amounts of data about their product, service employers KPIs, etc, can make the best out of Domo for reporting and data analysis, but if a company handles little data and is not recording this consistently, it will not be of much use.
Read full review
Lightning Tools
Lightning Tools Data Viewer is well suited for re-surfacing data and customizing its look and feel.
Read full review
Pros
Domo
  • Exceptional Transform area of the platform - any/all raw data can be manipulated and combined to create datasources that are very useful for our departments.
  • Visualization layer is clean and is very business presentable. Its simple but includes depth. Visuals can be created/used by all roles throughout our firm, its not limited to analysts.
  • Ability to communicate and talk about insights in the data - the communication tool is exceptional. I can @ mention specific users to bring attention to a discovery. I can start a private chat. I can annotate and communicate what I am seeing. I love it.
  • Mobile experience is excellent. When I am on the road i can actively monitor and engage with my team due to my Domo dashboard on my mobile device. Its amazing to run the business and not worry while away from the office.
Read full review
Lightning Tools
  • Shows Lists created on different sites to be seen and controlled on another site in a Tenant
  • Allows selection of layouts and coloring way beyond what other programs do.
  • Easy to learn and very functional.
Read full review
Cons
Domo
  • Copying Reports - In Excel or Google Sheets, I like to make copies of similar reports and modify them as necessary for users. In Domo, makes copies of reports (called cards) but all copies are connected. So if you adjust the copy, it changes the original. This means a user has to recreate the report from scratch and then adjust it.
  • Unforgiving SQL - Domo does allow users to write their own SQL codes, which is great. However, Domo's SQL code is pickier than the other SQL database I've used (Metabase).
  • Text Alerts - Domo's alerts aren't always the smartest. Some of my dashboards are about the sales teams monthly performance and I get notified when there is a change of more than 20%. I always get notified at the start of the month that reports have changed from 'x' number to zero. This is expected because it's a monthly report and I hate getting texts about it. The only reason I don't term them off so I can be aware if something breaks in the middle of the month.
Read full review
Lightning Tools
  • Data Viewer has a graph feature that is old school flat design. We loved the In House real 3D graph Lightning Tools program.
Read full review
Likelihood to Renew
Domo
Domo is a great up-and-coming product. There are many fantastic features that are extremely compelling to our end users, which makes Domo a great fit for our organization. As with many BI tools, there are items on the wish list that could make implementation, administration and usage easier, but I believe these will be addressed over time as the product matures and evolves. The overall concept and approach of this solution has definitely raised the bar in this area of expertise and I would like to see things advance in giving the enterprise tools that will make decision making easier and more robust in the future.
Read full review
Lightning Tools
No answers on this topic
Usability
Domo
The built-in user support and intuitive design of Domo makes it simple to learn and use. I find I can spend hours drilling deep, or else quickly gain an overview in just a few minutes. This is a great advantage since the flexibility fits well with the demands of my role. I enjoy using Domo since I know it will give me comparative data across almost every variable I might want to explore - I look forward to it!
Read full review
Lightning Tools
No answers on this topic
Support Rating
Domo
Pretty responsive. It took a while to get a response in selecting data points for our particular cards. Might have taken about a month? I am not sure if this was something on our end or Domo's end. But haven't had any other issues yet that required additional support from Domo.
Read full review
Lightning Tools
No answers on this topic
Implementation Rating
Domo
It is a true web-based application so implementation is much easier and smoother compared to other non-web based BI solutions. Also, they offered consulting services during the implementation process, which was helpful. Also, they provided lots of on-demand training courses and videos, which I liked.
Read full review
Lightning Tools
No answers on this topic
Alternatives Considered
Domo
At the end of the day, end-user adoption and taking the burden of IT to build reports was my goal. Demoing and testing many BI tools, DOMO is the one that allowed both to happen.
Read full review
Lightning Tools
Lightning Tools Data Viewer is much easier and more powerful than Infowise similar viewer in their lineup. In this case, we use Data Viewer over the one offered by Infowise.
Read full review
Return on Investment
Domo
  • I mentioned a "previously un-analyzable" dataset that we were able to visualize in Domo - the result was business re-alignment for increased productivity, cost savings and ROI.
  • It's tough to quantify the ability to provide insights that have been desired for years but not possible - we continue to amaze our executives and product managers with the analysis we can provide.
Read full review
Lightning Tools
  • It allows us to do things that would take a great deal more time to duplicate in SharePoint
  • It cuts down on ugly looking built in SP list layouts
  • Users find it easy to access, thus this product is more productive
Read full review
ScreenShots

Domo Screenshots

Screenshot of Screenshot of

Lightning Tools Data Viewer Screenshots
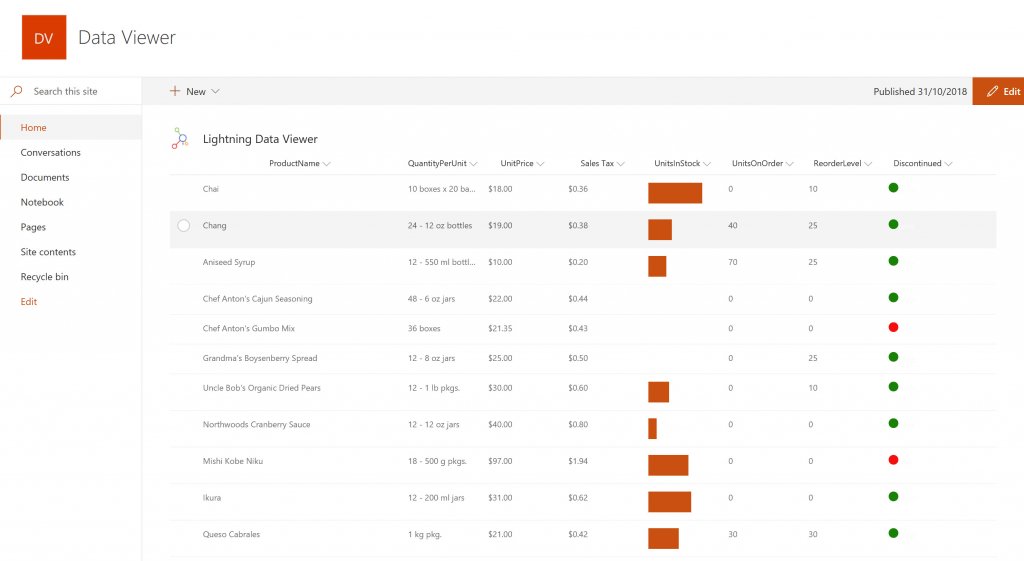
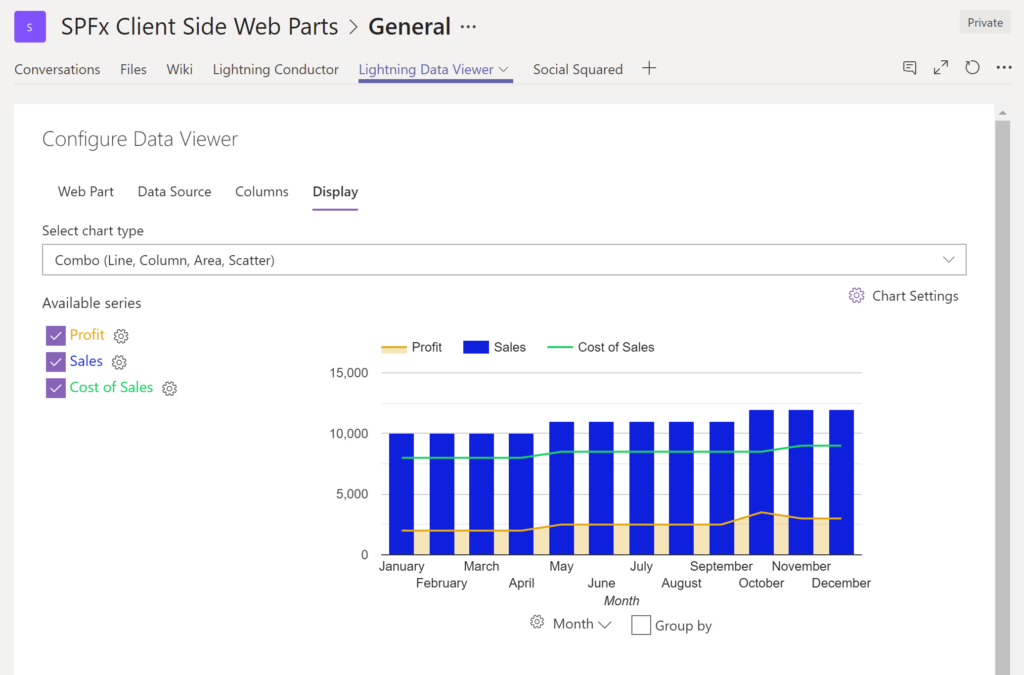
Screenshot of DISPLAYING EXTERNAL DATA WITHIN SHAREPOINT OR MICROSOFT TEAMS
The Data Viewer Client Side Web Part can be configured by Business Users within a few minutes to display Line of Business Data from Data Sources such as Excel,  SQL Azure, Business Connectivity Services, OData and SharePoint Lists.  Connections to an organizations data such as Customer Relationship Management Systems, Accounting Systems, or Custom Databases can be connected, giving business users a live up-to-date view of business information within the context of their SharePoint Team Sites or Microsoft Teams Tabs.Screenshot of HIGHLIGHTING KEY BUSINESS DATA (NO CODE)
Conditional formatting can be used to highlight key business data. Overdue Tasks, Low Stock, Currency Exchange Rates, Sales Revenue are examples of data to highlight visually allowing for a quick reaction time. Key Financial Indicators and Key Performance Indicators can be configured with a simple dialog and no need to write any code. Choose colours, icons or data bars to highlight key data.Screenshot of SELECTING AND STYLING ICONS
Icons can be chosen as part of the conditional formatting to make data stand out. The Office 365 Fabric icons can be selected and styled and applied to cell values. Pepper pots, Smileys, Envelopes and more icons are available. There are hundreds of options to choose from to highlight data that needs to be acted upon.Screenshot of DATA VIEWER CAN BE A GRID OF DATA OR A CHART IN SHAREPOINT OR MICROSOFT TEAMS
The Data Viewer can be used within Microsoft SharePoint Modern Sites or Microsoft Teams Tabs as a Grid of Data with styling or as a Chart which can be configured. The Charting Feature allows for Pie, Donut, Column, Line, Area, and Scatter Charts which can all be configured and displayed in 2D or 3D.Screenshot of TREEMAPS
summary information can be displayed within a TreeMap next to the detail. Users will be able to see trends, and how the business is performing  using the TreeMap view of data.Screenshot of CHARTS AND GAUGES
The Data Viewer is used to represent data in multiple ways using Gauges, TreeMaps, Multiple Series Charts, and Pie Charts.