Dynatrace is an APM scaled for enterprises with cloud, on-premise, and hybrid application and SaaS monitoring. Dynatrace uses AI-supported algorithms to provide continual APM self-learning and predictive alerts for proactive issue resolution.
$0
per synthetic request
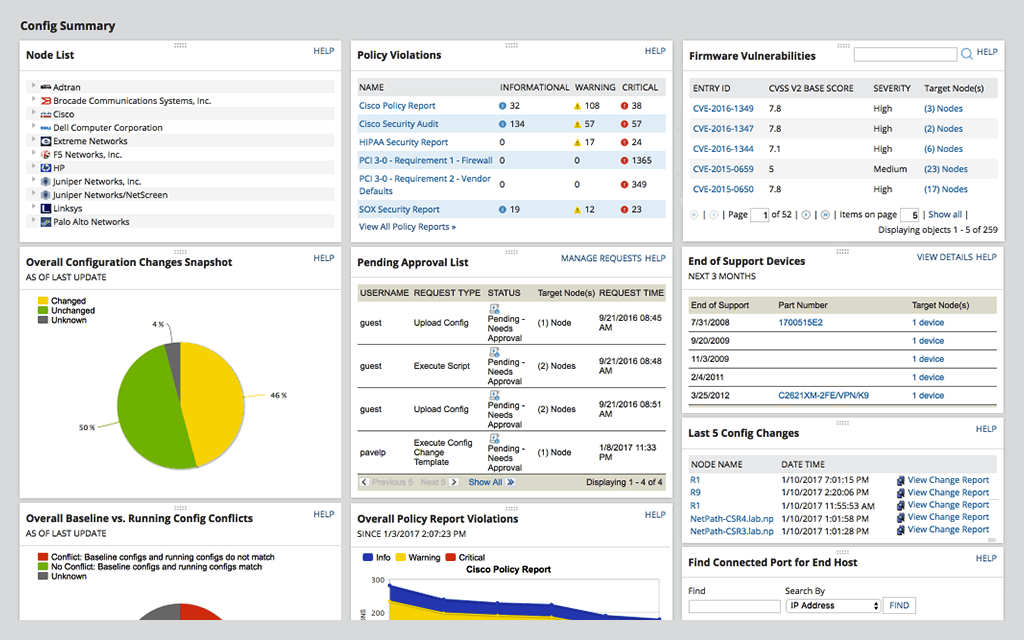
SolarWinds Network Configuration Manager (NCM)
Score 8.4 out of 10
N/A
SolarWinds Network Configuration Manager is network diagnostics and troubleshooting technology, from Austin-based SolarWinds.
N/A
Pricing
Dynatrace
SolarWinds Network Configuration Manager (NCM)
Editions & Modules
Synthetic Monitoring
$0.001
per synthetic request
Kubernetes Platform Monitoring
$0.002
per hour for any size pod
Real User Monitoring
$0.00225
per session
Application Security
$0.018
per hour for 8 GIB host
Infrastructure Monitoring
$0.04
per hour for any size host
Full-Stack Monitoring
$0.08
per hour for 8 GIB host
No answers on this topic
Offerings
Pricing Offerings
Dynatrace
SolarWinds Network Configuration Manager (NCM)
Free Trial
No
Yes
Free/Freemium Version
No
No
Premium Consulting/Integration Services
No
No
Entry-level Setup Fee
No setup fee
Optional
Additional Details
—
—
More Pricing Information
Community Pulse
Dynatrace
SolarWinds Network Configuration Manager (NCM)
Considered Both Products
Dynatrace
Verified User
Employee
Chose Dynatrace
Dynatrace is easier to use and does more. It's an all-in-one product.
For NCM, there is no other tool that I know of that can work as well as SolarWinds does.
All other products that I have used are mainly used for application performance monitoring more than network configuration capture.
Dynatrace is well suited to a number of tasks. It is important to determine who the end users are and gather good information to tailor their experience accordingly. For instance, business/marketing should not have access to some of the more technical data, and business metrics can be a distraction for IT operations personnel.
Network Configuration Manager is well suited for backing up configurations of all your devices. It also has a great comparison tool for seeing only the differences in config. Another great feature is it's ability to push a script to any number of devices. This is very handy for pushing changes to one, 10 or multiple devices. There are also some great reports that you can run against the devices in inventory
We loved Dynatrace's ability to show the data flow - from the front end points through the back end points straight to the database and various API's. It was advanced in its data visualization. This is useful for debugging - showing when/where the errors are. It can even enable non-technical individuals in the corporation to help debug
Dynatrace has some great highly customizable integration options as well as monitoring. You can configure your layout & integration options to create custom monitoring alerts for your applications performance. Further you can increase the extensibility of using a REST API on your architecture.
Some advanced dev-ops systems are utilizing Kubernetes/docker aswell as Node.JS - Dynatrace was able to log and help understand all of our dev-ops needs. It gave us native alerts based off of deviations from the baseline that we set during initial configuration. These metrics are priceless.
Dynatrace does not monitor easily on a C-based application.
The way DPGR is addressed by Dynatrace is not very complete, and not clear. One thing is to mask the IP and request attributes but is not enough, the replay session feature is great but raises serious questions about user tracking.
For our use case, it does everything great and some of the features we underutilize but I would like to be able to set a configuration baseline when initially adding a node instead of after the configuration is pulled but it's not a particularly big deal to let it pull the configuration then set it as the baseline.
We have already renewed our purchase with the company. They make it easy for us to get a temporary license for our contingency site that is only used for testing twice a year. We are expanding our license with for this tool. We find it very useful and will renew it again.
Medium complexity to set up in the beginning if using any non-standard devices or configurations, else fairly easy (e.g. Cisco Nexus or IOS-based devices). Reports are fairly straightforward to set up. Updates to the platform are fairly straightforward and don't take a major effort. Easy to add or remove devices.
Dynatrace is great to use once you understand how to use it correctly and get used to the layout of it. While I do not actively use it every day, whenever I do use it, I do have to get refamiliarized with it. However, once you have your dashboards setup correctly with the data that you want to see when you first login to Dynatrace, it's amazing.
The user interface is lacking. It is difficult to navigate at times and things can be done multiple ways. Quite often I am confused by how their notification structure works. It is not very intuitive. They do offer a free Academy. They also offer a community of other technical folks. I have enjoyed both.
Given that Dynatrace has become an informal industry standard, the plethora of information available on forums is massive. Most problems or roadblocks you come across are most likely (almost certainly, in fact) already solved and solutions available on these forums. The tech support at Dynatrace is also quite good, with prompt and knowledgeable people at their end.
To be fair, I have not had to involve Support in a number of years, but when I did, I was greeted with enthusiastic engineers who wanted to understand and solve the issue. It was a fairly complex scenario and I have discovered in my most recent implementation that engineering included that option as a standard now.
Solarwinds has actually produced new training since I last used it that is available on their site at any time. Their previous training was more than enough to get us started but now there is significantly more content. Since I'm comfortable with the Orion platform and the products we use I haven't checked the new training out yet but we have new staff go through portions of that training and they always come away with an understanding of the platform and ready to use it
it was a fairly easy implementation and everything was pretty straightforward. only challenge we had was getting all the snmp communities updated on the networking equipment
Synthetic Monitoring automatically does what other products do only through the use of other tools or through the development of user applications that still have a high cost of maintenance. The other products are not immediately usable and require many customizations. Through the use of configuration automatisms, you can be immediately operational and, in our case, we detected several imperfections in the applications.
At the time SolarWinds was the biggest player in the space and their whole portfolio was very comprehensive. As time progressed and newer technologies came about (i.e. SDWAN) their products couldn't keep up with the consumer demands and changing market. Security became such a big focus that once Solarwinds got hacked we had to remove all their products from our environment
Saves 100s of hours a year in man hours over manual configuration.
Saved easily 50k in lost revenue when a switch rebooted with months old unsaved configuration. NCM let us quickly restore a snapshot of the running config from the previous day.
Saves us several man hours per week of config auditing by reducing all changes to a summary email.