Endeca was a business intelligence platform for analyzing unstructured data, acquired by Oracle and since discontinued.
N/A
Google Charts
Score8.2 out of 10
N/A
Google Charts provides a way to visualize data on your website - for free. From simple line charts to complex hierarchical tree maps, the chart gallery provides a large number of ready-to-use chart types. The most common way to use Google Charts is with simple JavaScript that you embed in your web page.
N/A
Qlik Cloud Analytics (Qlik Sense)
Score8.1 out of 10
N/A
Qlik Sense® is a self-service BI platform for data discovery and visualization. It supports a full range of analytics use cases—data governance, pixel-perfect reporting, and collaboration. Its Associative Engine indexes and connects relationships between data points for creating actionable insights.
Comparison of Mobile Capabilities features of Endeca (discontinued) and Google Charts and Qlik Cloud Analytics (Qlik Sense)
Feature
Endeca (discontinued)
8.2
1 Ratings
6% above category average
Google Charts
8.2
48 Ratings
6% above category average
Qlik Cloud Analytics (Qlik Sense)
7.5
221 Ratings
3% below category average
Responsive Design for Web Access
8.21 Ratings
7.046 Ratings
8.0215 Ratings
Mobile Application
8.21 Ratings
9.629 Ratings
8.0133 Ratings
Dashboard / Report / Visualization Interactivity on Mobile
8.21 Ratings
8.044 Ratings
9.0185 Ratings
Application Program Interfaces (APIs) / Embedding
Comparison of Application Program Interfaces (APIs) / Embedding features of Endeca (discontinued) and Google Charts and Qlik Cloud Analytics (Qlik Sense)
Best fit for this product: - Advanced or Sophisticated Enterprise Search platform: If you spend effort on your search capabilities, Endeca is the tool. - If you are looking for capabilities to search and navigate similar to a relational-database system, then Endeca is not the best fit. - If you are spending effort to drive customer experience, especially around customer interaction with your web application, Endeca can help with that in a multichannel environment.
We can easily recommend Google Charts to any company that needs a way to visually represent their data. Another great thing about Google Charts is that it is free to use and does not require any membership fees. Although it requires a skilled used to be able to use the charts, the results are great and can be beneficial to any company who is looking to make better decisions.
Qlik Sense is a program whose purpose is to greatly improve all your operations and use of all data in an organic way. The mission will always be to increase the economic and commercial processes of the company in a short time. I recommended it for its high technology, which was Created for this area, the results are successful. We have noticed how it has increased relationships with our clients thanks to the credibility and security that we provide.
A de minimis incentive was given to thank the reviewer for their time. The incentive was not used to bias or drive a particular response, nor was the incentive contingent on a positive endorsement. More Info
Provides exact, correct counts of items in its dimensions.
Allows for flexible, out-of-the-box boosting of content (based on combo of any/all of: user profile, date, dimension being browsed and search keyword).
It has a reasonably good admin interface for the administration of boosting/promotion rules for the business user.
they're free with Google suite and they have backing in terms of powerful Google apps which can be plugged in to perform multiple actions like using Google sheets to import raw data into Google Charts
they're the most simple app to use when it comes to creating charts and visual dashboards
ease of customization
ease of using custom APIs from developers side to help make any types of charts and dashboards you want
A de minimis incentive was given to thank the reviewer for their time. The incentive was not used to bias or drive a particular response, nor was the incentive contingent on a positive endorsement. More Info
A de minimis incentive was given to thank the reviewer for their time. The incentive was not used to bias or drive a particular response, nor was the incentive contingent on a positive endorsement. More Info
A de minimis incentive was given to thank the reviewer for their time. The incentive was not used to bias or drive a particular response, nor was the incentive contingent on a positive endorsement. TR verified that a representative sample of customers was invited. More Info
I would like a couple more introductory videos or a live chat option for when you run into an issue. I think this is a Google-wide problem, not only linked to Google Charts.
I have run into some issues with the Dynamic Data but also admittedly could potentially dive in deeper and investigate.
It would be great if Google Charts made it possible to integrate Google Chat into the platform.
A de minimis incentive was given to thank the reviewer for their time. The incentive was not used to bias or drive a particular response, nor was the incentive contingent on a positive endorsement. More Info
A de minimis incentive was given to thank the reviewer for their time. The incentive was not used to bias or drive a particular response, nor was the incentive contingent on a positive endorsement. More Info
If the solution is implemented well and the business understands the purpose of the Endeca stack, it offers a great way for a business to explore and benefit from its existing data. From my experience, the Endeca solution has exposed data patterns to a business that were not thought about or explored before because of the lack of available tools to properly expose these patterns
Google Charts is a good product. It's widely supported with deep documentation and a large community. But for me, it wasn't customizable enough. When we started with simple charts, it was great, but as we got deeper and more complex, our needs outgrew the library. If I was going forward, I would choose a more barebones library with more freedom and extensibility.
A de minimis incentive was given to thank the reviewer for their time. The incentive was not used to bias or drive a particular response, nor was the incentive contingent on a positive endorsement. More Info
Qlik Sense is a constantly improving it's software and working with its' users to make it better. They are great at keeping their users informed of progress and care about delivering a quality product
A de minimis incentive was given to thank the reviewer for their time. The incentive was not used to bias or drive a particular response, nor was the incentive contingent on a positive endorsement. TR verified that a representative sample of customers was invited. More Info
The system itself is very usable, and with proper training is very sensible in its organization and method of operation. There are some downsides in initial setup in the way things are imported (or not in some cases) in setting up properties and dimensions. Overall however it's amazingly flexible in terms of the content it can index and make available for search.
Google Charts is about as easy to use as the rest of their applications. The UI is very well thought out, allowing you to add what you need, and customize it to your exact liking. The default theme is actually really nice, which helps as most of the time, customizing is not needed.
A de minimis incentive was given to thank the reviewer for their time. The incentive was not used to bias or drive a particular response, nor was the incentive contingent on a positive endorsement. More Info
Qlik Sense has a better and easy to learn user interface compared with other analytics tool which always help us to create regular and adhoc reports within the stipulated time frame and can be easily refreshed at a scheduled time and sent to multiple stakeholders for timely update regarding the Key metrics indicator.
A de minimis incentive was given to thank the reviewer for their time. The incentive was not used to bias or drive a particular response, nor was the incentive contingent on a positive endorsement. More Info
Support has been very good, and the trainers for the various Endeca courses have all been very willing to help long after the classes have been completed, so in the instances where we're waiting on support from Oracle, it's often that the members of their training arm can help us out as well.
As a free tool with massively powerful, infinitely customisable charts that can be dynamically updated - Google Charts is my favourite data visualisation tool. However, my hatred of JavaScript does jade my view on it. This is the price of the tool though, and I'm glad it's available for me.
A de minimis incentive was given to thank the reviewer for their time. The incentive was not used to bias or drive a particular response, nor was the incentive contingent on a positive endorsement. More Info
Qlik is great for companies with lots of business domains and departments because it scales well, especially if data that is reported is saved in SQL and similar structures. Its ease of use and good UI enables business units to create and manage their own reports. That removes a great burden of creating and managing/modifying these pages from the IT team. Overall, it's a win-win for both IT and business units.
A de minimis incentive was given to thank the reviewer for their time. The incentive was not used to bias or drive a particular response, nor was the incentive contingent on a positive endorsement. More Info
The training is actually really good, and absolutely necessary - although this is software that has great documentation, the documentation itself is so vast, that it would be difficult to learn haphazardly, not to mention being incredibly time consuming to do so. Online training probably would have been fine except for the fact that having someone look over your shoulder to see where you're going wrong is helpful. This also allowed our team to sit in a single room and converse about functionality, etc. that would have been difficult to facilitate via an online class.
A de minimis incentive was given to thank the reviewer for their time. The incentive was not used to bias or drive a particular response, nor was the incentive contingent on a positive endorsement. More Info
We did some online Q&A with the Oracle team, but I would definitely recommend doing an in person class if you have a large team that will be attending - there's definitely no replacements for a large class of technically oriented staff members who can drive conversation about specific topics that might surface.
A de minimis incentive was given to thank the reviewer for their time. The incentive was not used to bias or drive a particular response, nor was the incentive contingent on a positive endorsement. More Info
There were some features we were hoping to get implemented in this particular release of Endeca, but were unable to facilitate those requirements due mostly to timeline. Having seen several other implementations, we will definitely have future iterations to add functionality and improve upon our implementation of Endeca. For the time being, we are satisfied with our implementation as it turned out.
A de minimis incentive was given to thank the reviewer for their time. The incentive was not used to bias or drive a particular response, nor was the incentive contingent on a positive endorsement. More Info
Oracle Endeca was the best option that we evaluated by far. It gave us the most flexibility and ability to meet our objectives and had features that were not offered by the competing products we evaluated, but which we very much wanted, and this was why we decided to go with Oracle Endeca versus another platform
A de minimis incentive was given to thank the reviewer for their time. The incentive was not used to bias or drive a particular response, nor was the incentive contingent on a positive endorsement. More Info
Google Charts stacks up better since it is free and does not have the constant pressure for cost overruns, add-ons, annual maintenance and implementation services. The speed of using Google Charts is quick, saving users potentially weeks in getting up and going. For the readers of websites with limited resources, the application shows up nicely is look and feel with charts. Great way of showing data visually.
A de minimis incentive was given to thank the reviewer for their time. The incentive was not used to bias or drive a particular response, nor was the incentive contingent on a positive endorsement. More Info
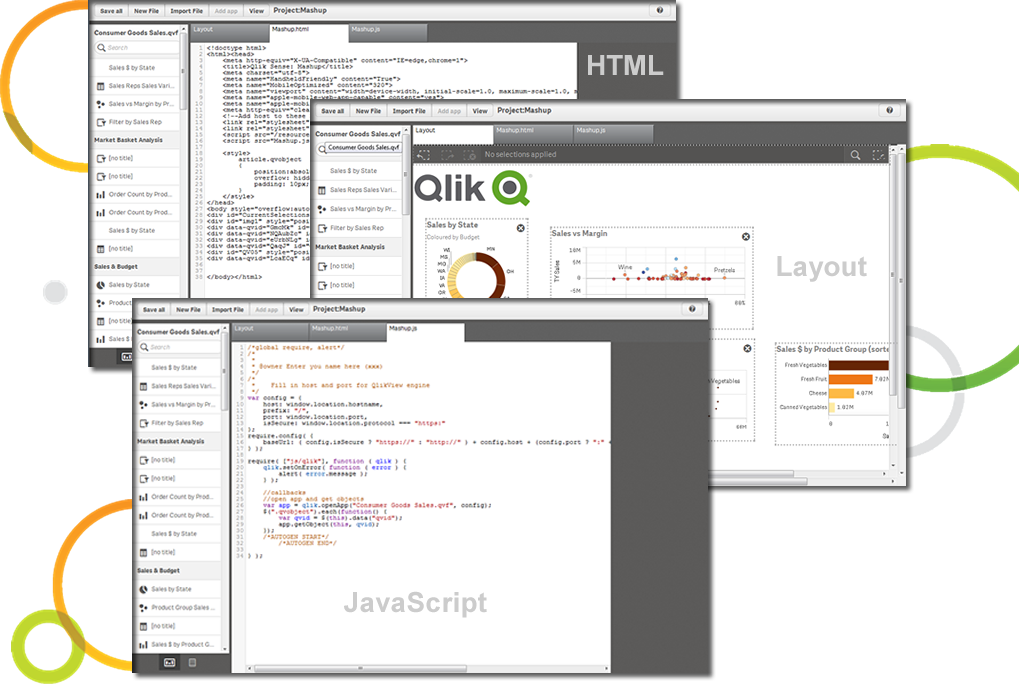
The customization of the platform opens up plenty of other options depending on the use cases. The API layer is incredibly rich and makes integration of Qlik based visualization into web pages a simple and effective pattern. It's been very easy to use with a great community made up of professionals. Qlik Sense has introduces artificial Intelligence into my data visualization and reporting activity.
It is a searching tool, and hard to estimate its impact on conversion.
It does its job regarding better searching; In terms of efficiency, it's hard to say: it has big learning curve. It requires a dedicated Endeca developer to work on it.
A de minimis incentive was given to thank the reviewer for their time. The incentive was not used to bias or drive a particular response, nor was the incentive contingent on a positive endorsement. More Info
A de minimis incentive was given to thank the reviewer for their time. The incentive was not used to bias or drive a particular response, nor was the incentive contingent on a positive endorsement. TR verified that a representative sample of customers was invited. More Info