Chose Microsoft BI (MSBI)
Microsoft BI is ideal for proficient Excel users, and it is the best choice in terms of visualizations. We decided to use Microsoft BI for these reasons.
| Product | Rating | Most Used By | Product Summary | Starting Price |
|---|---|---|---|---|
 erwin Data Modeler | N/A | erwin Data Modeler by Quest is a data modeling tool used to find, visualize, design, deploy and standardize high-quality enterprise data assets. It can discover and document any data from anywhere for consistency, clarity and artifact reuse across large-scale data integration, master data management, metadata management, Big Data, business intelligence and analytics initiatives, accomplishing this whil esupporting data governance and intelligence efforts. | N/A | |
 Microsoft BI (MSBI) | N/A | Microsoft BI is a business intelligence product used for data analysis and generating reports on server-based data. It features unlimited data analysis capacity with its reporting engine, SQL Server Reporting Services alongside ETL, master data management, and data cleansing. | $14 per month per user | |
 Microsoft Power BI | N/A | Microsoft Power BI is a visualization and data discovery tool from Microsoft. It allows users to convert data into visuals and graphics, visually explore and analyze data, collaborate on interactive dashboards and reports, and scale across their organization with built-in governance and security. | $168 per year per user |
| erwin Data Modeler | Microsoft BI (MSBI) | Microsoft Power BI | ||||||||||||||||||||||
|---|---|---|---|---|---|---|---|---|---|---|---|---|---|---|---|---|---|---|---|---|---|---|---|---|
| Editions & Modules | No answers on this topic |
|
| |||||||||||||||||||||
| Offerings |
| |||||||||||||||||||||||
| Entry-level Setup Fee | Optional | No setup fee | No setup fee | |||||||||||||||||||||
| Additional Details | — | — | Power BI Desktop is the data exploration and report authoring experience for Power BI, and is available as a free download. | |||||||||||||||||||||
| More Pricing Information | ||||||||||||||||||||||||
| erwin Data Modeler | Microsoft BI (MSBI) | Microsoft Power BI | |
|---|---|---|---|
| Considered Multiple Products |  erwin Data Modeler No answer on this topic | Microsoft BI (MSBI)  Sean Warren CIO (Chief Information Officer) Chose Microsoft BI (MSBI) Microsoft is a distant me too in a world that is crowded and drowning in BI Me too products. Visualizations 5/10. Micro Strategy, ClickView, Domo, BOBJ etc will kill this product. The issue is cost and speed to implementation. The cost is far less than any of the previously … | Microsoft Power BI No answer on this topic |
| erwin Data Modeler | Microsoft BI (MSBI) | Microsoft Power BI | |||||||||||||||||||||||||||
|---|---|---|---|---|---|---|---|---|---|---|---|---|---|---|---|---|---|---|---|---|---|---|---|---|---|---|---|---|---|
| BI Standard Reporting |
| ||||||||||||||||||||||||||||
| Ad-hoc Reporting |
| ||||||||||||||||||||||||||||
| Report Output and Scheduling |
| ||||||||||||||||||||||||||||
| Data Discovery and Visualization |
| ||||||||||||||||||||||||||||
| Access Control and Security |
| ||||||||||||||||||||||||||||
| Mobile Capabilities |
| ||||||||||||||||||||||||||||
| Application Program Interfaces (APIs) / Embedding |
|
| erwin Data Modeler | Microsoft BI (MSBI) | Microsoft Power BI | |
|---|---|---|---|
| Small Businesses |  Egnyte Score 9.4 out of 10 |  Yellowfin Score 8.7 out of 10 | Yellowfin Score 8.7 out of 10 |
| Medium-sized Companies |  IBM InfoSphere Information Server Score 8.0 out of 10 |  Reveal Score 10.0 out of 10 | Reveal Score 10.0 out of 10 |
| Enterprises | IBM InfoSphere Information Server Score 8.0 out of 10 |  Kyvos Semantic Layer Score 9.5 out of 10 | Kyvos Semantic Layer Score 9.5 out of 10 |
| All Alternatives | View all alternatives | View all alternatives | View all alternatives |
| erwin Data Modeler | Microsoft BI (MSBI) | Microsoft Power BI | |
|---|---|---|---|
| Likelihood to Recommend | 6.1 (7 ratings) | 10.0 (73 ratings) | 8.5 (197 ratings) |
| Likelihood to Renew | - (0 ratings) | 8.0 (25 ratings) | 9.5 (3 ratings) |
| Usability | 9.0 (2 ratings) | 10.0 (15 ratings) | 8.3 (113 ratings) |
| Availability | - (0 ratings) | 9.5 (2 ratings) | - (0 ratings) |
| Performance | - (0 ratings) | 7.0 (2 ratings) | - (0 ratings) |
| Support Rating | 9.0 (3 ratings) | 8.9 (15 ratings) | 10.0 (52 ratings) |
| In-Person Training | - (0 ratings) | 6.9 (3 ratings) | - (0 ratings) |
| Online Training | - (0 ratings) | 8.5 (2 ratings) | - (0 ratings) |
| Implementation Rating | - (0 ratings) | 9.6 (7 ratings) | 9.0 (1 ratings) |
| Configurability | - (0 ratings) | 10.0 (2 ratings) | - (0 ratings) |
| erwin Data Modeler | Microsoft BI (MSBI) | Microsoft Power BI | |
|---|---|---|---|
| Likelihood to Recommend | Quest Software
| Microsoft
 Adam Montgomery Partnership Manager | Microsoft
|
| Pros | Quest Software
 Ravinder Gupta Senior Oracle Database Administrator | Microsoft
 Nilufa Hossain IT Specialist | Microsoft
|
| Cons | Quest Software
| Microsoft
| Microsoft
|
| Likelihood to Renew | Quest Software No answers on this topic | Microsoft
 Lee Cullom President | Microsoft
 David Jensen Operations Manager, Customer Success |
| Usability | Quest Software
| Microsoft
| Microsoft
|
| Reliability and Availability | Quest Software No answers on this topic | Microsoft
 Robert Goodman Director, Business Intelligence & Analytics | Microsoft No answers on this topic |
| Performance | Quest Software No answers on this topic | Microsoft
Robert Goodman Director, Business Intelligence & Analytics | Microsoft No answers on this topic |
| Support Rating | Quest Software
| Microsoft
| Microsoft
|
| In-Person Training | Quest Software No answers on this topic | Microsoft
 Stephanie Grice Business Intelligence Analyst | Microsoft No answers on this topic |
| Online Training | Quest Software No answers on this topic | Microsoft
 Sean Brady Business Intelligence Architect | Microsoft No answers on this topic |
| Implementation Rating | Quest Software No answers on this topic | Microsoft
 Jacob Saunders National Practice Director - Business Intelligence | Microsoft
 Anuj Sant Senior buyer |
| Alternatives Considered | Quest Software
| Microsoft
| Microsoft
|
| Return on Investment | Quest Software
 Rina Falkovich Data Architect | Microsoft
 Haibo Yang BI Reporting Specialist | Microsoft
|
| ScreenShots | erwin Data Modeler Screenshots  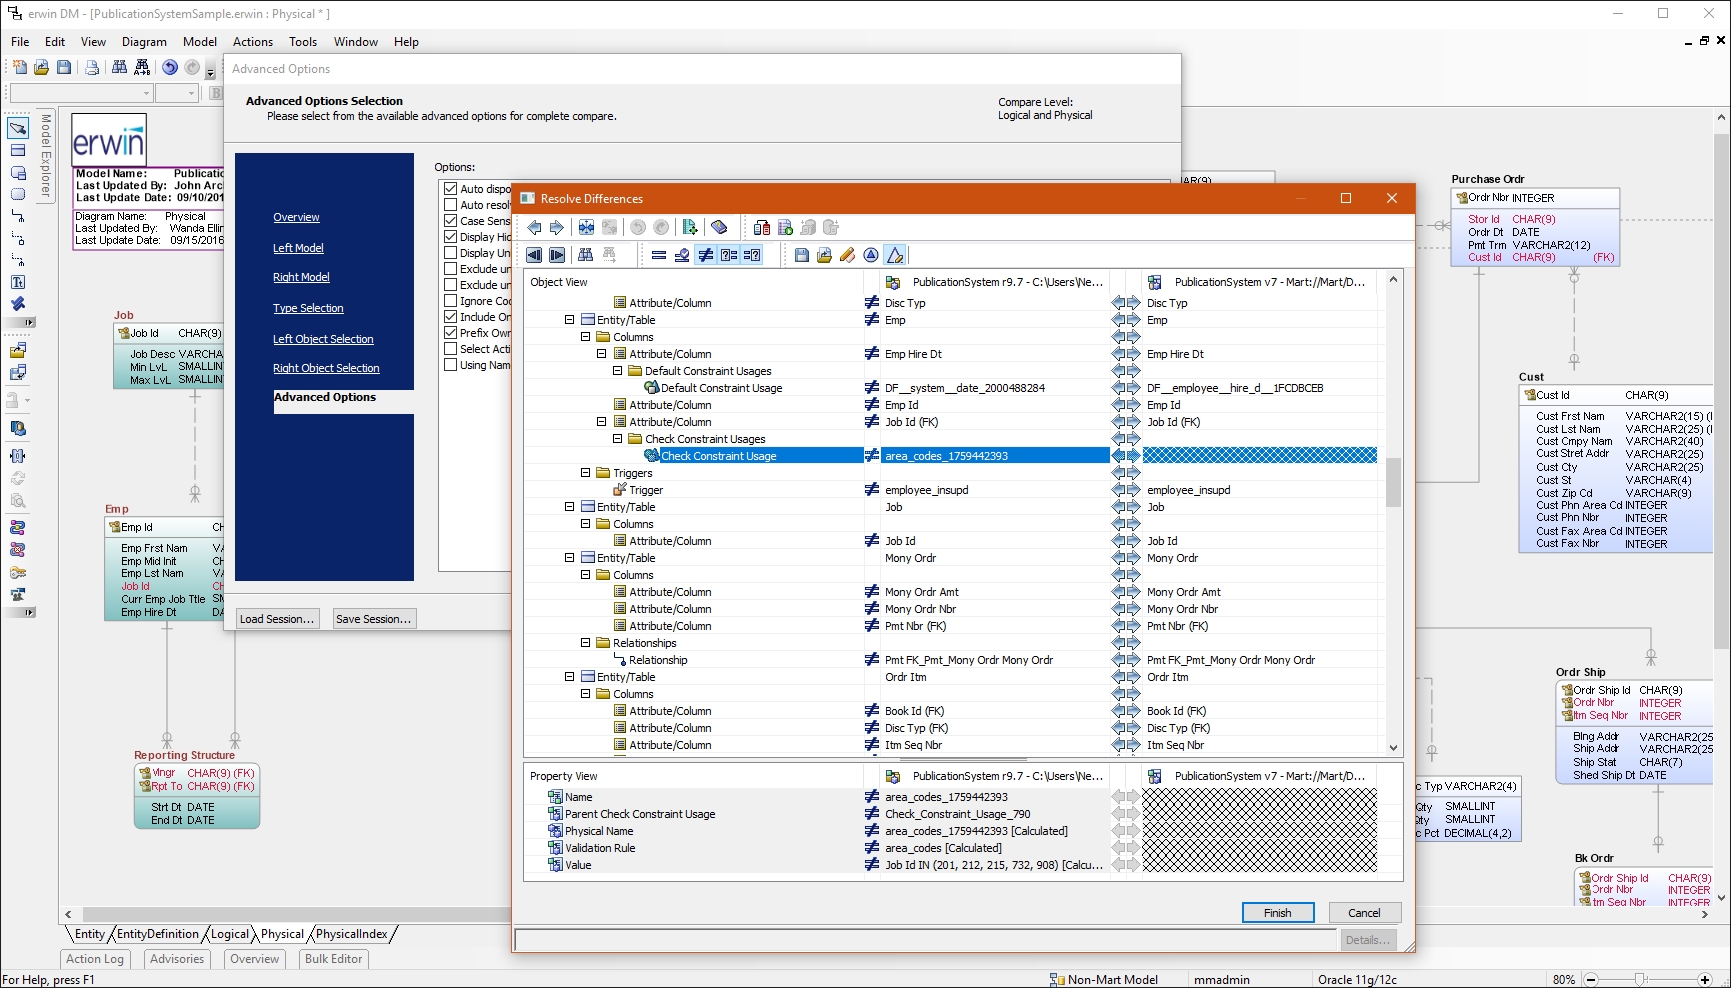 | Microsoft Power BI Screenshots      |