Google Charts provides a way to visualize data on your website - for free. From simple line charts to complex hierarchical tree maps, the chart gallery provides a large number of ready-to-use chart types. The most common way to use Google Charts is with simple JavaScript that you embed in your web page.
N/A
SAP Crystal
Score 7.3 out of 10
N/A
SAP Crystal is an analytics and reporting software solution for SMBs. SAP Crystal comprises Crystal Reports for pixel-perfect reporting, and SAP Crystal Server for automated distribution and self-service access to reports, dashboards and data exploration.
$295
per single user license
Pricing
Google Charts
SAP Crystal
Editions & Modules
No answers on this topic
Upgrade Version to SAP Crystal Reports 2020
$295
per single user license
SAP Crystal Reports 2020 64-Bit
$495
per single user license
SAP Crystal Reports 2016 32-Bit
$495
per single user license
SAP Crystal Server 2020 1 NUL
$869
per user license + first year maintenance to be added
SAP Crystal Server 2020 5 CAL
$8,744
5 concurrent users + first year maintenance to be added
Offerings
Pricing Offerings
Google Charts
SAP Crystal
Free Trial
No
Yes
Free/Freemium Version
Yes
Yes
Premium Consulting/Integration Services
No
Yes
Entry-level Setup Fee
No setup fee
Optional
Additional Details
—
* SAP Crystal Reports 2020 Viewer allows you to view static data within a SAP Crystal Reports file.
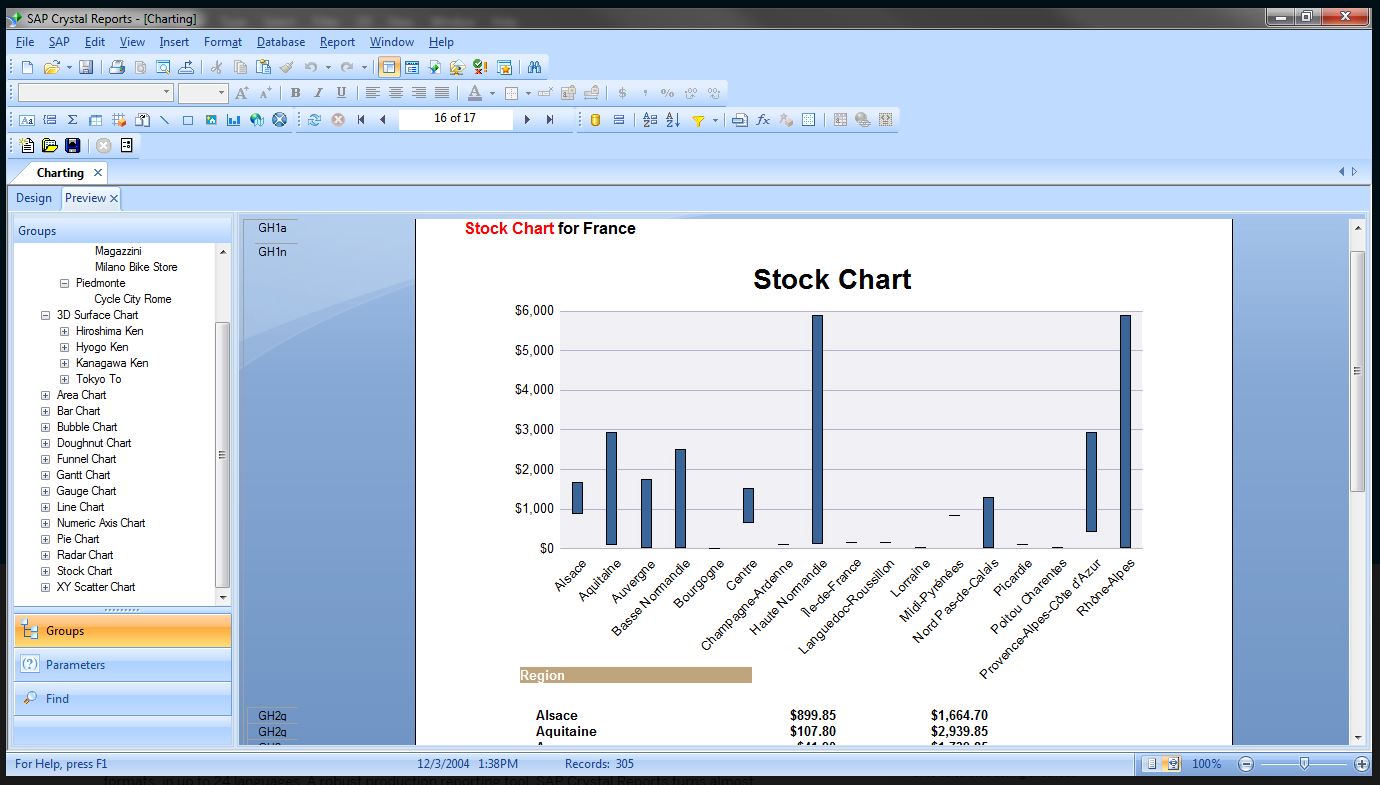
* SAP Crystal Reports 2020 - Full version allows you to create powerful, richly formatted, and dynamic reports from virtually any data source, delivered in dozens of formats, in up to 28 languages. If you already have an older version of Crystal Reports, buy a license for SAP Crystal Reports 2020 - Upgrade at a discounted, upgrade price.
* SAP Crystal Server 2020, 1 NUL includes 1 license of: SAP Crystal Reports 2020 - SAP Crystal Server 2020.
* As an add-on to SAP Crystal Server 2020 1 NUL, SAP Crystal Server 2020 5 CAL allows you to support a wider, intermittent audience of end users, up to five logged on at the same time.
Sisense is one of the best business intelligence software packages out there. It lets you easily chart all the data you would need. SAP is similar in that it helps companies create formatted and interactive business reports with a wealth of formatting options. One of the …
SAP Crystal Server stacks up better than Tableau Desktop and Google Charts because we found it was easier to customize and for what we needed it was easier to create the reports. So that is why we went with SAP Crystal Server over the other options that we had considered.
Crystal reports is useful in case we want to import data from data base . We can write queries in it but Google Charts require to be implemented in our application using code so crystal reports is better than Google Charts.
SAP Crystal Server is exactly what we need for our reporting, both internally and externally, and we consistently use the scheduled reporting option and set up automatic delivery to save us time. These features are the main reason why we decided that this program was the …
SAP Crystal Reports is great because it is easy to use (once you learn the program) and the possibilities are endless. We also use some other programs as well as SAP Crystal Reports for some additional reports and related visuals. We went to SAP because of the possibilities of …
We have a lot of clients who use SAP Crystal Server that we collaborate on reports with and this was a big reason for why we work with SAP Crystal Server. If I had to rate all the other analytics programs that I have worked with against SAP Crystal Server I would rate SAP …
We can easily recommend Google Charts to any company that needs a way to visually represent their data. Another great thing about Google Charts is that it is free to use and does not require any membership fees. Although it requires a skilled used to be able to use the charts, the results are great and can be beneficial to any company who is looking to make better decisions.
Generation of templated reports is the strong suit of SAP Crystal. Allows users to change formats in templates bases on requirement with minimal effort. Automated report delivery requires the user to be aware of sql which cannot be expected from all users. Should support more document export formats and improve the UI for SAP B1 Users
they're free with Google suite and they have backing in terms of powerful Google apps which can be plugged in to perform multiple actions like using Google sheets to import raw data into Google Charts
they're the most simple app to use when it comes to creating charts and visual dashboards
ease of customization
ease of using custom APIs from developers side to help make any types of charts and dashboards you want
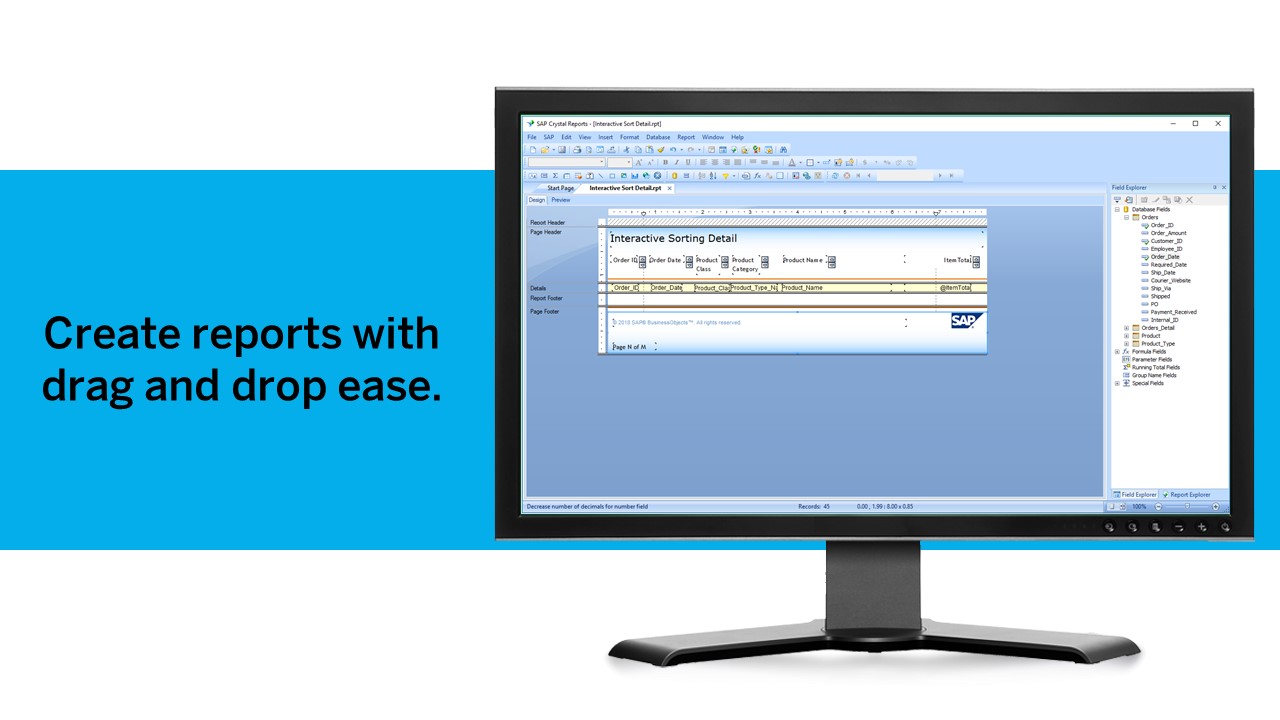
Crystal Reports allows us to create a consistent template for all of our reports.
Crystal Reports and Server allows us to house a repository for all of our reports to make them easy to find and update when necessary.
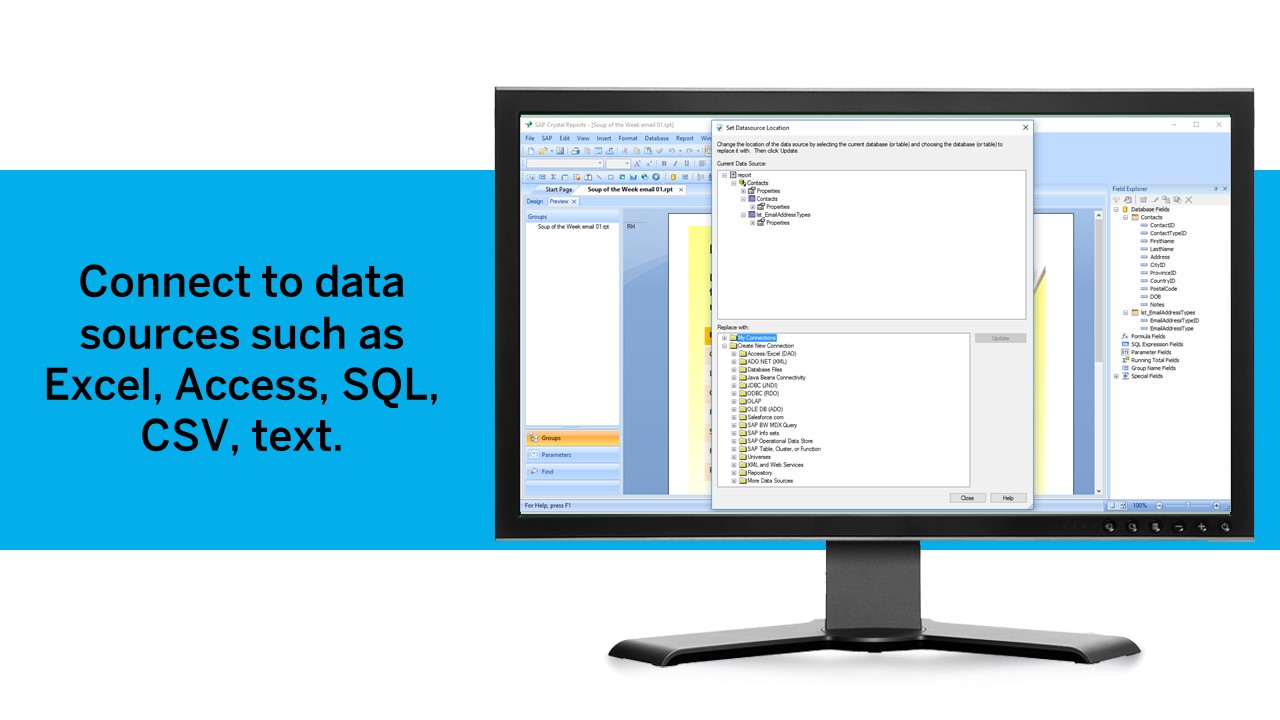
Crystal Reports can connect to a wide variety of data sources.
Crystal Reports can be a little daunting when first implementing. There are a lot of nuances in learning how to truly master this software and it can be frustrating at times.
I would like a couple more introductory videos or a live chat option for when you run into an issue. I think this is a Google-wide problem, not only linked to Google Charts.
I have run into some issues with the Dynamic Data but also admittedly could potentially dive in deeper and investigate.
It would be great if Google Charts made it possible to integrate Google Chat into the platform.
Google Charts is a good product. It's widely supported with deep documentation and a large community. But for me, it wasn't customizable enough. When we started with simple charts, it was great, but as we got deeper and more complex, our needs outgrew the library. If I was going forward, I would choose a more barebones library with more freedom and extensibility.
We have been using this product for so many years and it has truly become a cornerstone to our business processes when it comes to developing and distributing information via reports. We currently have over 500 reports developed to date over about 30 systems and that will continue to grow as user needs change.
Google Charts is about as easy to use as the rest of their applications. The UI is very well thought out, allowing you to add what you need, and customize it to your exact liking. The default theme is actually really nice, which helps as most of the time, customizing is not needed.
Crystal is very robust, but not always easy to use. It create wonderful looking reports, and so deserves a high rating. However, I have to take a couple of points off for the simple fact that I cannot hand it to a user and expect them to be able to do development with it.
As a free tool with massively powerful, infinitely customisable charts that can be dynamically updated - Google Charts is my favourite data visualisation tool. However, my hatred of JavaScript does jade my view on it. This is the price of the tool though, and I'm glad it's available for me.
The support community can be difficult to navigate. I've also run into issues with my login. The SAP system has a bizarre mechanism for validating users that requires users to have what is called an S-ID. A basic ID may not give you access to all the features in the portal. The limitation may include not being able to perform a simple task like downloading patches and updates. This isn't a big deal for single user license but for teams it can be a pain.
Just like any other implementation: When designing the differing reports, get end users' input, make sure to design the reports so that they display the information that the company requires, in the best and clearest way possible.
Test, test, test, revise when needed, and, particularly, do sufficient training so users are comfortable using Crystal Reports!
Google Charts stacks up better since it is free and does not have the constant pressure for cost overruns, add-ons, annual maintenance and implementation services. The speed of using Google Charts is quick, saving users potentially weeks in getting up and going. For the readers of websites with limited resources, the application shows up nicely is look and feel with charts. Great way of showing data visually.
Crystal reports is useful in case we want to import data from data base . We can write queries in it but Google Charts require to be implemented in our application using code so crystal reports is better than Google Charts.
It is a decent buy for specific departments in terms of reporting capabilities but updates and cost (frequent) demands are higher with the benefits offered.
So long as the requirements are not ever changing, with scheduling functionality, it's a handsome tool.