IBM Cognos Analytics vs. Lightning Tools Data Viewer

Overview
ProductRatingMost Used ByProduct SummaryStarting Price
IBM Cognos Analytics
Score 7.8 out of 10
N/A
IBM Cognos is a full-featured business intelligence suite by IBM, designed for larger deployments. It comprises Query Studio, Reporting Studio, Analysis Studio and Event Studio, and Cognos Administration along with tools for Microsoft Office integration, full-text search, and dashboards.
$10
per month per user
Lightning Tools Data Viewer
Score 9.1 out of 10
Mid-Size Companies (51-1,000 employees)
The Data Viewer provides data visualization in the form of reports or charts that can be created and customized to suit a business's needs. Silos of data exist in most organizations and yet contain valuable insights into how well the organization is performing and where action is needed. Those silos often include Microsoft Excel workbooks, Microsoft SQL Azure databases, On-Premises data sources accessible through OData or Business Connectivity Services and even SharePoint Lists. These data…
$2,200
per year per installation
Pricing
IBM Cognos AnalyticsLightning Tools Data Viewer
Editions & Modules
On Demand - Standard
USD 10.00
per month per user
On Demand - Premium
USD 42.40
per month per user
On Demand - Standard
USD 10.60
per month per user
Data Viewer OnPrem
$1,000
per year Per installation, 1 x WFE
Data Viewer Online
$2,200
per year per installation
Data Viewer OnPrem Enterprise Edition
POA
per year Per installation, 4+ WFE
Data Viewer Online Enterprise Edition
POA
per year per installation
Offerings
Pricing Offerings
IBM Cognos AnalyticsLightning Tools Data Viewer
Free Trial
YesYes
Free/Freemium Version
NoNo
Premium Consulting/Integration Services
YesYes
Entry-level Setup FeeOptionalNo setup fee
Additional DetailsPrices stated are minimum per installation for "stock" products. $2.20 per user / year on top of base price. Enterprise editions can be amended to suit business needs if deemed necessary, additional costs incurred and TBD. All packages include free technical support. Free upgrades available to latest versions of tool as they are released. (online version)
More Pricing Information
Community Pulse
IBM Cognos AnalyticsLightning Tools Data Viewer
Features
IBM Cognos AnalyticsLightning Tools Data Viewer
BI Standard Reporting
Comparison of BI Standard Reporting features of Product A and Product B
IBM Cognos Analytics
7.5
129 Ratings
8% below category average
Lightning Tools Data Viewer
9.1
1 Ratings
12% above category average
Pixel Perfect reports7.3119 Ratings00 Ratings
Customizable dashboards7.7125 Ratings9.11 Ratings
Report Formatting Templates7.4121 Ratings9.11 Ratings
Ad-hoc Reporting
Comparison of Ad-hoc Reporting features of Product A and Product B
IBM Cognos Analytics
7.5
129 Ratings
7% below category average
Lightning Tools Data Viewer
8.2
1 Ratings
5% above category average
Drill-down analysis7.0126 Ratings6.41 Ratings
Formatting capabilities7.6128 Ratings9.11 Ratings
Integration with R or other statistical packages7.491 Ratings00 Ratings
Report sharing and collaboration8.0122 Ratings9.11 Ratings
Report Output and Scheduling
Comparison of Report Output and Scheduling features of Product A and Product B
IBM Cognos Analytics
8.1
127 Ratings
1% below category average
Lightning Tools Data Viewer
-
Ratings
Publish to Web8.327 Ratings00 Ratings
Publish to PDF7.6121 Ratings00 Ratings
Report Versioning8.626 Ratings00 Ratings
Report Delivery Scheduling8.0123 Ratings00 Ratings
Delivery to Remote Servers8.112 Ratings00 Ratings
Data Discovery and Visualization
Comparison of Data Discovery and Visualization features of Product A and Product B
IBM Cognos Analytics
7.0
116 Ratings
13% below category average
Lightning Tools Data Viewer
3.6
1 Ratings
73% below category average
Pre-built visualization formats (heatmaps, scatter plots etc.)7.5111 Ratings3.61 Ratings
Location Analytics / Geographic Visualization7.5106 Ratings00 Ratings
Predictive Analytics6.6102 Ratings00 Ratings
Pattern Recognition and Data Mining6.439 Ratings00 Ratings
Access Control and Security
Comparison of Access Control and Security features of Product A and Product B
IBM Cognos Analytics
7.4
121 Ratings
14% below category average
Lightning Tools Data Viewer
-
Ratings
Multi-User Support (named login)7.3118 Ratings00 Ratings
Role-Based Security Model7.4117 Ratings00 Ratings
Multiple Access Permission Levels (Create, Read, Delete)6.6116 Ratings00 Ratings
Report-Level Access Control7.846 Ratings00 Ratings
Single Sign-On (SSO)8.1100 Ratings00 Ratings
Mobile Capabilities
Comparison of Mobile Capabilities features of Product A and Product B
IBM Cognos Analytics
6.6
101 Ratings
16% below category average
Lightning Tools Data Viewer
-
Ratings
Responsive Design for Web Access6.895 Ratings00 Ratings
Mobile Application6.785 Ratings00 Ratings
Dashboard / Report / Visualization Interactivity on Mobile7.091 Ratings00 Ratings
Application Program Interfaces (APIs) / Embedding
Comparison of Application Program Interfaces (APIs) / Embedding features of Product A and Product B
IBM Cognos Analytics
7.5
81 Ratings
3% below category average
Lightning Tools Data Viewer
-
Ratings
REST API7.178 Ratings00 Ratings
Javascript API7.575 Ratings00 Ratings
iFrames8.39 Ratings00 Ratings
Java API6.911 Ratings00 Ratings
Themeable User Interface (UI)7.110 Ratings00 Ratings
Customizable Platform (Open Source)7.87 Ratings00 Ratings
Best Alternatives
IBM Cognos AnalyticsLightning Tools Data Viewer
Small Businesses
Yellowfin
Yellowfin
Score 8.8 out of 10
Supermetrics
Supermetrics
Score 9.9 out of 10
Medium-sized Companies
Reveal
Reveal
Score 10.0 out of 10
Supermetrics
Supermetrics
Score 9.9 out of 10
Enterprises
Kyvos Semantic Layer
Score 9.5 out of 10
IBM Analytics Engine
Score 8.5 out of 10
All AlternativesView all alternativesView all alternatives
User Ratings
IBM Cognos AnalyticsLightning Tools Data Viewer
Likelihood to Recommend
7.5
(146 ratings)
9.1
(1 ratings)
Likelihood to Renew
8.2
(30 ratings)
-
(0 ratings)
Usability
7.3
(9 ratings)
-
(0 ratings)
Availability
8.6
(4 ratings)
-
(0 ratings)
Performance
9.0
(5 ratings)
-
(0 ratings)
Support Rating
1.0
(9 ratings)
-
(0 ratings)
In-Person Training
8.7
(4 ratings)
-
(0 ratings)
Online Training
8.0
(4 ratings)
-
(0 ratings)
Implementation Rating
7.0
(7 ratings)
-
(0 ratings)
Configurability
7.0
(3 ratings)
-
(0 ratings)
Ease of integration
5.7
(5 ratings)
-
(0 ratings)
Product Scalability
2.8
(4 ratings)
-
(0 ratings)
Vendor post-sale
7.0
(1 ratings)
-
(0 ratings)
Vendor pre-sale
7.0
(1 ratings)
-
(0 ratings)
User Testimonials
IBM Cognos AnalyticsLightning Tools Data Viewer
Likelihood to Recommend
IBM
IBM Cognos Analytics has great scheduling capabilities. A single report can be parameterized (e.g., “Store Manager ID”) and burst to thousands of recipients with their slice of data.IBM Cognos Analytics is a good fit for highly complex, multi-level calculations which can be handled by Report Studio. For example Monthly balance sheet that requires multi step calculation
Read full review
Lightning Tools
Lightning Tools Data Viewer is well suited for re-surfacing data and customizing its look and feel.
Read full review
Pros
IBM
  • We can make dozens of dispatchers all focusing on different types of workloads.
  • Friendly user interface, without the need for coding or complicated editing.
  • Highly functionality reporting tools.
  • We can easily create trigger when a certain threshold are met sending reports or alerts to needed parties.
Read full review
Lightning Tools
  • Shows Lists created on different sites to be seen and controlled on another site in a Tenant
  • Allows selection of layouts and coloring way beyond what other programs do.
  • Easy to learn and very functional.
Read full review
Cons
IBM
  • IBM Cognos Analytics enables customer data segmentation, which is essential for marketing, improving and streamlining purchasing behavior and preferences. This helps companies create more targeted and effective marketing campaigns.
  • Our clients Through data analysis, we can identify and observe trends in the behavior of other clients, allowing us to anticipate needs and adjust strategies to avoid consequences.
Read full review
Lightning Tools
  • Data Viewer has a graph feature that is old school flat design. We loved the In House real 3D graph Lightning Tools program.
Read full review
Likelihood to Renew
IBM
For an existing solution, renewing licenses does provide a good return on investment. Additionally, while rolling out scorecards and dashboards with little adhoc capabilities, to end users, cognos is very easily scalable. It also allows to create a solution that has a mix of OLAP and relational data-sources, which is a limitation with other tools. Synchronizing with existing security setup is easy too.
Read full review
Lightning Tools
No answers on this topic
Usability
IBM
We have a strong user base (3500 users) that are highly utilizing this tool. Basic users are able to consume content within the applied security model. We have a set of advanced users that really push the limits of Cognos with Report and Query Studio. These users have created a lot of personal content and stored it in 'My Reports'. Users enjoy this flexibility.
Read full review
Lightning Tools
No answers on this topic
Reliability and Availability
IBM
Reports can typically be viewed through any browser that can access the server, so the availability is ultimately up to what the company utilizing it is comfortable with allowing, though report development tends to be more picky about browsers and settings as mentioned above. It also has an optional iPad app and general mobile browsing support, but dashboards lack the mobile compatibility. What keeps it from getting a higher score is the desktop tools that are vital to the development process. The compatibility with only Windows when the server has a wide range of compatibility can be a real sore point for a company that outfits its employees exclusively with Mac or Linux machines. Of course, if they are planning on outsourcing the development anyways, it's a rather moot point
Read full review
Lightning Tools
No answers on this topic
Performance
IBM
Overall no major complaints but it doesn't handle DMR (Dimensionally Modeled for Relational) very well. DMR modelling is a capability that IBM Cognos Framework Manager provides allowing you to specify dimensional information for relational metadata and allows for OLAP-style queries. However, the capability is not very efficient and, for example, if I'm using only 2 columns on a 20-column model, the software is not smart enough to exclude 18 columns and the query side gets progressively larger and larger until it's effectively unusable.
Read full review
Lightning Tools
No answers on this topic
Support Rating
IBM
Why is their web application not working as fast as you think it should? They never know, and it is always a a bunch of shots in the dark to find out. Trying to download software from them is like trying to find a book at the library before computers were invented.
Read full review
Lightning Tools
No answers on this topic
In-Person Training
IBM
Onsite training provided by IBM Cognos was effective and as expected. They did not perform training with our data which was a bit difficult for our end-users.
Read full review
Lightning Tools
No answers on this topic
Online Training
IBM
The online courses they offer are thorough and presented in such a way that someone who isn't already familiar with the general design methodologies used in this field will be capable of making a good design. The training environments are provided as a fully self contained virtual machine with everything needed already to create the environments. We've had some persisting issues with the environments becoming unavailable, but support has been responsive when these issues arise and straightening them out for us
Read full review
Lightning Tools
No answers on this topic
Implementation Rating
IBM
Make sure that any custom tables that you have, are built into your metadata packages. You can still access them via SQL queries in Cognos, but it is much easier to have them as a part of the available metadata packages.
Read full review
Lightning Tools
No answers on this topic
Alternatives Considered
IBM
My company selected IBM Congos Analytics because of its advanced features and data representation for data analysis. Its row and column features are very effective for creating dashboards and reports to visualize data. It's chart representation and view format are very attractive and useful for representation.
Read full review
Lightning Tools
Lightning Tools Data Viewer is much easier and more powerful than Infowise similar viewer in their lineup. In this case, we use Data Viewer over the one offered by Infowise.
Read full review
Scalability
IBM
The Cognos architecture is well suited for scalability. However, the architecture must be designed with scalability in mind from day one of the implementation. We recently upgraded from 10.1 to 10.2.1 and took the opportunity to revamp our architecture. It is now poised for future growth and scalability.
Read full review
Lightning Tools
No answers on this topic
Return on Investment
IBM
  • We use the tool for data modeling as it helps in predictive data analysis for complex data, which is very similar to real-life scenarios.
  • Options of customizing & scheduling reports as per our requirements basis.
  • Has mobile application which works seamless.
  • API integration is not upto the mark with very limited options.
  • Licensing & Maintenance can go from cheap to expensive depending on the scope.
Read full review
Lightning Tools
  • It allows us to do things that would take a great deal more time to duplicate in SharePoint
  • It cuts down on ugly looking built in SP list layouts
  • Users find it easy to access, thus this product is more productive
Read full review
ScreenShots

IBM Cognos Analytics Screenshots

Screenshot of a natural language query, used in IBM Cognos Analytics to get AI-powered insights from data.Screenshot of AI-generated insights and forecasts that can be added with just a click of a button.Screenshot of a dashboard that can be generated automatically using IBM Cognos Analytics by uploading or selecting data.Screenshot of an AI-generated dashboard from a spreadsheet that was just uploaded. This offers a great starting point for the creative process.Screenshot of where to import data to IBM Cognos Analytics from CSV files and spreadsheets. Users can connect to cloud or on-premises data sources, including SQL databases, Google BigQuery, Amazon, and Redshift.Screenshot of a sample operational dashboard of a coffee shop created using IBM Cognos Analytics.

Lightning Tools Data Viewer Screenshots
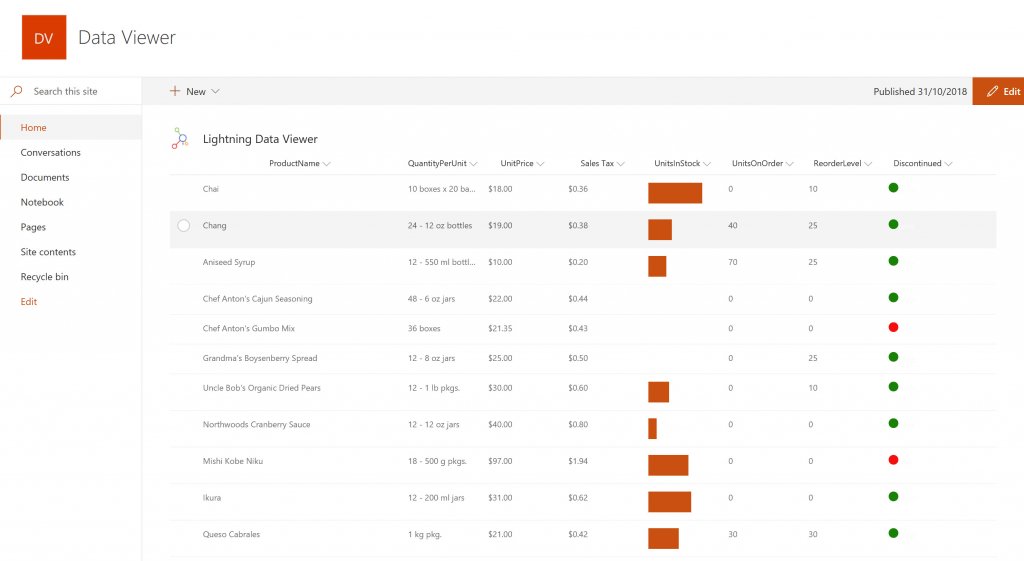
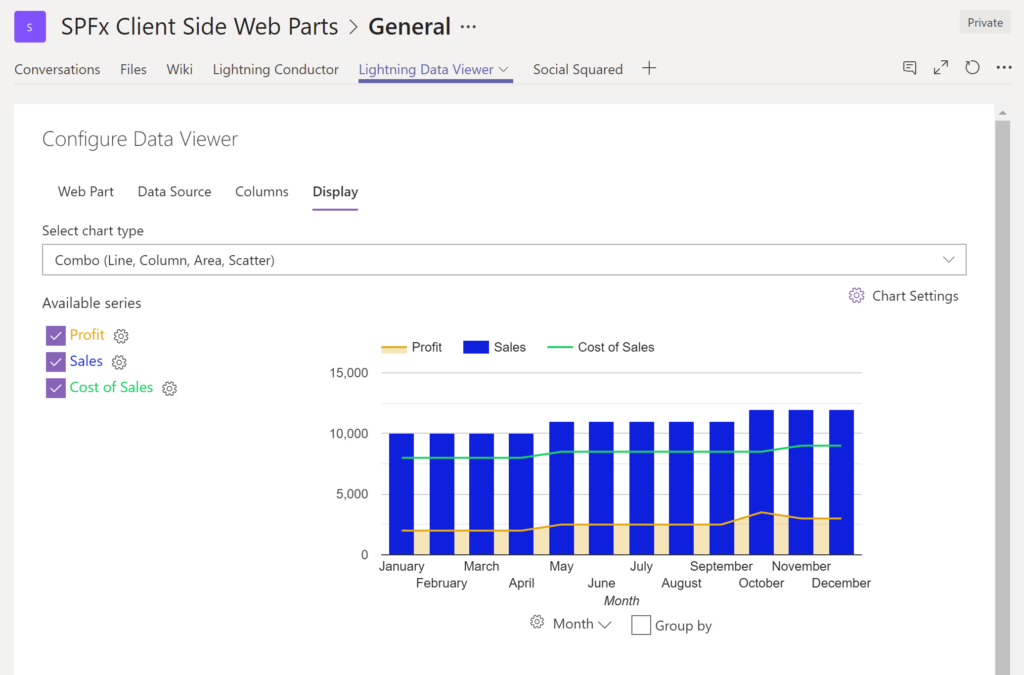
Screenshot of DISPLAYING EXTERNAL DATA WITHIN SHAREPOINT OR MICROSOFT TEAMS
The Data Viewer Client Side Web Part can be configured by Business Users within a few minutes to display Line of Business Data from Data Sources such as Excel,  SQL Azure, Business Connectivity Services, OData and SharePoint Lists.  Connections to an organizations data such as Customer Relationship Management Systems, Accounting Systems, or Custom Databases can be connected, giving business users a live up-to-date view of business information within the context of their SharePoint Team Sites or Microsoft Teams Tabs.Screenshot of HIGHLIGHTING KEY BUSINESS DATA (NO CODE)
Conditional formatting can be used to highlight key business data. Overdue Tasks, Low Stock, Currency Exchange Rates, Sales Revenue are examples of data to highlight visually allowing for a quick reaction time. Key Financial Indicators and Key Performance Indicators can be configured with a simple dialog and no need to write any code. Choose colours, icons or data bars to highlight key data.Screenshot of SELECTING AND STYLING ICONS
Icons can be chosen as part of the conditional formatting to make data stand out. The Office 365 Fabric icons can be selected and styled and applied to cell values. Pepper pots, Smileys, Envelopes and more icons are available. There are hundreds of options to choose from to highlight data that needs to be acted upon.Screenshot of DATA VIEWER CAN BE A GRID OF DATA OR A CHART IN SHAREPOINT OR MICROSOFT TEAMS
The Data Viewer can be used within Microsoft SharePoint Modern Sites or Microsoft Teams Tabs as a Grid of Data with styling or as a Chart which can be configured. The Charting Feature allows for Pie, Donut, Column, Line, Area, and Scatter Charts which can all be configured and displayed in 2D or 3D.Screenshot of TREEMAPS
summary information can be displayed within a TreeMap next to the detail. Users will be able to see trends, and how the business is performing  using the TreeMap view of data.Screenshot of CHARTS AND GAUGES
The Data Viewer is used to represent data in multiple ways using Gauges, TreeMaps, Multiple Series Charts, and Pie Charts.